
Market Overview:
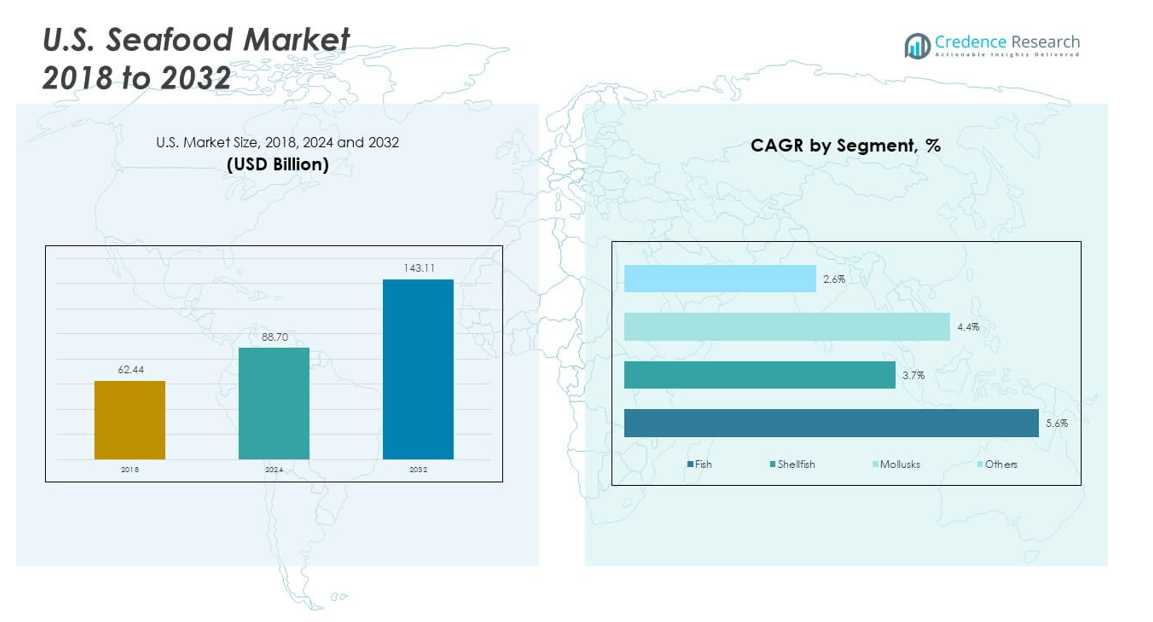
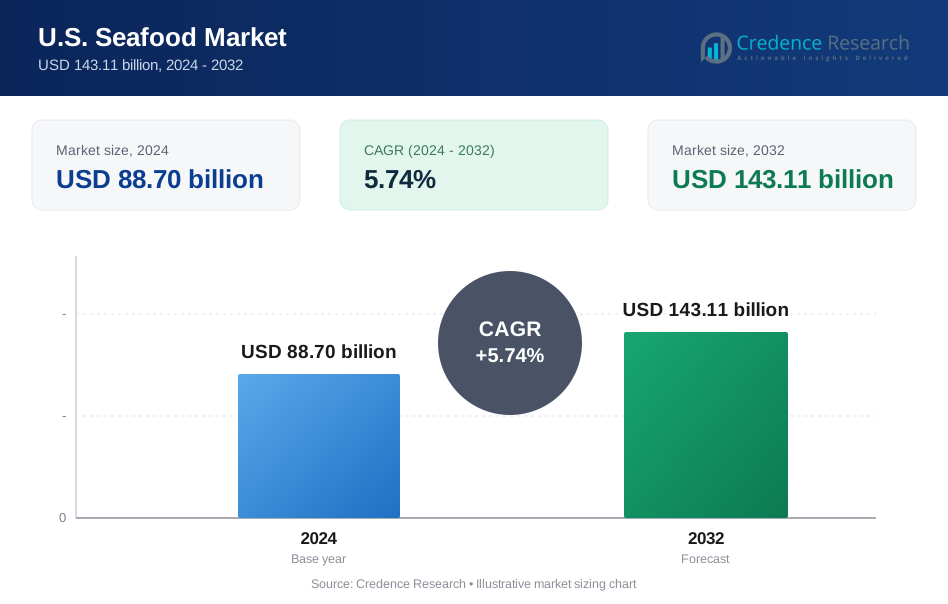
The U.S. Seafood Market size was valued at USD 62.44 billion in 2018 to USD 88.70 billion in 2024 and is anticipated to reach USD 143.11 billion by 2032, at a CAGR of 5.74% during the forecast period.
| REPORT ATTRIBUTE | DETAILS |
|---|---|
| Historical Period | 2020-2023 |
| Base Year | 2024 |
| Forecast Period | 2025-2032 |
| U.S. Seafood Market Size 2024 | USD 88.70 billion |
| U.S. Seafood Market, CAGR | 5.74% |
| U.S. Seafood Market Size 2032 | USD 143.11 billion |
Market drivers include growing health awareness, where seafood consumption supports balanced diets and provides essential nutrients such as omega-3 fatty acids. Expansion of the foodservice sector fuels demand, with restaurants and quick-service chains offering diverse seafood dishes to attract customers. Cold chain logistics and advanced storage systems maintain freshness, expanding distribution into inland areas. Consumer preference for convenience also drives the popularity of frozen, canned, and processed seafood. Sustainability standards and traceability systems are further encouraging market adoption across retail and foodservice.
Regional dynamics highlight the Northeast and West Coast as the leading regions due to abundant resources and established fishing industries. Alaska, Maine, and Massachusetts drive supply strength with key seafood categories, while California and Washington expand demand through aquaculture and retail growth. The South, particularly the Gulf Coast states, continues to emerge with strong production of shrimp, oysters, and crab. Inland regions are growing quickly, supported by cold chain innovations and e-commerce platforms that expand consumer access to fresh and frozen seafood across the country.
Market Insights
- The U.S. Seafood Market was valued at USD 62.44 billion in 2018, reached USD 88.70 billion in 2024, and is projected to achieve USD 143.11 billion by 2032, at a CAGR of 5.74%.
- The Northeast holds 32% of the share due to strong fishing hubs, while the West Coast accounts for 29% supported by Alaska and California, and the South contributes 21% led by Gulf Coast production.
- The Midwest, with 18% share, is the fastest-growing region driven by frozen and processed seafood demand supported by strong cold chain logistics.
- Fish represented the largest product type share at 47% in 2024, driven by high household and foodservice consumption.
- Shellfish followed with 27% share, supported by restaurant demand and premium positioning in retail markets.
Market Drivers
Rising Health Awareness And Shift Toward Protein-Rich And Omega-3 Enriched Diets
Consumers are more aware of the health benefits linked to seafood consumption. It provides essential proteins, omega-3 fatty acids, and vital nutrients missing from other meats. This dietary shift strengthens long-term demand across multiple product categories. The U.S. Seafood Market benefits from rising emphasis on balanced diets promoted by healthcare professionals. Households view seafood as a healthier alternative to red meat and processed protein sources. Government campaigns and wellness programs further promote seafood inclusion in weekly meals. Increased demand comes from both young professionals and aging populations focused on heart health. This driver remains central to shaping the future of seafood consumption.
- For instance, Trident Seafoods produces its Pure Catch® omega-3 supplement line using wild-caught Alaska pollock and salmon. The products are marketed as sustainably sourced, traceable, and low in mercury, aligning with the company’s focus on responsible seafood. Pure Catch® highlights its origin from Alaska’s certified fisheries and is positioned as a reliable option for consumers seeking omega-3 supplements derived from wild seafood.
Expansion Of Foodservice Industry And Diversification Of Seafood-Based Menu Offerings
Restaurants, hotels, and quick-service outlets strongly influence seafood sales across the country. They introduce new menu formats such as sushi, poke bowls, and grilled options to attract diverse consumers. The U.S. Seafood Market grows as chains expand seafood offerings beyond traditional dishes. Demand increases further during festive seasons and regional events that highlight local catches. Chefs experiment with fusion cuisines to boost consumer interest and repeat purchases. It benefits suppliers by creating opportunities for steady bulk demand. Foodservice delivery platforms also accelerate seafood consumption through online ordering. This dynamic reinforces seafood’s role as both a staple and premium food choice.
Technological Improvements In Cold Chain Logistics And Advanced Preservation Methods
Maintaining freshness of seafood requires robust storage and transportation solutions. Cold chain improvements ensure product quality remains intact from ocean to consumer. The U.S. Seafood Market advances with better refrigeration units, packaging, and automated monitoring systems. Companies invest in temperature-controlled vehicles to meet food safety regulations. Extended shelf life supports wider reach into inland regions with limited coastal access. It also enables exports and imports without compromising product quality. Retailers gain confidence when handling frozen and fresh products for long distances. Enhanced preservation methods maintain flavor integrity, sustaining consumer trust in packaged seafood.
- For example, in February 2025, Americold announced a $79 million investment in a new cold storage development at Port Saint John, Canada, in partnership with DP World and CPKC. The project will create an import–export hub with about 22,000 pallet positions, strengthening Americold’s presence in North America’s cold chain infrastructure. The facility supports broader logistics growth and reflects Americold’s ongoing strategy to expand capacity across key trade corridors.
Sustainability Certifications And Traceability Standards Increasing Consumer Confidence
Sustainability plays a critical role in shaping consumer behavior and supplier operations. The U.S. Seafood Market records stronger demand for products carrying certifications from trusted agencies. It allows buyers to verify that seafood originates from legal and responsible sources. Retailers and restaurants highlight traceability labels to reinforce brand reliability. Consumers prefer seafood from fisheries with low environmental impact and strong compliance records. Growing adoption of blockchain systems allows real-time tracking across supply chains. Suppliers differentiate themselves through eco-labels and transparent sourcing policies. This driver enhances reputation while creating stronger brand loyalty in a competitive market.
Market Trends
E-Commerce Expansion And Rising Preference For Online Seafood Purchasing Platforms
Digital platforms are redefining how seafood reaches end consumers. The U.S. Seafood Market gains traction as buyers choose online channels for convenience. It enables access to wider product assortments and regional specialties beyond local availability. Subscription models for fresh seafood delivery continue to gain popularity. Retailers highlight freshness guarantees and flexible return policies to boost trust. It aligns with changing consumer shopping habits favoring contactless purchases. Packaging innovations ensure freshness during last-mile delivery across large distances. Online channels establish new opportunities for small-scale fisheries to connect with national consumers.
- For example, Maine Lobster Now offers free UPS Next-Day Air overnight shipping for all U.S. orders over $150. Orders under $150 ship for a flat rate of $40. They ship live, fresh, or frozen seafood, selecting order dates so customers receive products promptly with perishable goods handled accordingly.
Introduction Of Value-Added Products And Ready-To-Cook Seafood Meal Solutions
Modern households seek convenience in preparing seafood meals with minimal effort. Companies respond with ready-to-cook, marinated, and portion-controlled products. The U.S. Seafood Market benefits as busy consumers prioritize speed without compromising nutrition. Retailers highlight microwavable packaging and pre-seasoned portions to simplify preparation. It caters to working families and younger buyers with limited cooking time. Value-added seafood helps reduce waste through better portion management. This trend supports premium pricing strategies while increasing household penetration. Demand rises steadily for products blending convenience with authentic taste experiences.
Innovations In Aquaculture Production Techniques And Sustainable Farming Practices
Aquaculture is evolving as a critical contributor to seafood supply. Farmers adopt recirculating aquaculture systems and integrated multi-trophic farming to boost yields. The U.S. Seafood Market strengthens as reliance on imports reduces with local production. It supports consistent supply regardless of wild catch fluctuations. Technology adoption includes automated feeding systems and water quality monitoring. Aquaculture firms invest in sustainable feed alternatives to reduce environmental impact. This trend fosters long-term resilience across supply chains. Growing acceptance of farmed fish among consumers stabilizes market demand.
Premiumization Of Seafood Products Through Specialty Cuts And Exotic Imports
Rising disposable incomes encourage consumers to try specialty seafood varieties. Retailers expand offerings with exotic imports, premium cuts, and rare shellfish. The U.S. Seafood Market thrives as buyers associate seafood with luxury dining. It creates opportunities for premium restaurants and gourmet retailers. Consumers seek unique flavors and exclusive experiences linked to seafood categories. Specialty processing techniques enhance presentation and taste. It fosters growth in gifting and festive purchase segments. Premiumization strengthens value generation across supply chains, creating new growth pathways.
- For example, Riviera Seafood Club, a Los Angeles–based family business, offers premium sushi-grade seafood such as Bluefin Tuna and scallops. It operates a direct-to-consumer model, shipping seafood across the U.S. through its online platform.
Market Challenges Analysis
Fluctuating Raw Material Supply And Rising Pressure From Global Climate Variations
The seafood industry remains vulnerable to unpredictable environmental changes affecting wild catches. The U.S. Seafood Market experiences supply instability due to changing ocean temperatures and overfishing concerns. It raises procurement costs and limits access to certain species. Extreme weather events disrupt harvests and create shipping delays. Fishermen and suppliers face risks from shifting regulatory limits on catch quotas. Supply fluctuations challenge processors reliant on steady volumes. Consumers encounter price volatility, reducing affordability for some product categories. This challenge requires coordinated strategies to stabilize sourcing and ensure long-term supply.
Regulatory Pressures, Trade Policies, And Ongoing Issues Of Illegal Fishing Activities
Strict food safety standards increase operational complexity across domestic and import channels. The U.S. Seafood Market adapts to frequent updates in regulatory frameworks. It faces compliance hurdles with labeling, sustainability certification, and inspection requirements. Trade disputes with exporting nations create uncertainty in supply chains. Illegal fishing practices damage industry reputation and limit consumer trust. Regulators impose stronger enforcement mechanisms to deter non-compliance. Retailers and suppliers invest heavily in audits and reporting systems. This challenge places cost burdens while reshaping how companies compete in the seafood sector.
Market Opportunities
Growth Of Plant-Based Seafood Alternatives And Expansion Into Hybrid Protein Products
The demand for alternative proteins presents new pathways for seafood producers. The U.S. Seafood Market gains opportunities from rising plant-based seafood innovation. It appeals to consumers seeking ethical, allergen-free, and sustainable substitutes. Hybrid proteins that combine seafood with plant ingredients attract flexitarian buyers. Companies experiment with algae, soy, and pea protein bases. It strengthens market diversity and broadens product acceptance. Retailers benefit from appealing to both seafood enthusiasts and non-seafood eaters. Expansion into this category enhances resilience against supply risks in traditional seafood.
Expanding Role Of Exports And Strategic Penetration Into High-Growth Global Markets
International markets create strong prospects for U.S. seafood suppliers. The U.S. Seafood Market expands its footprint through exports to Asia and Europe. It benefits from global demand for premium, sustainably sourced products. Trade agreements and bilateral partnerships ease entry into new markets. Suppliers position U.S. seafood as a high-quality and safe option. It strengthens brand value while diversifying revenue streams. Global expansion reduces dependency on domestic consumption cycles. Export-focused growth secures long-term opportunities for U.S. seafood producers in competitive landscapes.
Market Segmentation Analysis
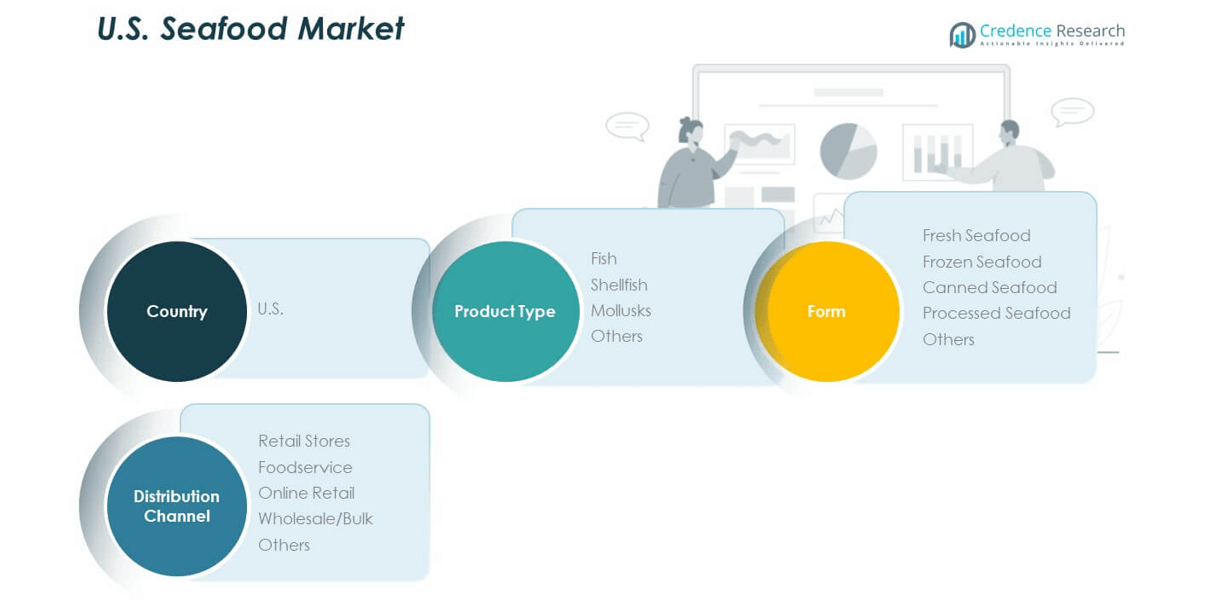
By product type, fish dominates the U.S. Seafood Market due to its wide consumption across households and foodservice outlets. Shellfish follows with strong demand from restaurants and premium retail channels, while mollusks maintain steady growth supported by consumer interest in diverse cuisines. Other categories, including niche and specialty seafood, contribute smaller shares yet add value through regional preferences. It benefits from balanced growth across traditional staples and specialty offerings that enhance variety.
- For instance, Bumble Bee Seafoods provides full product traceability for tuna, salmon, and sardines via its “Trace My Catch” platform, letting U.S. consumers identify species, catch method, and fishery for every can by entering its production code.
By form, fresh seafood continues to command the highest preference, reflecting consumer trust in quality and taste. Frozen seafood secures a strong position with extended shelf life and wider distribution reach across inland regions. Canned seafood supports stable consumption in households seeking affordability and convenience. Processed seafood gains traction with value-added and ready-to-cook products tailored to busy lifestyles. Other forms maintain importance through localized and specialty-based supply chains. It reflects the diverse consumption behavior shaping the seafood industry.
- For example, Sea to Table delivers wild-caught, flash-frozen seafood sourced exclusively from U.S. fisheries to households nationwide. The company emphasizes traceability and transparent labeling, ensuring consumers know the source of their seafood.
By distribution channel, retail stores remain the largest sales avenue supported by strong consumer reliance on supermarkets and specialty outlets. Foodservice plays a crucial role in driving demand through restaurants, hotels, and quick-service operators. Online retail continues to grow rapidly, supported by digital platforms offering subscription services and fresh delivery models. Wholesale and bulk channels sustain strong supply chains for institutional buyers and regional distributors. Other channels maintain importance in niche markets with localized demand. It underscores the dynamic balance between traditional retail strength and emerging digital sales networks.
Segmentation
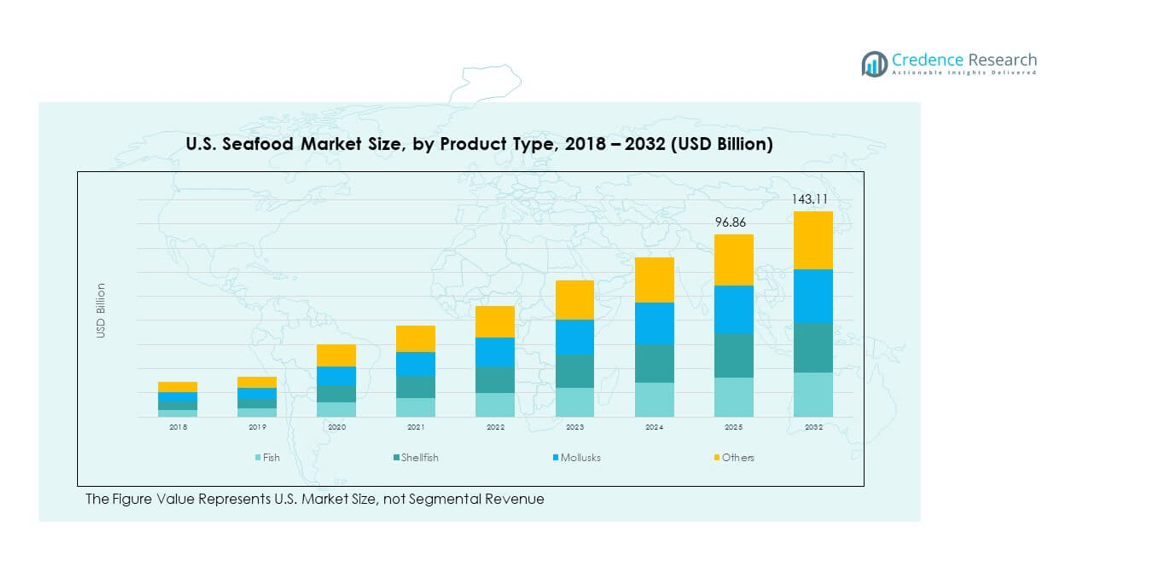
By Product Type
- Fish
- Shellfish
- Mollusks
- Others
By Form
- Fresh Seafood
- Frozen Seafood
- Canned Seafood
- Processed Seafood
- Others
By Distribution Channel
- Retail Stores
- Foodservice
- Online Retail
- Wholesale/Bulk
- Others
Regional Analysis
Northeast and West Coast Subregions
The Northeast accounts for 32% of the U.S. Seafood Market share, supported by established fishing hubs in Maine and Massachusetts. Lobster, scallops, and cod drive strong revenue, while seafood exports add to regional importance. The West Coast contributes 29% of the share, anchored by Alaska, California, and Washington. Alaska remains dominant with salmon, pollock, and crab, while California builds consumption through strong retail and restaurant demand. Washington’s aquaculture industry adds resilience to supply chains. It benefits from diverse resources and robust trade connections to Asia.
South and Gulf Coast Subregions
The South captures 21% of the market, with Louisiana, Texas, and Florida leading production. Shrimp, oysters, and crab dominate the Gulf Coast supply, supported by strong domestic and export demand. Florida’s seafood trade infrastructure fuels consumption growth in both retail and foodservice. Louisiana benefits from shrimp farming and crab harvesting that stabilize revenues. The subregion continues to invest in sustainable aquaculture to reduce pressure on wild stocks. It positions itself as a key hub for seafood distribution across inland states.
Midwest And Inland Subregions
The Midwest holds 18% of the U.S. Seafood Market share, driven by rising frozen and processed seafood demand. Consumers in Illinois, Michigan, and Ohio rely on advanced cold chain logistics for consistent access. Inland cities adopt seafood into mainstream diets supported by expanding retail networks. Online sales and e-commerce platforms help extend reach into less accessible areas. Growth comes from processed, canned, and ready-to-cook seafood categories appealing to busy households. It underscores the importance of logistics and packaging innovation in expanding seafood penetration.
Key Player Analysis
- Trident Seafoods
- Mowi USA
- Pacific Seafood Group
- High Liner Foods
- Chicken of the Sea International
- Peter Pan Seafood
- American Seafoods Group
- Blue Harvest Fisheries
- Clearwater Seafoods USA
- Phillips Foods Inc.
Competitive Analysis
The U.S. Seafood Market is highly competitive, with established players controlling strong supply chains and distribution networks. Trident Seafoods, Mowi USA, and Pacific Seafood Group dominate through vertical integration and extensive product portfolios. High Liner Foods and Chicken of the Sea International strengthen positions with strong retail presence and processed seafood offerings. American Seafoods Group and Peter Pan Seafood focus on wild catch categories, while Blue Harvest Fisheries and Clearwater Seafoods USA build expertise in shellfish and premium exports. Phillips Foods Inc. supports growth with specialty seafood products and foodservice penetration. Competition emphasizes sustainability certifications, traceability solutions, and product innovation. Companies invest in aquaculture, cold chain infrastructure, and premium product development to secure long-term demand. It remains shaped by consumer trust in certified sourcing and consistent quality. Strategic acquisitions, product launches, and regional expansions reinforce competitive positioning. The industry requires constant adaptation to environmental, regulatory, and trade pressures while capturing growth opportunities across domestic and international markets.
Recent Developments
- In July 2025, Mark Foods, a leading U.S. importer and marketer of premium seafood products, announced the acquisition of Maine-based Bristol Seafood, which specializes in sea scallops, groundfish, and value-added seafood offerings. This acquisition aims to expand Mark Foods' product offerings and strengthen its position in the scallop market, with the transaction expected to close in August 2025.
- In May 2025, MOWI, a global seafood giant, introduced its new “MOWI Signature” Atlantic salmon product to the U.S. foodservice market at the National Restaurant Association Show in Chicago, Illinois. The MOWI Signature product line offers fresh, never frozen, fully trimmed, and cleaned salmon tailored for professional kitchens, targeting chefs seeking premium-quality seafood.
- In April 2025, Chicken of the Sea, a major shelf-stable seafood provider in the U.S., launched a new Wild-Caught Light Tuna Packet with Ghost Pepper, capitalizing on the trend for spicy flavors and on-the-go, high-protein snacks. This product was released amid rising demand for convenient seafood snack options in the U.S. market.
Report Coverage
The research report offers an in-depth analysis based on Product Type, Form and Distribution Channel. It details leading market players, providing an overview of their business, product offerings, investments, revenue streams, and key applications. Additionally, the report includes insights into the competitive environment, SWOT analysis, current market trends, as well as the primary drivers and constraints. Furthermore, it discusses various factors that have driven market expansion in recent years. The report also explores market dynamics, regulatory scenarios, and technological advancements that are shaping the industry. It assesses the impact of external factors and global economic changes on market growth. Lastly, it provides strategic recommendations for new entrants and established companies to navigate the complexities of the market.
Future Outlook
- The U.S. Seafood Market will advance with stronger demand for protein-rich diets across diverse age groups.
- Growth will come from expanding aquaculture production, reducing reliance on wild catches and imports.
- Sustainability and eco-certifications will remain central to gaining consumer trust and premium positioning.
- E-commerce platforms will strengthen seafood accessibility, reshaping buying behavior across inland regions.
- Value-added products, including ready-to-cook and marinated seafood, will gain wider household adoption.
- Cold chain logistics and advanced preservation technologies will ensure higher quality and wider reach.
- Foodservice outlets will diversify menus with global seafood cuisines, driving consistent demand.
- Premiumization of products through exotic imports and specialty cuts will support revenue growth.
- Export opportunities will increase, especially in Asia and Europe, for certified U.S. seafood products.
- Industry players will pursue innovation, strategic acquisitions, and digital traceability for long-term competitiveness.
Request a Free Sample
Fill in your details and we'll send you a free sample report.
- Sample data tables & charts
- Research methodology
Need a Custom Version of This Report?
Tailor the scope, geography, or segments to your exact requirements.
- Custom geography or segment scope
- Direct access to our analyst team
Frequently Asked Questions
What is the current market size for U.S. Seafood Market, and what is its projected size in 2032?
At what Compo und Annual Growth Rate is the U.S. Seafood Market projected to grow between 2024 and 2032?
Which U.S. Seafood Market segment held the largest share in 2024?
What are the primary factors fueling the growth of the U.S. Seafood Market?
Who are the leading companies in the U.S. Seafood Market?
Table of Content
Chapter 1. Report Introduction
- 1.1 Report Description & Purpose
- 1.1.1 Report Title & Market Definition
- 1.1.2 Unique Selling Propositions (USP) & Key Differentiators
- 1.1.3 Value Proposition for Stakeholders
- 1.2 Research Objectives
- 1.2.1 Market Sizing Objectives (Volume & Revenue)
- 1.2.2 Segmentation Objectives
- 1.2.3 Competitive Intelligence Objectives
- 1.2.4 Forecast & Scenario Objectives
- 1.3 Report Scope
- 1.3.1 U.S. Seafood Scope – Types & Subtypes Covered
- 1.3.2 Geographic Scope – Regions & Countries Covered
- 1.3.3 Historical Period, Base Year & Forecast Period (2024; forecast to 2032)
- 1.3.4 Inclusions & Exclusions
- 1.4 HS Code & Classification Framework
- 1.5 Currency, Units & Pricing Basis
- 1.6 Target Stakeholders
- 1.7 Limitations & Assumptions
Chapter 2. Executive Summary
- 2.1 Global U.S. Seafood Market Snapshot
- 2.1.1 Market Size – Historical (2024) & Forecast (2024-2032) (2024: USD 88.70 billion → 2032: USD 143.11 billion)
- 2.1.2 Volume & Revenue – Global Totals
- 2.1.3 Key Market Highlights – Top Five Facts
- 2.2 U.S. Seafood Market Segmentation Snapshot
- 2.2.1 Market Split by Region – 2024 vs. 2032
- 2.3 Competitive Snapshot
- 2.3.1 Top 10 Players by Revenue Share – 2024
- 2.3.2 Top 10 Players by Volume Share – 2024
- 2.3.3 Recent Strategic Developments (18-Month Summary)
- 2.4 Key Investment Highlights & Strategic Conclusions
Chapter 3. U.S. Seafood Market Dynamics & Industry Analysis
- 3.1 Market Overview & Context
- 3.1.1 U.S. Seafood Market Position in the Broader Automotive Value Chain
- 3.1.2 OEM vs. Replacement Market Dynamics
- 3.1.3 Market Maturity & Development Stage by Region
- 3.2 U.S. Seafood Market Drivers
- 3.3 U.S. Seafood Market Restraints & Challenges
- 3.4 U.S. Seafood Market Opportunities
- 3.5 Porter's Five Forces Analysis
- 3.5.1 Threat of New Entrants
- 3.5.2 Bargaining Power of Suppliers
- 3.5.3 Bargaining Power of Buyers
- 3.5.4 Threat of Substitutes
- 3.5.5 Competitive Rivalry – Intensity Assessment
- 3.6 U.S. Seafood Value Chain Analysis
- 3.6.1 Upstream – Raw Material/Input Suppliers
- 3.6.1.1 Raw Material/Input 1
- 3.6.1.2 Raw Material/Input 2
- 3.6.1.3 Raw Material/Input 3
- 3.6.2 Midstream – Production/Manufacturing/Service Delivery
- 3.6.2.1 Production/Process Overview
- 3.6.2.2 Key Facility Locations & Capacity by Manufacturer
- 3.6.3 Downstream – Distribution & End Consumer
- 3.6.3.1 Primary Channel – B2B/OEM
- 3.6.3.2 Secondary Channels – Dealer, Retail, Online, Direct
- 3.6.4 Value Chain Profitability Analysis
- 3.6.1 Upstream – Raw Material/Input Suppliers
- 3.7 PESTEL Analysis
- 3.7.1 Political Factors
- 3.7.2 Economic Factors
- 3.7.3 Social Factors
- 3.7.4 Technological Factors
- 3.7.5 Environmental Factors
- 3.7.6 Legal Factors
- 3.8 U.S. Seafood Supply Chain Analysis
- 3.8.1 Raw Material/Input Supply Risk Assessment
- 3.8.2 Manufacturing Concentration Risk (Geographic Exposure)
- 3.8.3 Trade Disruption Impact Analysis
- 3.9 Regulatory & Policy Landscape
Note: The regulatory and policy landscape section covers regulations based on their applicability to the market, U.S. Seafood category, geography, and scope of the study. Only regulatory frameworks with a material impact on operations, compliance, trade, sustainability, or market access are analyzed in detail.
Chapter 4. Key Investment Pockets & Opportunity Analysis
- 4.1 U.S. Seafood Market Attractiveness Analysis
- 4.1.1 By Region – Investment Attractiveness Matrix (Volume × CAGR)
- 4.2 Absolute Revenue Growth Opportunity
- 4.2.1 By Region – Absolute USD Growth Through 2032
- 4.3 Incremental Volume Opportunity
- 4.3.1 By Region – Incremental Volume Through 2032
- 4.3.2 Segment – Incremental Volume
- 4.4 Emerging Submarket Opportunity Deep Dive (Subject to Applicability)
- 4.5 Emerging Market Opportunity Scorecards
- 4.5.1 United States
- 4.5.2 Europe
- 4.5.3 Asia
- 4.5.4 Middle East & Africa
Note: Emerging Market Opportunity Scorecards will be included based on relevance and strategic importance. Regions listed are indicative and may vary depending on data availability and market dynamics.
Chapter 5. U.S. Seafood Import-Export Analysis & Trade Flows
- 5.1 Global Trade Overview
- 5.1.1 Global Export Value by Country (2024)
- 5.1.2 Global Export Volume by Country (2024)
- 5.1.3 Global Import Value by Country (2024)
- 5.1.4 Global Import Volume by Country (2024)
- 5.1.5 Net Trade Balance by Country (2024)
- 5.2 Export Analysis – Segment
- 5.2.1 Type 1 (HS Code)
- 5.2.2 Type 2 (HS Code)
- 5.2.3 Type 3 (HS Code)
- 5.2.4 Type 4 (HS Code)
- 5.2.5 Type 5 (HS Code)
- 5.3 Import Analysis – Segment
- 5.3.1 Type 1 (HS Code)
- 5.3.2 Type 2 (HS Code)
- 5.3.3 Type 3 (HS Code)
- 5.3.4 Type 4 (HS Code)
- 5.3.5 Type 5 (HS Code)
- 5.4 Average Unit Trade Prices
- 5.4.1 Average Export Price – Segment & Country
- 5.4.2 Average Import Price – Segment & Source Country
- 5.4.3 Price Trends (2024)
- 5.5 Key Trade Route Analysis
- 5.5.1 Trade Route 1
- 5.5.2 Trade Route 2
- 5.5.3 Trade Route 3
- 5.5.4 Trade Route 4
- 5.5.5 Trade Route 5
- 5.6 Trade Policy Impact Assessment
- 5.6.1 US Anti-Dumping & Section 301 Tariffs
- 5.6.2 EU Customs Union Impact
- 5.6.3 Major Free Trade Agreements
- 5.6.4 USMCA Rules of Origin
Note: Trade policy analysis will be included only where relevant to the U.S. Seafood market.
Chapter 6. Competitive Landscape & Company Benchmarking
- 6.1 U.S. Seafood Market Concentration & Structure
- 6.1.1 Herfindahl-Hirschman Index (HHI) – vs. 2024
- 6.1.2 Tier 1, Tier 2 & Tier 3 Market Structure
- 6.1.3 Global, Regional & Local Player Dynamics
- 6.2 U.S. Seafood Market Share Analysis – 2024
- 6.2.1 Global Revenue Share by Company
- 6.2.2 Global Volume Share by Company
- 6.2.3 Regional Revenue Share
- 6.2.4 Market Share Evolution ( vs. 2024)
- 6.2.5 OEM Segment Share by Company
- 6.2.6 Replacement Segment Share by Company
- 6.3 Production/Delivery Capacity & Facility Analysis
- 6.3.1 Global Installed Capacity
- 6.3.2 Capacity Utilization Rates
- 6.3.3 Production/Output Volume
- 6.3.4 Facility Locations & Capacity Map
- 6.3.5 Planned Capacity Additions
- 6.4 U.S. Seafood Competitive Benchmarking Matrix
- 6.4.1 Revenue, Volume, CAGR & Profitability Comparison
- 6.4.2 Channel Revenue Mix
- 6.4.3 Geographic Revenue Exposure
- 6.4.4 R&D Intensity
- 6.4.5 Sustainability Maturity
- 6.5 Strategic Developments in U.S. Seafood (Last 24 Months)
- 6.5.1 Mergers, Acquisitions & Divestments
- 6.5.2 New U.S. Seafood Launches
- 6.5.3 Facility Expansions
- 6.5.4 Strategic Alliances, Joint Ventures & Partnerships
- 6.5.5 Distribution Expansion & Market Entry
- 6.5.6 Sustainability & ESG Initiatives
- 6.6 Competitive Strategy Mapping
- 6.6.1 Leader, Challenger, Follower & Niche Classification
- 6.6.2 Pricing Strategy Comparison
- 6.6.3 Channel Strategy Matrix
Note: Strategic developments are included based on their materiality and the availability of reliable information.
Chapter 7. Global U.S. Seafood Market – By Distribution Channel
- 7.1 Segment Overview
- 7.1.1 Volume & Revenue Split by Channel (2024 & 2032)
- 7.1.2 Channel Mix Evolution (2024-2032)
Chapter 8. Regional Market Analysis – Global Overview
- 8.1 Global Regional Overview
- 8.1.1 Regional Volume Share
- 8.1.2 Regional Revenue Share
- 8.1.3 Regional Volume by Region
- 8.1.4 Regional Revenue by Region
- 8.1.5 Regional Forecast Through 2032
- 8.2 Cross-Regional Segment Analysis
- 8.2.1 By Distribution Channel
- 8.2.2 By Brand/Price Tier
Chapter 9. North America U.S. Seafood Market
- 9.1 United States
- 9.2 Canada
- 9.3 Mexico
Chapter 10. Europe U.S. Seafood Market
- 10.1 Germany
- 10.2 France
- 10.3 Italy
- 10.4 United Kingdom
- 10.5 Spain
- 10.6 Poland
- 10.7 Russia
- 10.8 Netherlands
- 10.9 Belgium
- 10.10 Sweden
- 10.11 Denmark
- 10.12 Norway
- 10.13 Rest of Europe
Chapter 11. Asia Pacific U.S. Seafood Market
- 11.1 China
- 11.2 India
- 11.3 Japan
- 11.4 South Korea
- 11.5 Thailand
- 11.6 Indonesia
- 11.7 Vietnam
- 11.8 Malaysia
- 11.9 Australia
- 11.10 Rest of Asia Pacific
Chapter 12. Latin America U.S. Seafood Market
- 12.1 Brazil
- 12.2 Argentina
- 12.3 Colombia
- 12.4 Chile
- 12.5 Rest of Latin America
Chapter 13. Middle East U.S. Seafood Market
- 13.1 Saudi Arabia
- 13.2 United Arab Emirates
- 13.3 Turkey
- 13.4 Israel
- 13.5 Iran
- 13.6 Rest of the Middle East
Chapter 14. Africa U.S. Seafood Market
- 14.1 South Africa
- 14.2 Egypt
- 14.3 Nigeria
- 14.4 Morocco
- 14.5 Rest of Africa
Chapter 15. U.S. Seafood Company Profiles
- 15.1 [Company 01]
- 15.1.1 Company Overview
- 15.1.2 Key Management Personnel
- 15.1.3 Products & Services Portfolio
- 15.1.4 Financial Performance
- 15.1.5 Key Market Focus & Geographic Presence
- 15.1.6 Recent Developments & Strategic Initiatives
Note: The company profile list is preliminary and may change based on research findings, market developments, data availability, and client requirements.
Chapter 16. Appendices
- Appendix A – List of Abbreviations & Acronyms
- Appendix B – Industry Classification Code Reference – Full Series
- Appendix C – Production & Capacity Data Tables
- Appendix D – End-Use & Demand Base Tables
- Appendix E – Consumption & Replacement Rate Assumptions
- Appendix F – ASP Reference Tables
- Appendix G – Manufacturing & Facility Database
- Appendix H – Import-Export Data Tables
- Appendix I – Regulatory Summary Tables
- Appendix J – Primary Research Participant List (Anonymized)
- Appendix K – Primary Research Questionnaire Framework
- Appendix L – Data Sources & Bibliography
- Appendix M – Market Size Divergence & Source Comparison
Chapter 17. Research Methodology
- 17.1 Research Framework & Philosophy
- 17.2 Secondary Research – Sources, Hierarchy & Data Extraction
- 17.3 Data Modeling – Bottom-Up & Top-Down Market Sizing
- 17.4 Primary Research – Stakeholder Framework, LOI & Sample Sizes
- 17.5 Forecast Methodology – Regression, Scenario & Sensitivity Analysis
- 17.6 Quality Control – Four-Layer Validation Framework
- 17.7 Limitations & Standard Assumptions
- 17.8 Disclaimer
