| REPORT ATTRIBUTE |
DETAILS |
| Historical Period |
2020-2023 |
| Base Year |
2024 |
| Forecast Period |
2025-2032 |
| Pressure Sensors Market Size 2024 |
USD 13,378.9 Million |
| Pressure Sensors Market, CAGR |
6.20% |
| Pressure Sensors Market Size 2032 |
USD 21,673.1 Million |
Market Overview:
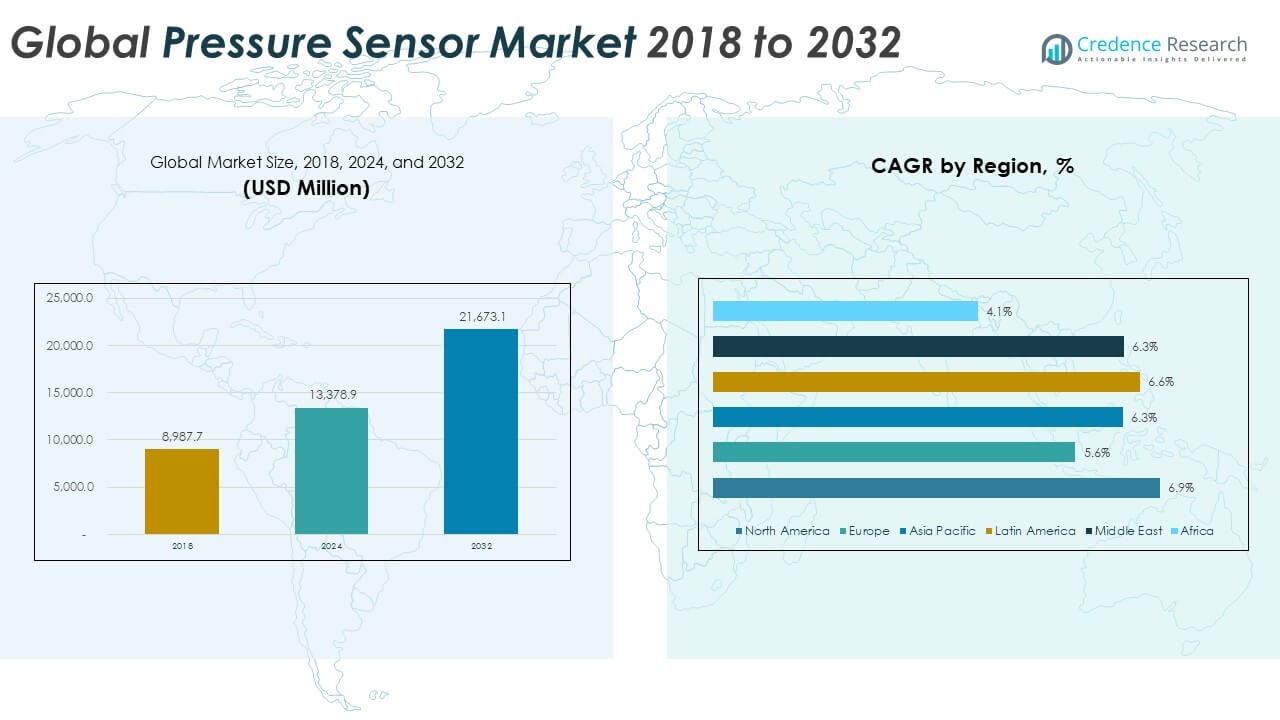
The Pressure Sensor Market size was valued at USD 8,987.7 million in 2018 to USD 13,378.9 million in 2024 and is anticipated to reach USD 21,673.1 million by 2032, at a CAGR of 6.20% during the forecast period.
Several key factors are driving the global pressure sensor market’s expansion. Industrial automation, driven by Industry 4.0 and IIoT trends, is fueling demand for sensors that can enable intelligent control systems and predictive analytics. Pressure sensors play a vital role in monitoring hydraulic, pneumatic, and fluid systems, improving safety and operational efficiency. In the automotive industry, these sensors are crucial for engine management, brake systems, airbag deployment, and tire pressure monitoring, especially as electric and autonomous vehicles gain market traction. Consumer electronics have also become a significant growth area, with pressure sensors used in smartphones, wearables, and home automation devices. In healthcare, the need for compact and accurate pressure sensors has surged, particularly in respiratory equipment and infusion systems. Moreover, technological advancements in MEMS and piezoresistive sensing have enhanced sensor precision while reducing form factor and power consumption, making them suitable for emerging and portable applications across multiple sectors.
Asia-Pacific leads the global pressure sensor market, holding around 36.6% of the market share in 2024. Rapid industrial growth, strong consumer electronics production, and extensive automotive manufacturing in countries like China, Japan, India, and South Korea drive regional dominance. India is expected to record the fastest growth. North America remains a key contributor, capturing 35% of the market due to its mature industrial base, early adoption of advanced technologies, and significant investments in defense and aerospace. The U.S., in particular, leads in the deployment of MEMS and high-performance sensors across industries. Europe also shows steady demand, led by Germany’s automotive and industrial automation sectors, supported by stringent safety and emissions regulations. Meanwhile, Latin America and the Middle East & Africa are gradually adopting pressure sensors in energy, healthcare, and transportation sectors, showing steady, albeit slower, growth trajectories.
Access crucial information at unmatched prices!
Request your sample report today & start making informed decisions powered by Credence Research Inc.!
Download Sample
Market Insights:
- The Pressure Sensor Market was valued at USD 13,378.9 million in 2024 and is projected to reach USD 21,673.1 million by 2032, growing at a CAGR of 6.20%, supported by rising demand across automotive, industrial, and healthcare sectors.
- Industrial automation and IIoT integration continue to drive market growth, with pressure sensors playing a crucial role in ensuring operational efficiency, predictive maintenance, and real-time system control.
- The automotive industry increasingly depends on pressure sensors for applications in engine performance, brake systems, and EV battery management, positioning them as essential components in next-gen mobility solutions.
- Consumer electronics and wearables are adopting compact MEMS-based pressure sensors for enhanced device functionality, supporting growth in home automation and smart living.
- Healthcare applications such as ventilators, infusion pumps, and portable monitors are generating strong demand for miniature, reliable pressure sensors designed for continuous monitoring and safety.
- The market faces cost and manufacturing challenges due to complex production processes, material requirements, and sensor calibration needs across varied environments.
- Asia-Pacific leads with 36.6% of the global share, driven by industrial and automotive output, followed by North America at 19% and Europe, where regulation and innovation ensure steady adoption.
Market Drivers:
Expansion of Industrial Automation and Integration of Smart Manufacturing Technologies
The growing shift toward industrial automation and smart manufacturing is a primary driver of the Pressure Sensor Market. Pressure sensors serve critical functions in monitoring and controlling hydraulic, pneumatic, and fluid systems in automated production environments. Manufacturers rely on them for real-time feedback that improves efficiency, ensures safety, and reduces downtime. The integration of Industrial Internet of Things (IIoT) technologies is increasing the deployment of intelligent sensors capable of transmitting accurate pressure data across networks. It supports predictive maintenance strategies and enhances process reliability. As factories modernize and adopt Industry 4.0 standards, the role of advanced pressure sensors becomes more central to operations.
- For instance, Building Automation Products, Inc. (BAPI) recently launched the ZPM Standard Accuracy Pressure Sensor, which offers ±1% accuracy and features a durable enclosure for harsh industrial environments. The sensor supports field-selectable outputs and adjustable ranges that can be configured without powering down the device, streamlining installation and maintenance processes.
Rising Demand for Safety and Efficiency in Automotive Applications
Automotive manufacturers continue to adopt pressure sensors to meet growing requirements for performance, safety, and emission control. These sensors support a wide range of vehicle systems, including engine optimization, fuel injection, brake modulation, and tire pressure monitoring. In electric vehicles (EVs) and autonomous models, sensors ensure battery safety, cabin pressure control, and system diagnostics. The Pressure Sensor Market benefits from increasing regulatory pressure for cleaner, safer, and smarter vehicles. It experiences steady demand from both established automakers and emerging EV startups. The transition to next-generation mobility solutions makes pressure sensors indispensable in automotive design and functionality.
- For instance, NXP Semiconductors’ FXPS7140X family exemplifies this trend, delivering highly accurate absolute and relative pressure measurements through configurable DSI3 and PSI5 interfaces in a compact QFN 4 × 4 × 1.98 mm package.
Proliferation of Wearable Technology and Smart Consumer Devices
Consumer electronics manufacturers are embedding pressure sensors into a growing range of portable devices. Smartwatches, smartphones, fitness trackers, and augmented reality headsets use these sensors to measure altitude, detect movement, and support touch-sensitive interfaces. Compact MEMS-based pressure sensors allow for high precision in minimal space, enabling better performance in slimmer devices. It sees increasing relevance in home automation and connected appliances, where pressure monitoring enhances user experience and operational control. The widespread adoption of smart living technologies supports long-term growth. Rising disposable incomes and evolving consumer preferences further reinforce demand in this segment.
Increased Use of Pressure Sensors in Critical Healthcare Applications
Medical technology developers are incorporating pressure sensors into a wide array of diagnostic and therapeutic equipment. These include ventilators, infusion pumps, blood pressure monitors, and minimally invasive surgical instruments. The Pressure Sensor Market benefits from the demand for accurate, stable, and miniature sensors that can perform reliably in complex biological environments. It responds to global healthcare expansion, aging populations, and the need for remote patient monitoring systems. Sensor innovation supports improvements in patient safety, treatment precision, and medical device performance. The growing focus on home-based healthcare and wearable medical devices also strengthens market opportunities.
Market Trends:
Growing Adoption of MEMS Technology to Enable Miniaturization and Precision
Micro-Electro-Mechanical Systems (MEMS) technology is transforming the capabilities and design of modern pressure sensors. These compact sensors offer high precision, low power consumption, and the ability to integrate with digital systems. Manufacturers are using MEMS to develop smaller, more efficient sensors suitable for portable electronics, medical implants, and industrial automation. The Pressure Sensor Market is responding to this trend by investing in R&D focused on MEMS-based solutions for both absolute and differential pressure measurements. It supports innovation in compact wearable devices and remote monitoring tools, where sensor miniaturization is a priority. MEMS pressure sensors are becoming the standard in next-generation sensor deployments due to their durability and performance consistency.
Integration of Wireless and IoT Capabilities in Industrial Applications
Industrial users are increasingly deploying wireless pressure sensors to eliminate the limitations of wired systems in remote or hazardous environments. These sensors support real-time data transmission over networks and can be integrated seamlessly into industrial IoT (IIoT) frameworks. The Pressure Sensor Market benefits from this trend by offering IoT-enabled sensors that facilitate predictive maintenance and operational analytics. It enables industries to reduce unplanned downtime and optimize equipment performance. Wireless sensors also reduce installation costs and provide greater flexibility in system design. As digitalization in manufacturing advances, the demand for connected and scalable sensing systems continues to grow.
Rising Demand for Sensors in Sustainable and Clean Energy Systems
Clean energy initiatives are creating new opportunities for pressure sensors in hydrogen fuel systems, wind turbines, and solar inverters. These applications require sensors that can operate reliably under fluctuating environmental conditions and extreme pressures. The Pressure Sensor Market is evolving to meet these demands through the development of high-performance sensors with corrosion resistance and extended lifecycle capabilities. It is seeing growth in applications like hydrogen refueling stations, where pressure monitoring ensures safety and efficiency. Renewable energy providers use sensors to track system performance and optimize energy output. The trend toward sustainable energy solutions directly supports the increasing adoption of advanced pressure sensors.
- For instance, WIKA manufactures custom hydrogen pressure sensors for fuel cell OEMs, with models such as the MH-3-HY designed for forklifts and semi-trucks, offering measurement ranges from 0–500 bar and constructed from 2.4711 (Elgiloy®) alloy for superior hydrogen resistance.
Enhanced Role of Pressure Sensors in Healthcare and Patient Monitoring
Healthcare providers are integrating pressure sensors into a growing number of diagnostic and therapeutic devices. Demand is rising for sensors used in respiratory equipment, infusion therapy systems, and implantable medical devices. The Pressure Sensor Market is advancing sensor designs to meet strict regulatory and performance standards required for clinical use. It supports long-term patient monitoring and helps detect early warning signs of complications through continuous pressure measurement. Remote healthcare solutions rely on these sensors to deliver real-time physiological data to providers. The healthcare sector’s digital transformation continues to elevate the role of pressure sensors in patient care.
- For instance, the NovaSensor NPA Series, for example, provides surface-mountable, miniature pressure sensors for respiratory care, with differential, gauge, and absolute measurement capabilities up to 5 PSI full scale, and digital outputs with 14-bit resolution. These sensors operate across a wide temperature range (-40°C to 125°C) and are used in ventilators, oxygen concentrators, and CPAP devices.
Market Challenges Analysis:
High Cost of Advanced Technologies and Complex Manufacturing Requirements
The integration of advanced technologies such as MEMS, optical sensing, and wireless communication increases both development and manufacturing costs. High-precision pressure sensors require sophisticated materials, cleanroom environments, and rigorous testing to meet performance and safety standards. These factors raise the entry barriers for new players and increase the product cost for end users. The Pressure Sensor Market faces challenges in maintaining profitability while delivering cost-effective solutions across diverse applications. It must balance innovation with price sensitivity, particularly in cost-conscious segments like consumer electronics and automotive. The need for custom designs and sensor calibration across varying environmental conditions further adds to development complexity and extends production timelines.
Performance Limitations in Harsh Environments and Calibration Issues
Pressure sensors deployed in extreme environments—such as high-temperature, corrosive, or high-vibration settings—often face durability and reliability challenges. Ensuring accurate readings over long periods without signal drift or mechanical degradation requires robust design and material choices. The Pressure Sensor Market must address frequent recalibration needs and reduced sensor lifespan in such conditions. It also deals with interoperability issues when integrating with existing industrial systems, especially in legacy infrastructure. Misalignment between sensor output and real-world conditions can lead to data inaccuracies, risking system failure or safety hazards. Meeting diverse application standards across sectors increases the design burden and slows product standardization.
Market Opportunities:
Expansion of Smart Infrastructure and Connected Ecosystems Across Industries
The global shift toward smart cities, intelligent transportation, and connected industrial systems is creating strong demand for pressure sensors. Governments and private sectors are investing in infrastructure that relies on real-time monitoring for safety, efficiency, and sustainability. The Pressure Sensor Market can capitalize on this trend by offering IoT-enabled, energy-efficient sensors tailored to urban mobility, building automation, and water management. It has the potential to grow in applications such as smart grids, HVAC systems, and traffic flow regulation. Integrating pressure sensors with wireless and cloud-based platforms can support advanced data analytics and remote diagnostics. The move toward automation in utilities and public systems expands market entry points for sensor suppliers.
Rising Adoption in Emerging Medical and Environmental Applications
Healthcare digitization and the growth of remote monitoring systems present promising opportunities for pressure sensor manufacturers. Medical wearables, implantable devices, and home care equipment increasingly depend on accurate pressure sensing to deliver personalized and responsive care. The Pressure Sensor Market stands to benefit from increasing investment in telemedicine and preventive healthcare technologies. It can also explore growth in environmental monitoring, where pressure sensors help detect leaks, measure atmospheric conditions, and support disaster response systems. Customized sensor solutions that meet regulatory standards can open new channels in high-growth regions. Demand for compact, low-power, and biocompatible sensors supports long-term expansion in these sectors.
Market Segmentation Analysis:
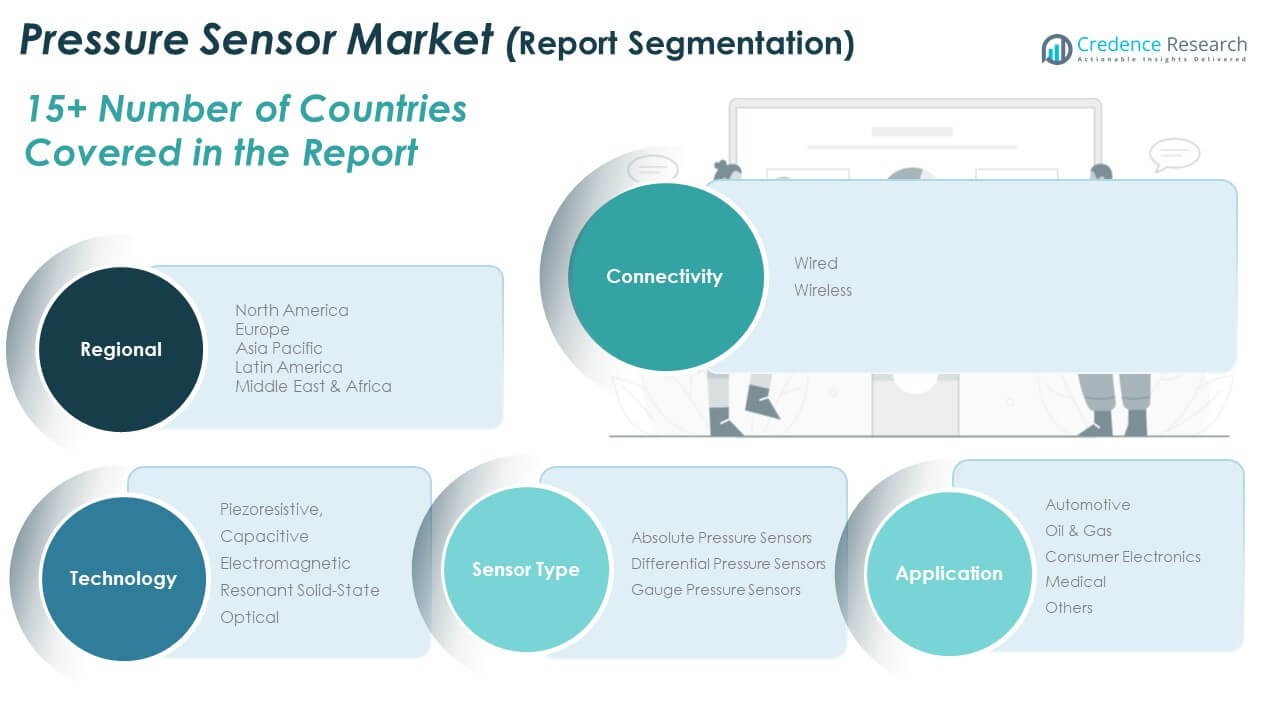
The Pressure Sensor Market is segmented by connectivity, technology, sensor type, and application, reflecting its diverse industrial and commercial use.
By Connectivity:
The Pressure Sensor Market is segmented into wired and wireless connectivity types. Wired sensors currently dominate due to their reliability, accuracy, and stability in harsh and high-vibration industrial environments. They are widely used in oil & gas, automotive, and manufacturing sectors where consistent real-time data transmission is critical. Wireless sensors are gaining momentum, especially in IoT-enabled applications and remote monitoring setups. Their ease of installation, scalability, and compatibility with smart systems make them increasingly preferred in building automation, smart cities, and healthcare.
- For instance, on the wireless front, NCD’s Industrial IoT Wireless Environmental Sensor exemplifies the shift: it uses a 900 MHz wireless mesh network, offers a range of up to 2 miles, and provides a battery life of up to 3 years, making it ideal for remote monitoring and IoT-enabled applications.
By Technology:
The market is divided into piezoresistive, capacitive, electromagnetic, resonant solid-state, and optical pressure sensors. Piezoresistive and capacitive technologies lead in adoption due to their cost efficiency, high sensitivity, and wide applicability. Electromagnetic sensors are used in high-temperature or corrosive environments. Resonant solid-state and optical technologies serve precision-driven applications in medical, aerospace, and laboratory settings, where compact size and stable output are essential.
By Sensor Type:
Pressure sensors are categorized into absolute, differential, and gauge types. Absolute pressure sensors measure pressure relative to a vacuum and are commonly used in automotive engines and industrial control systems. Differential pressure sensors monitor pressure differences in systems such as filters and ventilation, making them ideal for HVAC and cleanroom applications. Gauge pressure sensors measure pressure relative to atmospheric pressure and are widely applied in hydraulic and pneumatic systems.
By Application:
The Pressure Sensor Market serves multiple industries, with automotive leading due to rising demand for emission control, safety features, and electric vehicle systems. Oil & gas relies on sensors for pipeline monitoring and drilling operations. Consumer electronics use compact sensors in smartphones and wearables. Medical applications include infusion pumps, respiratory devices, and minimally invasive equipment. Other sectors like aerospace, agriculture, and manufacturing utilize sensors to ensure safety and efficiency in automated processes.
- For example, NovaSensor NPA Series being used in ventilators, oxygen concentrators, and CPAP devices.
Segmentation:
By Connectivity:
By Technology:
- Piezoresistive
- Capacitive
- Electromagnetic
- Resonant Solid-State
- Optical
By Sensor Type:
- Absolute Pressure Sensors
- Differential Pressure Sensors
- Gauge Pressure Sensors
By Application:
- Automotive
- Oil & Gas
- Consumer Electronics
- Medical
- Others
By Region:
- North America
- Europe
- UK
- France
- Germany
- Italy
- Spain
- Russia
- Rest of Europe
- Asia Pacific
- China
- Japan
- South Korea
- India
- Australia
- Southeast Asia
- Rest of Asia Pacific
- Latin America
- Brazil
- Argentina
- Rest of Latin America
- Middle East
- GCC Countries
- Israel
- Turkey
- Rest of Middle East
- Africa
- South Africa
- Egypt
- Rest of Africa
Regional Analysis:
The North America Pressure Sensor Market size was valued at USD 1,807.43 million in 2018 to USD 2,798.87 million in 2024 and is anticipated to reach USD 4,768.08 million by 2032, at a CAGR of 6.90% during the forecast period. North America holds a significant share in the global Pressure Sensor Market, driven by a mature industrial ecosystem and rapid adoption of advanced sensor technologies. The region accounts for approximately 19.3% of the total market in 2024. It benefits from strong demand across automotive, aerospace, medical devices, and smart infrastructure segments. The presence of key manufacturers and early adoption of MEMS-based sensors supports continued growth. Investment in industrial IoT and automation further accelerates sensor integration across applications. North America remains a leader in innovation, contributing to the high revenue share and stable CAGR in the global market.
The Europe Pressure Sensor Market size was valued at USD 2,436.57 million in 2018 to USD 3,506.04 million in 2024 and is anticipated to reach USD 5,418.27 million by 2032, at a CAGR of 5.60% during the forecast period. Europe contributes nearly 24.2% of the global Pressure Sensor Market in 2024, supported by its strong automotive, manufacturing, and healthcare sectors. It maintains steady growth through innovation and adherence to environmental and safety regulations that mandate pressure monitoring systems. Germany, France, and the UK lead in deployment due to their focus on precision engineering and smart mobility solutions. The transition to electric vehicles and automation in industrial systems expands opportunities. It also gains traction in medical technology, especially for wearable and diagnostic devices. Europe’s regulatory structure and emphasis on quality standards make it a stable and reliable market for sensor deployment.
The Asia Pacific Pressure Sensor Market size was valued at USD 3,543.86 million in 2018 to USD 5,307.99 million in 2024 and is anticipated to reach USD 8,669.24 million by 2032, at a CAGR of 6.30% during the forecast period. Asia Pacific dominates the global Pressure Sensor Market with a 36.6% share in 2024, led by China, Japan, India, and South Korea. Rapid industrialization, high-volume consumer electronics production, and expanding automotive manufacturing drive regional demand. Governments in the region are investing heavily in smart city infrastructure, electric mobility, and healthcare modernization. It shows strong adoption of MEMS-based pressure sensors across portable devices and industrial machinery. India, in particular, is emerging as a high-growth market with increasing domestic production and export potential. Asia Pacific continues to offer the highest volume opportunity, driven by both manufacturing scale and local market expansion.
The Latin America Pressure Sensor Market size was valued at USD 390.97 million in 2018 to USD 594.60 million in 2024 and is anticipated to reach USD 990.46 million by 2032, at a CAGR of 6.60% during the forecast period. Latin America represents a growing but smaller share in the global Pressure Sensor Market, accounting for 4.1% in 2024. Brazil and Mexico lead the adoption, driven by automotive assembly, oil and gas industries, and increasing healthcare investments. It is witnessing gradual digitization across utilities and manufacturing sectors, fueling pressure sensor demand. Infrastructure upgrades and automation initiatives are helping expand sensor applications in public transport and energy sectors. Government-backed smart infrastructure projects support further deployment. Latin America offers moderate but steady growth potential as digital transformation accelerates across the region.
The Middle East Pressure Sensor Market size was valued at USD 550.05 million in 2018 to USD 824.52 million in 2024 and is anticipated to reach USD 1,348.07 million by 2032, at a CAGR of 6.30% during the forecast period. The Middle East holds approximately 5.7% of the global Pressure Sensor Market in 2024, with demand largely concentrated in the oil and gas, industrial automation, and utility sectors. Countries like the UAE and Saudi Arabia are investing in high-end infrastructure and smart energy systems. It supports pressure sensor adoption in HVAC, process control, and energy management systems. Growth is further driven by the expansion of healthcare and defense sectors. The region’s focus on energy diversification and sustainability creates new opportunities for advanced sensing technologies. The Middle East continues to develop its industrial base, contributing to a rising regional market share.
The Africa Pressure Sensor Market size was valued at USD 258.85 million in 2018 to USD 346.90 million in 2024 and is anticipated to reach USD 478.98 million by 2032, at a CAGR of 4.10% during the forecast period. Africa accounts for just 2.4% of the global Pressure Sensor Market in 2024 but holds long-term growth potential. Infrastructure development, increasing electrification, and urban expansion are opening new applications for pressure sensors in utilities and transportation. It is also witnessing growth in healthcare access and telecommunications, where sensors support medical equipment and smart devices. Adoption remains limited by cost and infrastructure gaps but shows promise in high-need sectors. International partnerships and funding for digital transformation are slowly improving access to advanced sensor technologies. Africa remains a nascent but emerging market in the global pressure sensor landscape.
Key Player Analysis:
- AlphaSense
- Process Sensing Technologies (PST) Group
- Figaro Engineering Inc.
- Honeywell International, Inc.
- ABB
- Emerson Electric Co.
- Amphenol Corporation
- TE Connectivity
- Robert Bosch GmbH
- GfG Europe Ltd.
- Other Key Players
Competitive Analysis:
The Pressure Sensor Market features intense competition with key players focusing on innovation, precision, and application-specific product development. Leading companies such as Bosch Sensortec, Honeywell International Inc., TE Connectivity, STMicroelectronics, and Infineon Technologies AG dominate global revenue through their broad product portfolios and advanced MEMS capabilities. The market sees frequent investments in R&D to enhance sensor sensitivity, miniaturization, and energy efficiency. It encourages strategic collaborations, acquisitions, and geographic expansion to strengthen distribution networks and customer reach. Emerging players target niche applications in healthcare, automotive safety, and industrial automation to establish market presence. The Pressure Sensor Market remains highly dynamic, with companies aiming to align product offerings with evolving technological standards and regulatory requirements. Competitive advantage often depends on the ability to deliver high-performance sensors at scalable costs while maintaining quality and compliance. The ongoing integration of sensors into smart systems reinforces the need for reliable, durable, and connected pressure sensing solutions.
Recent Developments:
- In June 2025, AlphaSense launched “Deep Research,” a new AI agent designed to automate complex research tasks for business and financial professionals. This tool leverages AlphaSense’s extensive content database, enabling users to generate comprehensive research outputs and synthesize insights rapidly, functioning like a team of highly skilled analysts operating at superhuman speed.
- In Nov 2024, DwyerOmega acquired Process Sensing Technologies, further expanding PST’s reach and product offerings in measurement instrumentation and monitoring solutions for process-critical applications. This acquisition combines PST’s technologies with DwyerOmega’s portfolio to deliver a wider range of precision measurement solutions to customers globally.
Market Concentration & Characteristics:
The Pressure Sensor Market exhibits moderate to high market concentration, with a few global players accounting for a substantial share of total revenue. It is characterized by continuous innovation, high entry barriers, and strong dependence on technological expertise and manufacturing capabilities. Leading companies maintain dominance through economies of scale, proprietary designs, and established distribution channels. The market features a mix of standardized products and customized solutions tailored to specific industries such as automotive, industrial automation, and healthcare. It demands strict compliance with regulatory standards, especially in safety-critical and medical applications. Long product life cycles, reliability requirements, and integration with digital systems define purchasing decisions. The Pressure Sensor Market favors companies that can deliver precision, scalability, and adaptability across diverse end-use sectors.
Shape Your Report to Specific Countries or Regions & Enjoy 30% Off!
Report Coverage:
The research report offers an in-depth analysis based on connectivity, technology, sensor type, and application. It details leading market players, providing an overview of their business, product offerings, investments, revenue streams, and key applications. Additionally, the report includes insights into the competitive environment, SWOT analysis, current market trends, as well as the primary drivers and constraints. Furthermore, it discusses various factors that have driven market expansion in recent years. The report also explores market dynamics, regulatory scenarios, and technological advancements that are shaping the industry. It assesses the impact of external factors and global economic changes on market growth. Lastly, it provides strategic recommendations for new entrants and established companies to navigate the complexities of the market.
Future Outlook:
- Growing demand for pressure sensors in electric and autonomous vehicles will drive long-term automotive market expansion.
- Advancements in MEMS technology will support miniaturization and improved sensor performance across industries.
- Increasing integration with IoT platforms will enhance remote monitoring and predictive maintenance applications.
- Expansion of smart cities and infrastructure projects will boost sensor deployment in utilities and urban systems.
- Rising adoption in home healthcare and wearable medical devices will accelerate growth in the healthcare segment.
- Greater use of wireless pressure sensors in hazardous and remote industrial environments will improve operational safety.
- Demand for high-performance sensors in hydrogen and renewable energy systems will open new application areas.
- Technological innovations will reduce costs, enabling deeper penetration into consumer electronics and mid-tier markets.
- Asia Pacific will maintain regional leadership, supported by manufacturing capacity and policy-driven growth.
- Strategic partnerships and R&D investment will remain critical for differentiation in a highly competitive market.


