Africa 3D and 4D Technology Market: USD 3.25 billion in 2025, Led by South Africa and Rising in North and West Africa
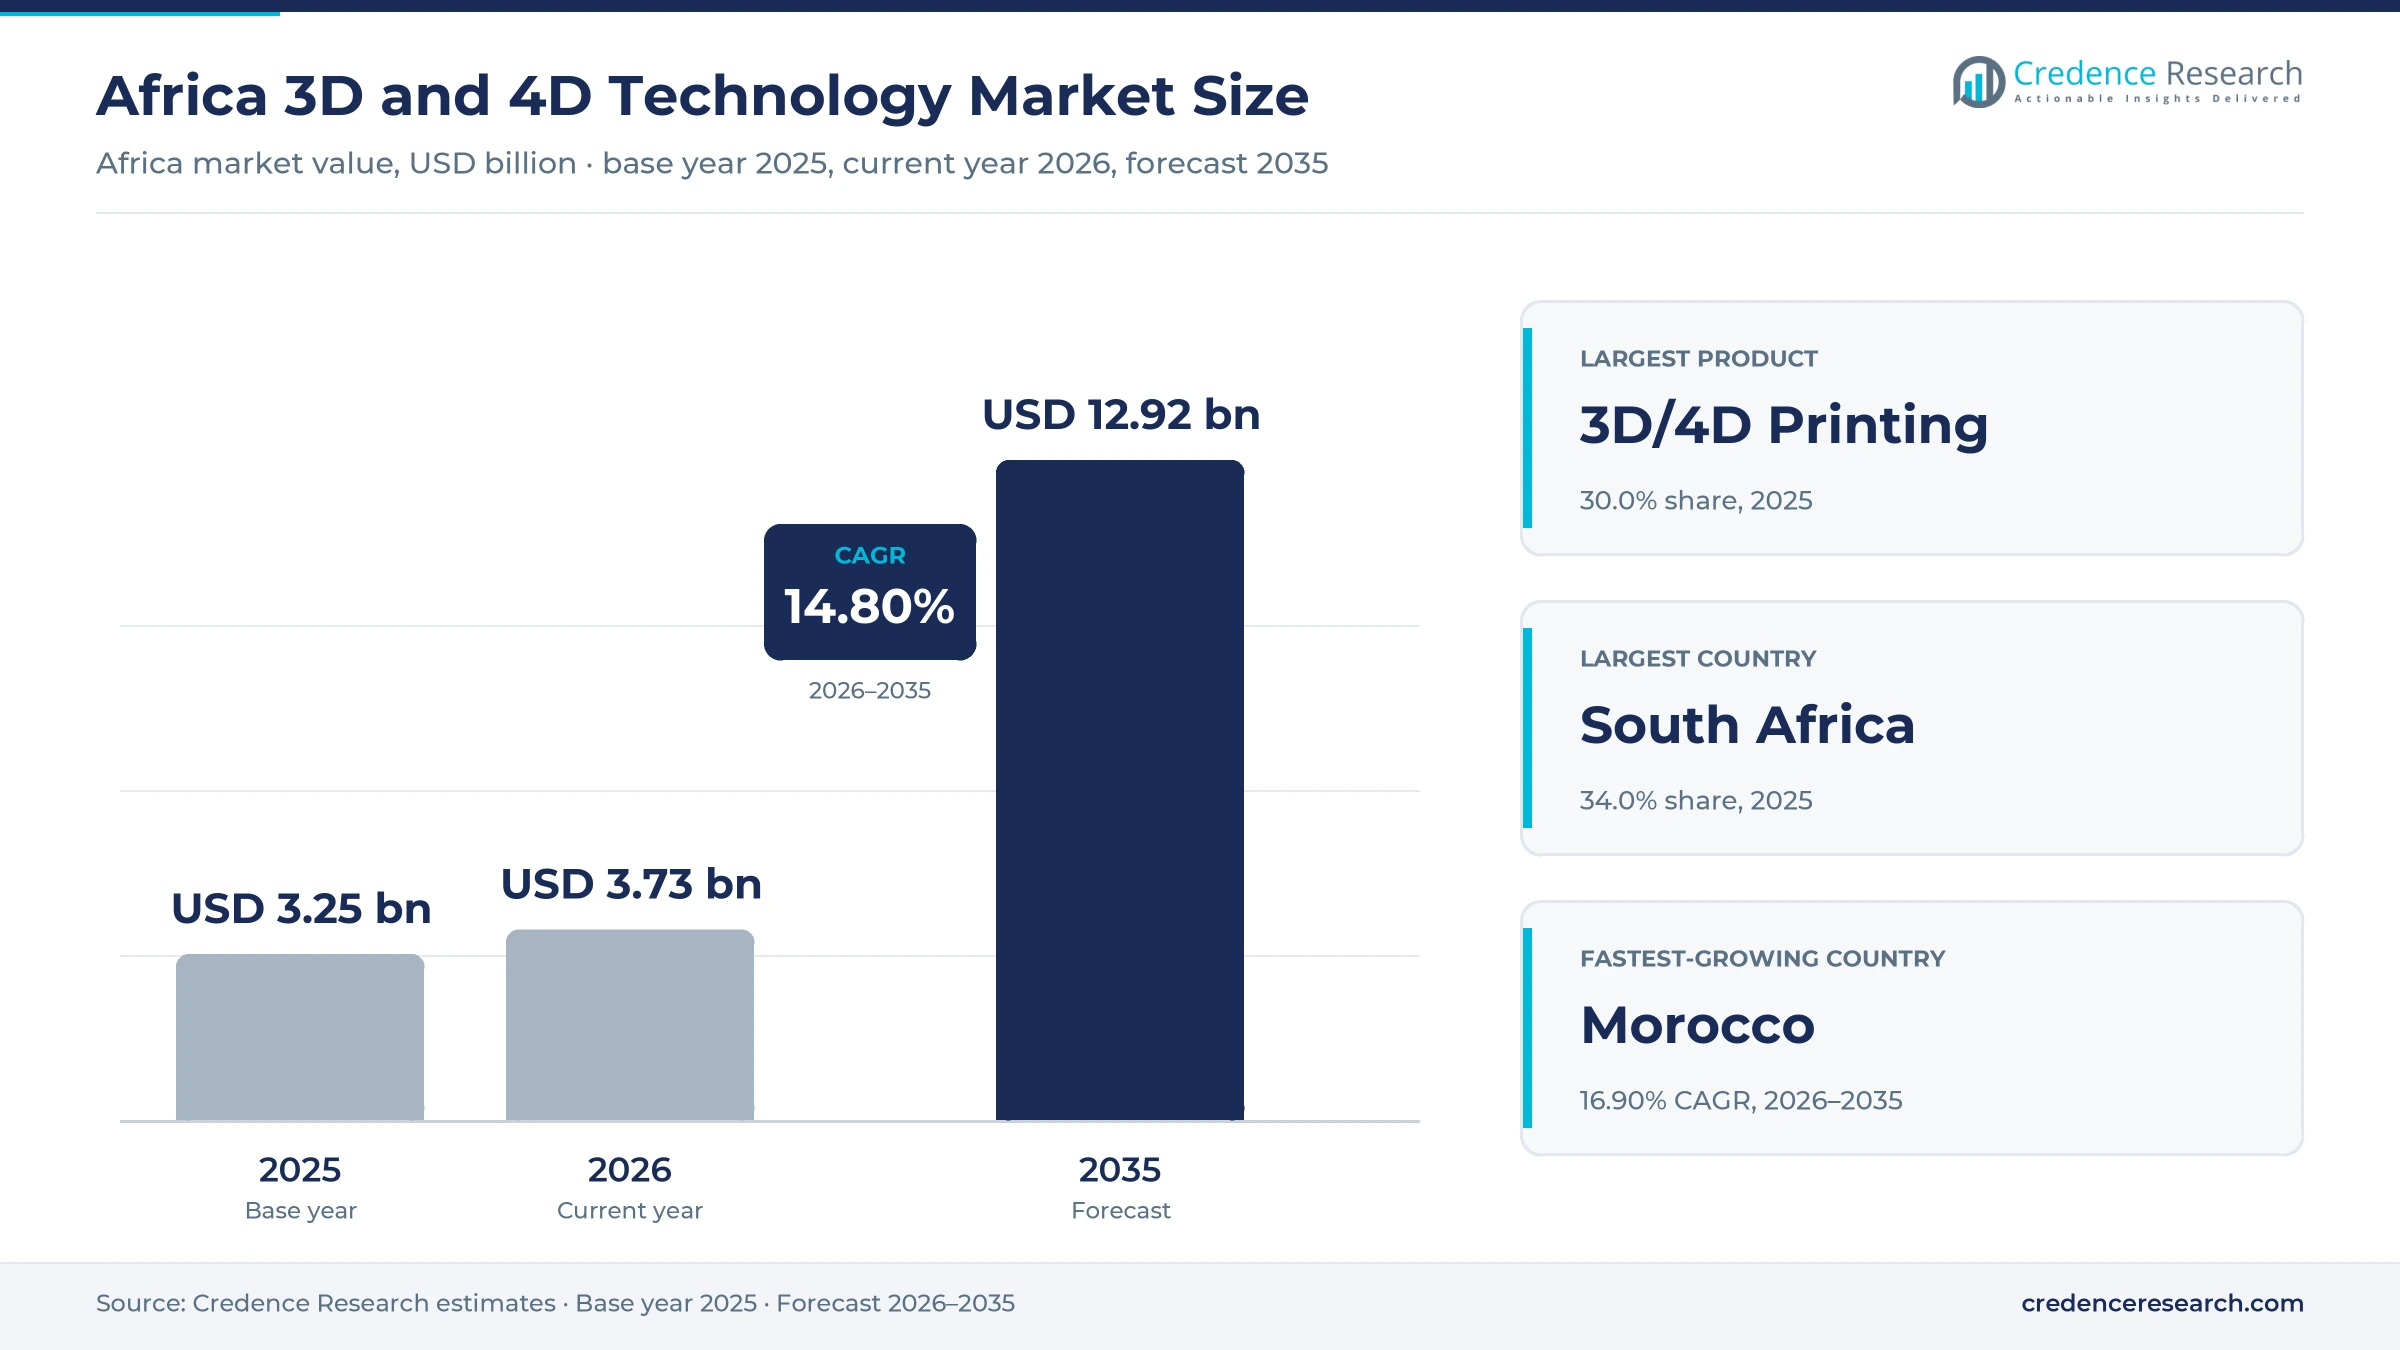
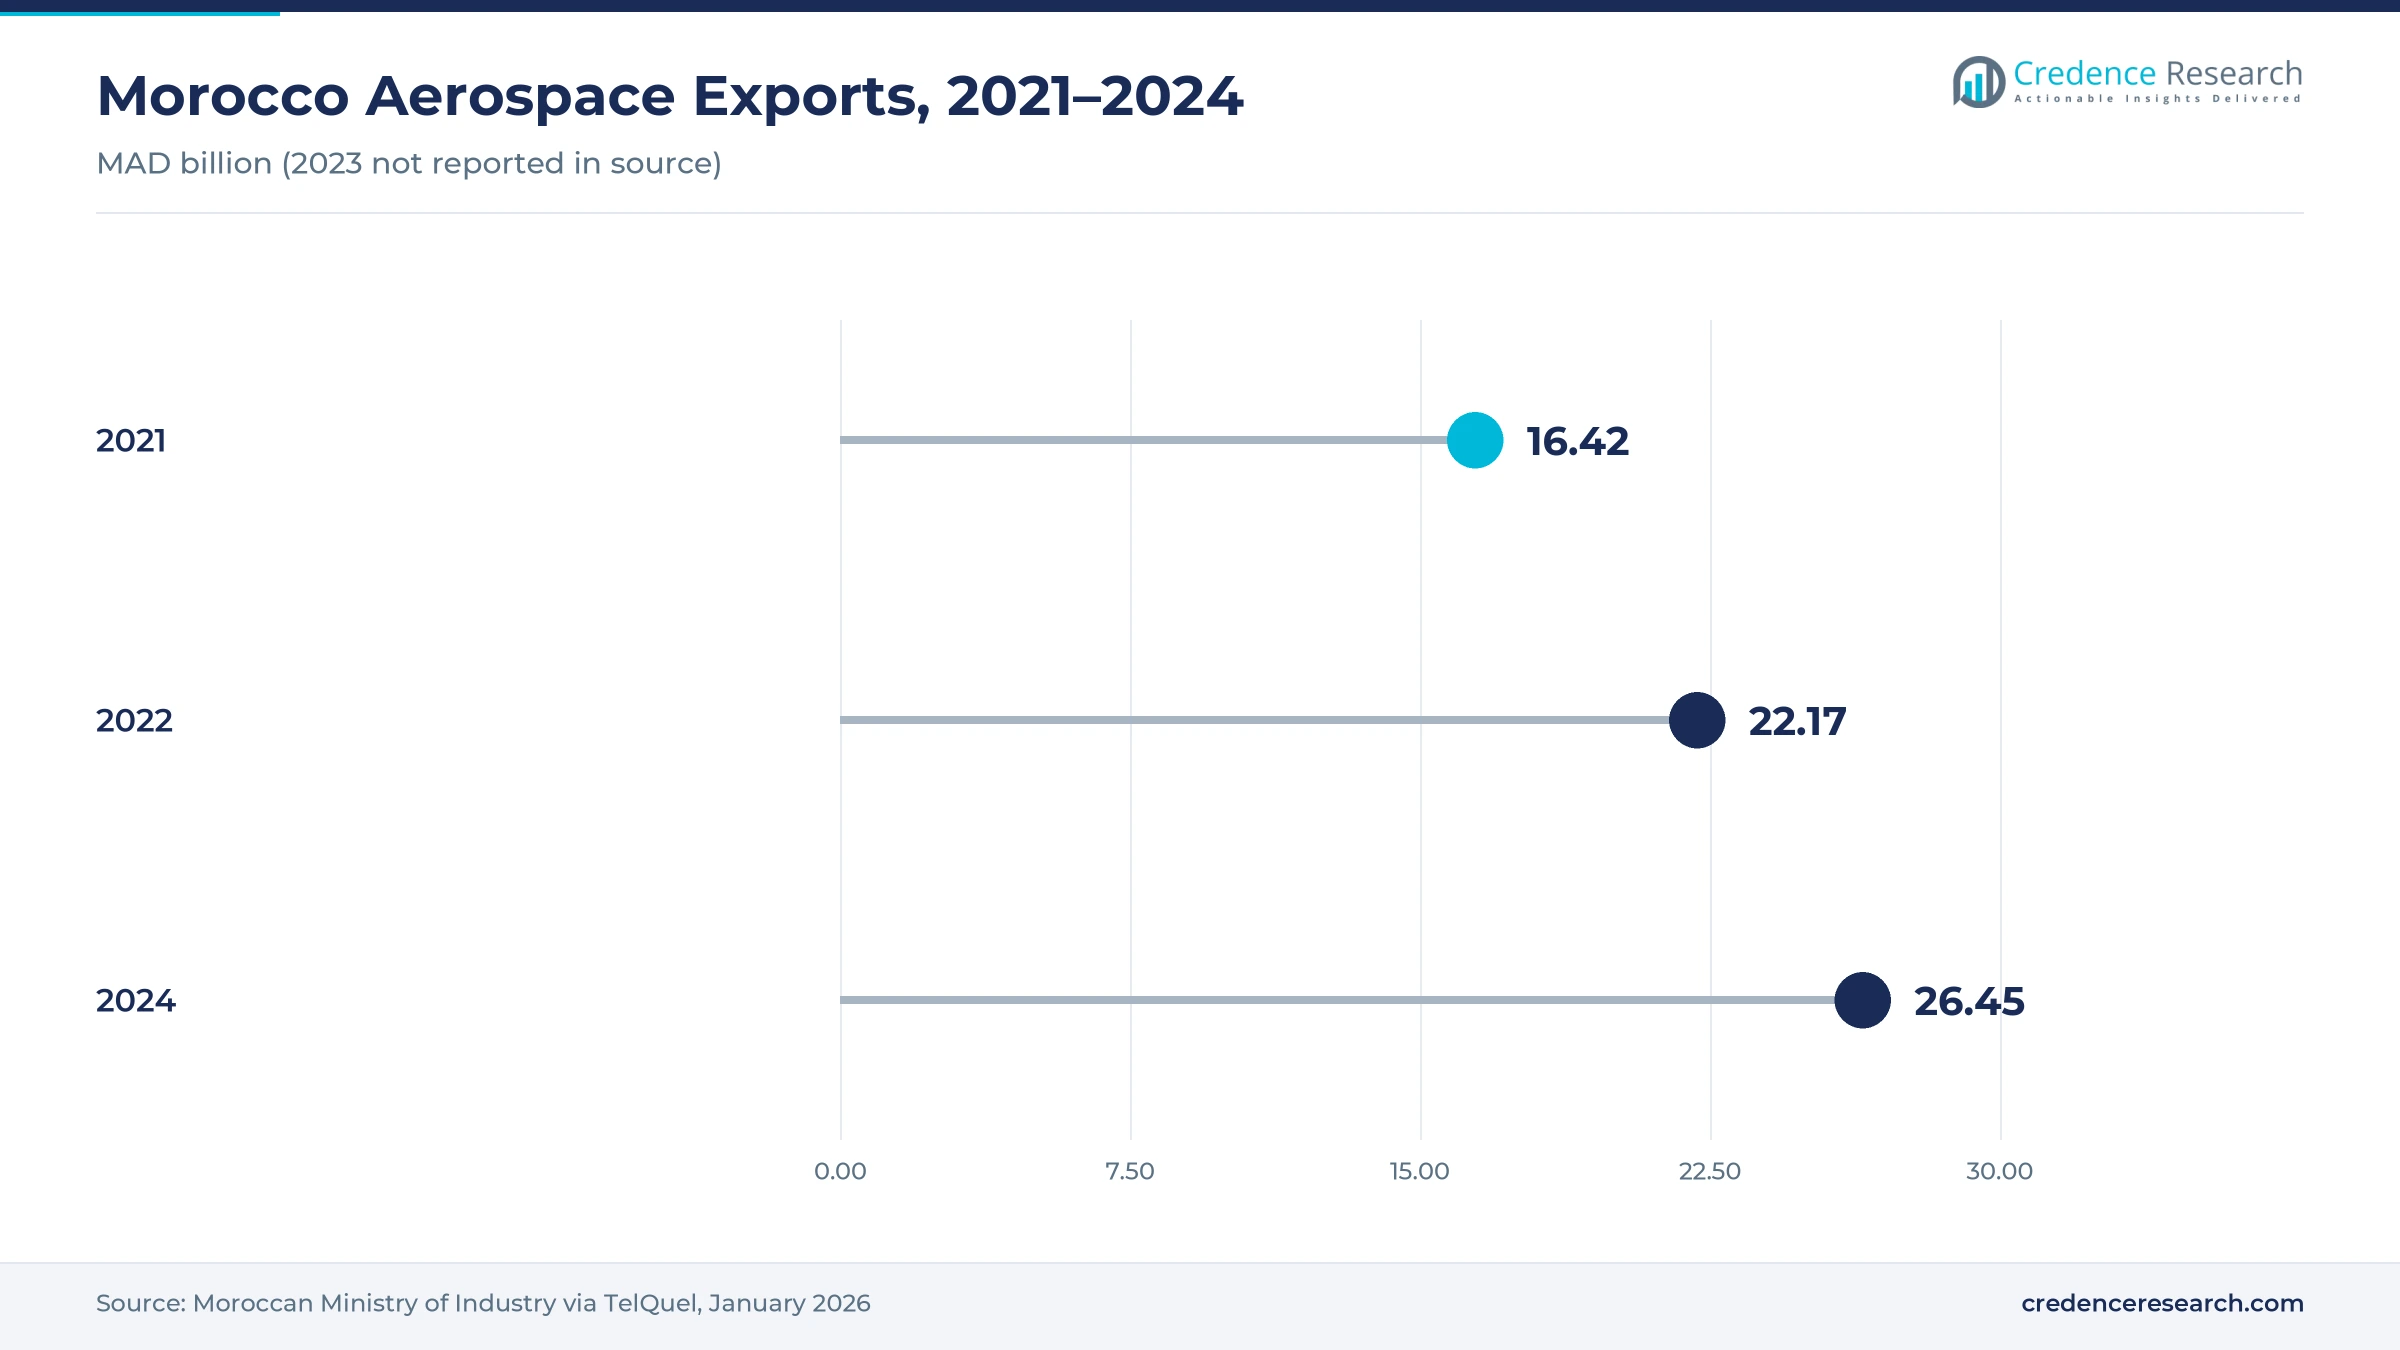
Morocco exported MAD 26.45 billion of aerospace products in 2024, one sign of the industrial demand behind Africa's 3D and 4D technology market, valued at USD 3.25 billion in 2025. Credence Research forecasts USD 12.92 billion by 2035, a 14.80% CAGR over 2026–2035, with 2026 estimated at USD 3.73 billion. Printing, scanning and immersive display tools are spreading from universities and research centers into factories, hospitals and building sites.
Africa is mainly a buyer rather than a maker of printers, cameras and displays, so most equipment arrives through resellers. Local value comes from services, design, construction printing and medical devices made close to patients.
What does the market cover?
The market covers 3D and 4D printing, 3D displays, 3D cameras and sensors, and other visualization systems sold in Africa. The scope includes:
- Printers, materials, software and services, including shape-changing smart materials used in 4D printing.
- 3D imaging and scanning, 3D displays and time-varying 4D modeling for digital twins, building information models and media.
- Prototyping, manufacturing, medical modeling, inspection and animation uses by enterprises, service bureaus, hospitals, universities and governments.
The scope excludes 2D printing, ordinary photography and security cameras, and cinema projection not sold as 3D systems. Values are in USD billion at current prices, allocated to the country of the buyer. Visualization equipment worldwide is covered in the advanced 3D and 4D visualization systems market.
How was the estimate built?
All figures are Credence Research estimates, built from equipment imports, installed printers at universities and firms, display and camera sales, construction and medical printing projects and reseller information.
What does 4D mean here?
4D covers printed objects that change shape or function over time and 3D models that change over time, such as building schedules. No African agency publishes separate 4D statistics, so it is treated as a niche within printing and visualization. Printing terms follow ISO/ASTM 52900:2021, the additive manufacturing vocabulary standard confirmed in 2025, according to ISO.
Report Attributes
| Attribute | Details |
|---|---|
| Historical Period | 2018–2024 |
| Base Year | 2025 |
| Forecast Period | 2026–2035 |
| Market Size 2025 | USD 3.25 billion |
| Market Size 2026 (estimate) | USD 3.73 billion |
| Market Size 2035 (forecast) | USD 12.92 billion |
| CAGR (2026–2035) | 14.80% |
| Segments Covered | By Product, By End User, By Printing Material, By Technology, By Application, By Customer Type |
| Countries Covered | South Africa, Egypt, Nigeria, Morocco, Kenya, Rest of Africa |
| Companies Covered | 3D Systems Corporation, Autodesk, Inc., Dassault Systèmes SE, Dolby Laboratories, Inc., Panasonic Holdings Corporation, Materialise NV, Hexagon AB, Basler AG, Samsung Electronics Co., Ltd., Stratasys Ltd. |
Africa 3D 4D Technology Market Insights
- The Africa 3D and 4D technology market was worth USD 3.25 billion in 2025 and is forecast to reach USD 12.92 billion by 2035, a 14.80% CAGR over 2026–2035.
- Credence Research estimates the market at USD 3.73 billion in 2026, the current year.
- Digital manufacturing and additive production is the strongest driver, adding about 4.0 percentage points to the forecast CAGR.
- 3D and 4D printing leads products with 30.0% and grows fastest at 16.85%.
- South Africa holds 34.0% of value; Morocco grows fastest at 16.90%.
- Medical modeling is the fastest-growing application at 17.34% a year.
Printing Equipment for Enterprises Holds the Largest Share
Which product and technology lead?
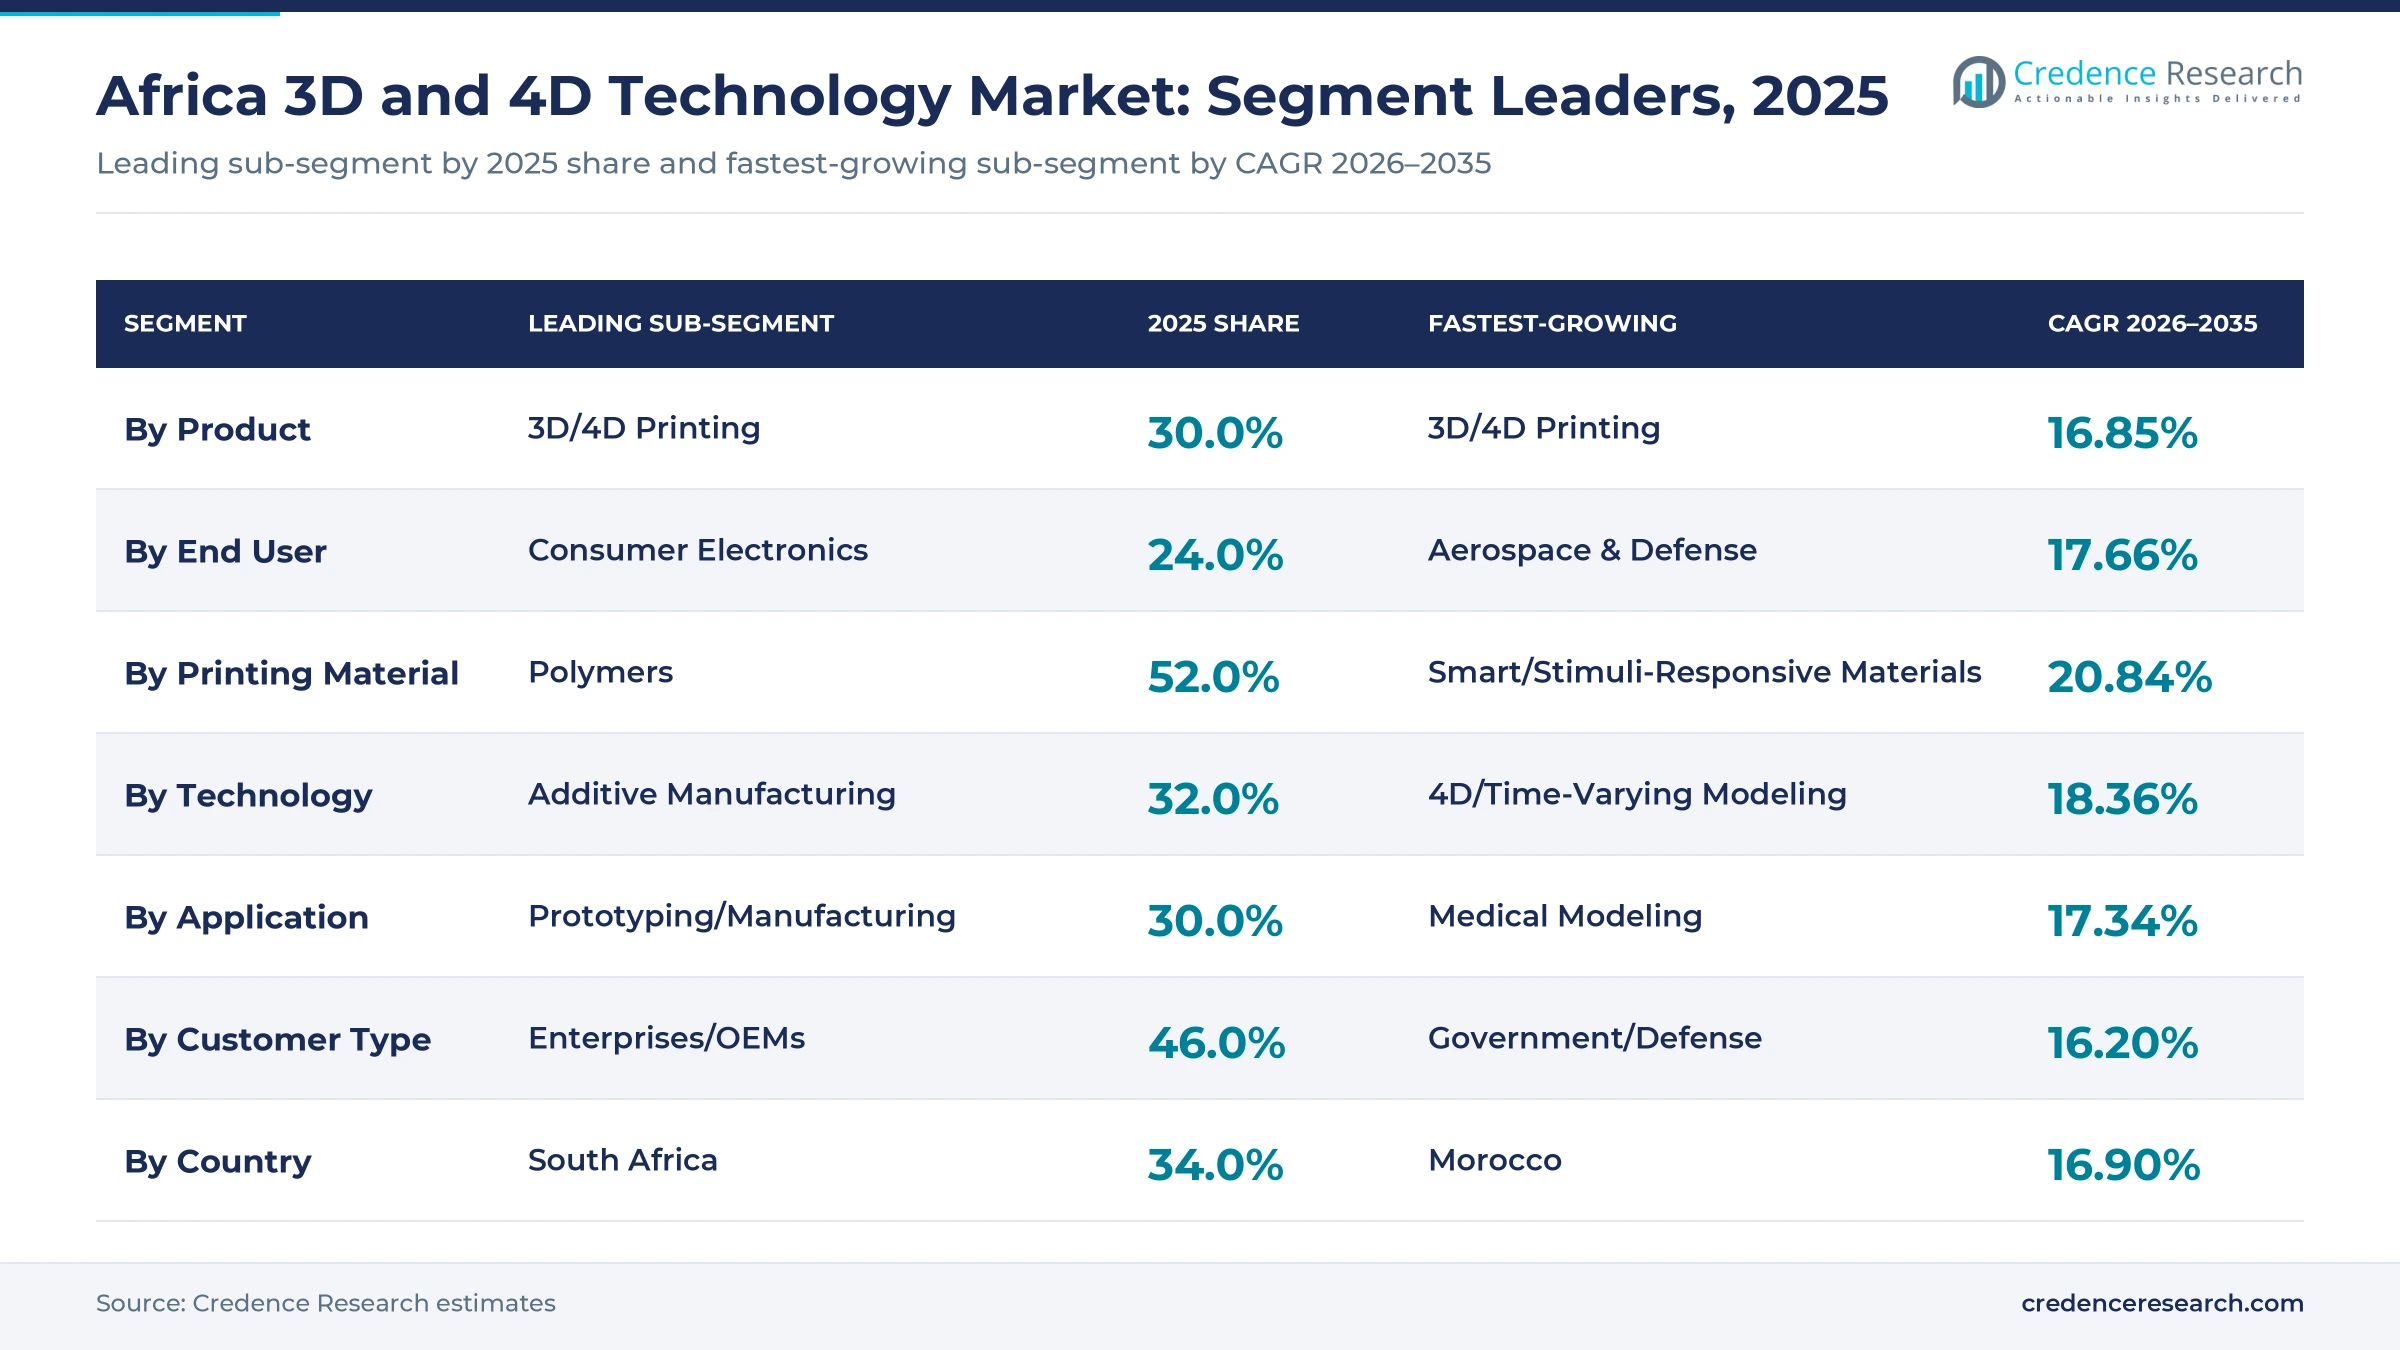
3D and 4D printing leads products with a 30.0% share in 2025 and grows fastest at 16.85%. Displays follow, mainly 3D-capable televisions and professional screens. Additive manufacturing leads technologies with 32.0%, while 4D and time-varying modeling grows fastest at 18.36%.
Which end user leads?
Consumer electronics leads end users with 24.0%, followed by automotive and construction. Aerospace and defense grows fastest at 17.66%.
Which printing material leads?
Polymers lead with 52.0% because most printers in Africa use plastic filament or resin. Smart and stimuli-responsive materials grow fastest at 20.84%.
Which application and customer type lead?
Prototyping and manufacturing leads applications with 30.0%, and medical modeling grows fastest at 17.34%. Enterprises and OEMs lead customers with 46.0%, while government and defense grows fastest at 16.20%. Global printing demand is tracked in the 3D printing market.
| Segment Group | Leading Sub-segment | 2025 Share | Fastest-growing Sub-segment | CAGR 2026–2035 |
|---|---|---|---|---|
| By Product | 3D/4D Printing | 30.0% | 3D/4D Printing | 16.85% |
| By End User | Consumer Electronics | 24.0% | Aerospace & Defense | 17.66% |
| By Printing Material | Polymers | 52.0% | Smart/Stimuli-Responsive Materials | 20.84% |
| By Technology | Additive Manufacturing | 32.0% | 4D/Time-Varying Modeling | 18.36% |
| By Application | Prototyping/Manufacturing | 30.0% | Medical Modeling | 17.34% |
| By Customer Type | Enterprises/OEMs | 46.0% | Government/Defense | 16.20% |
Request a Free Sample
Fill in your details and we'll send you a free sample report.
- Sample data tables & charts
- Research methodology
Industrial Printing, Medical Imaging and Construction Visualization Drive Demand
Why does digital manufacturing matter most? (~+4.0% impact on forecast CAGR)
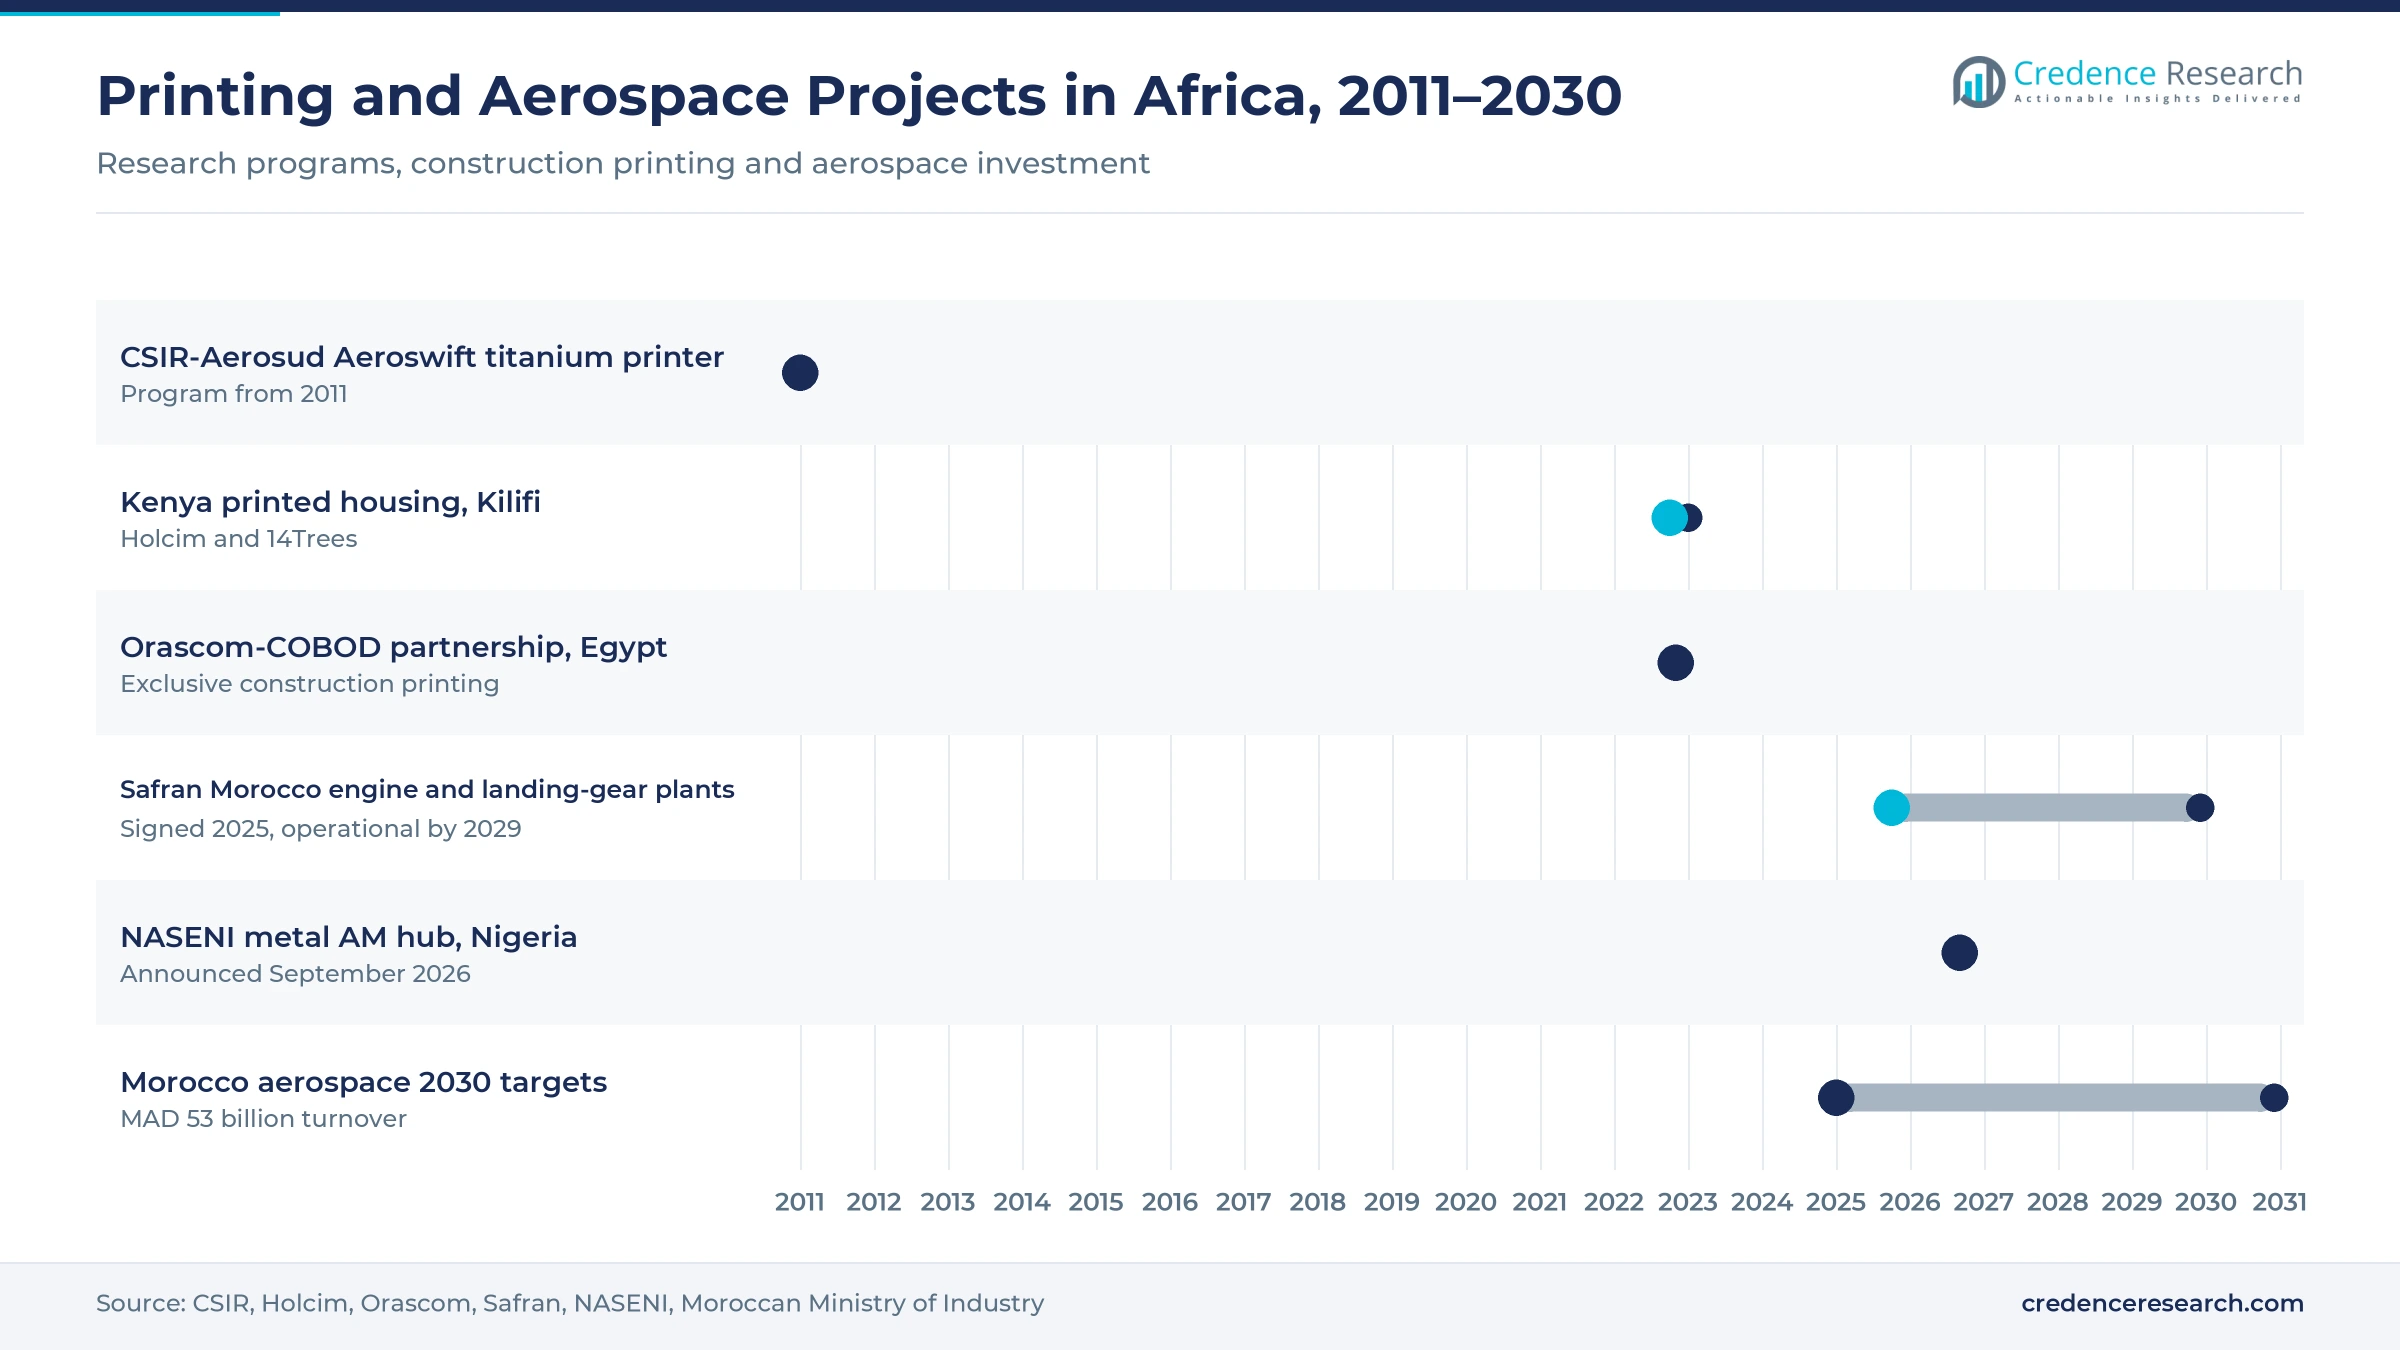
Adoption of digital manufacturing and additive production across African industry is the strongest driver, adding about 4.0 percentage points to the forecast CAGR. Morocco's aerospace exports rose to MAD 26.45 billion in 2024 from MAD 16.42 billion in 2021, according to Ministry of Industry figures reported by TelQuel, and Safran signed in October 2025 for a LEAP engine assembly line near Casablanca. Nigeria's NASENI announced plans in September 2026 for the country's first metal additive manufacturing hub to cut reliance on imported parts. In South Africa, the government-backed Collaborative Programme in Additive Manufacturing opened a fourth call for industry projects in 2026, hosted by the CSIR. 3D and 4D printing leads products with a 30.0% share and grows fastest at 16.85% a year.
How do healthcare and imaging add demand? (~+3.1% impact on forecast CAGR)
Growing healthcare, metrology and industrial 3D imaging uses add about 3.1 percentage points to the forecast CAGR. In Nigeria, a UNIDO program funded by Japan supplied 3D scanners and printers for prosthetics; about 700 amputees applied within two weeks, and the government announced a federal training center in October 2026, as reported by the News Agency of Nigeria. Hexagon expanded its African distribution network to 24 partners for 3D scanning and inspection. Medical modeling is the fastest-growing application at 17.34% a year. Hospitals value printed sockets and surgical models because they can be made close to patients instead of being imported, which shortens waiting times for rehabilitation.
What role do architecture and media play? (~+2.4% impact on forecast CAGR)
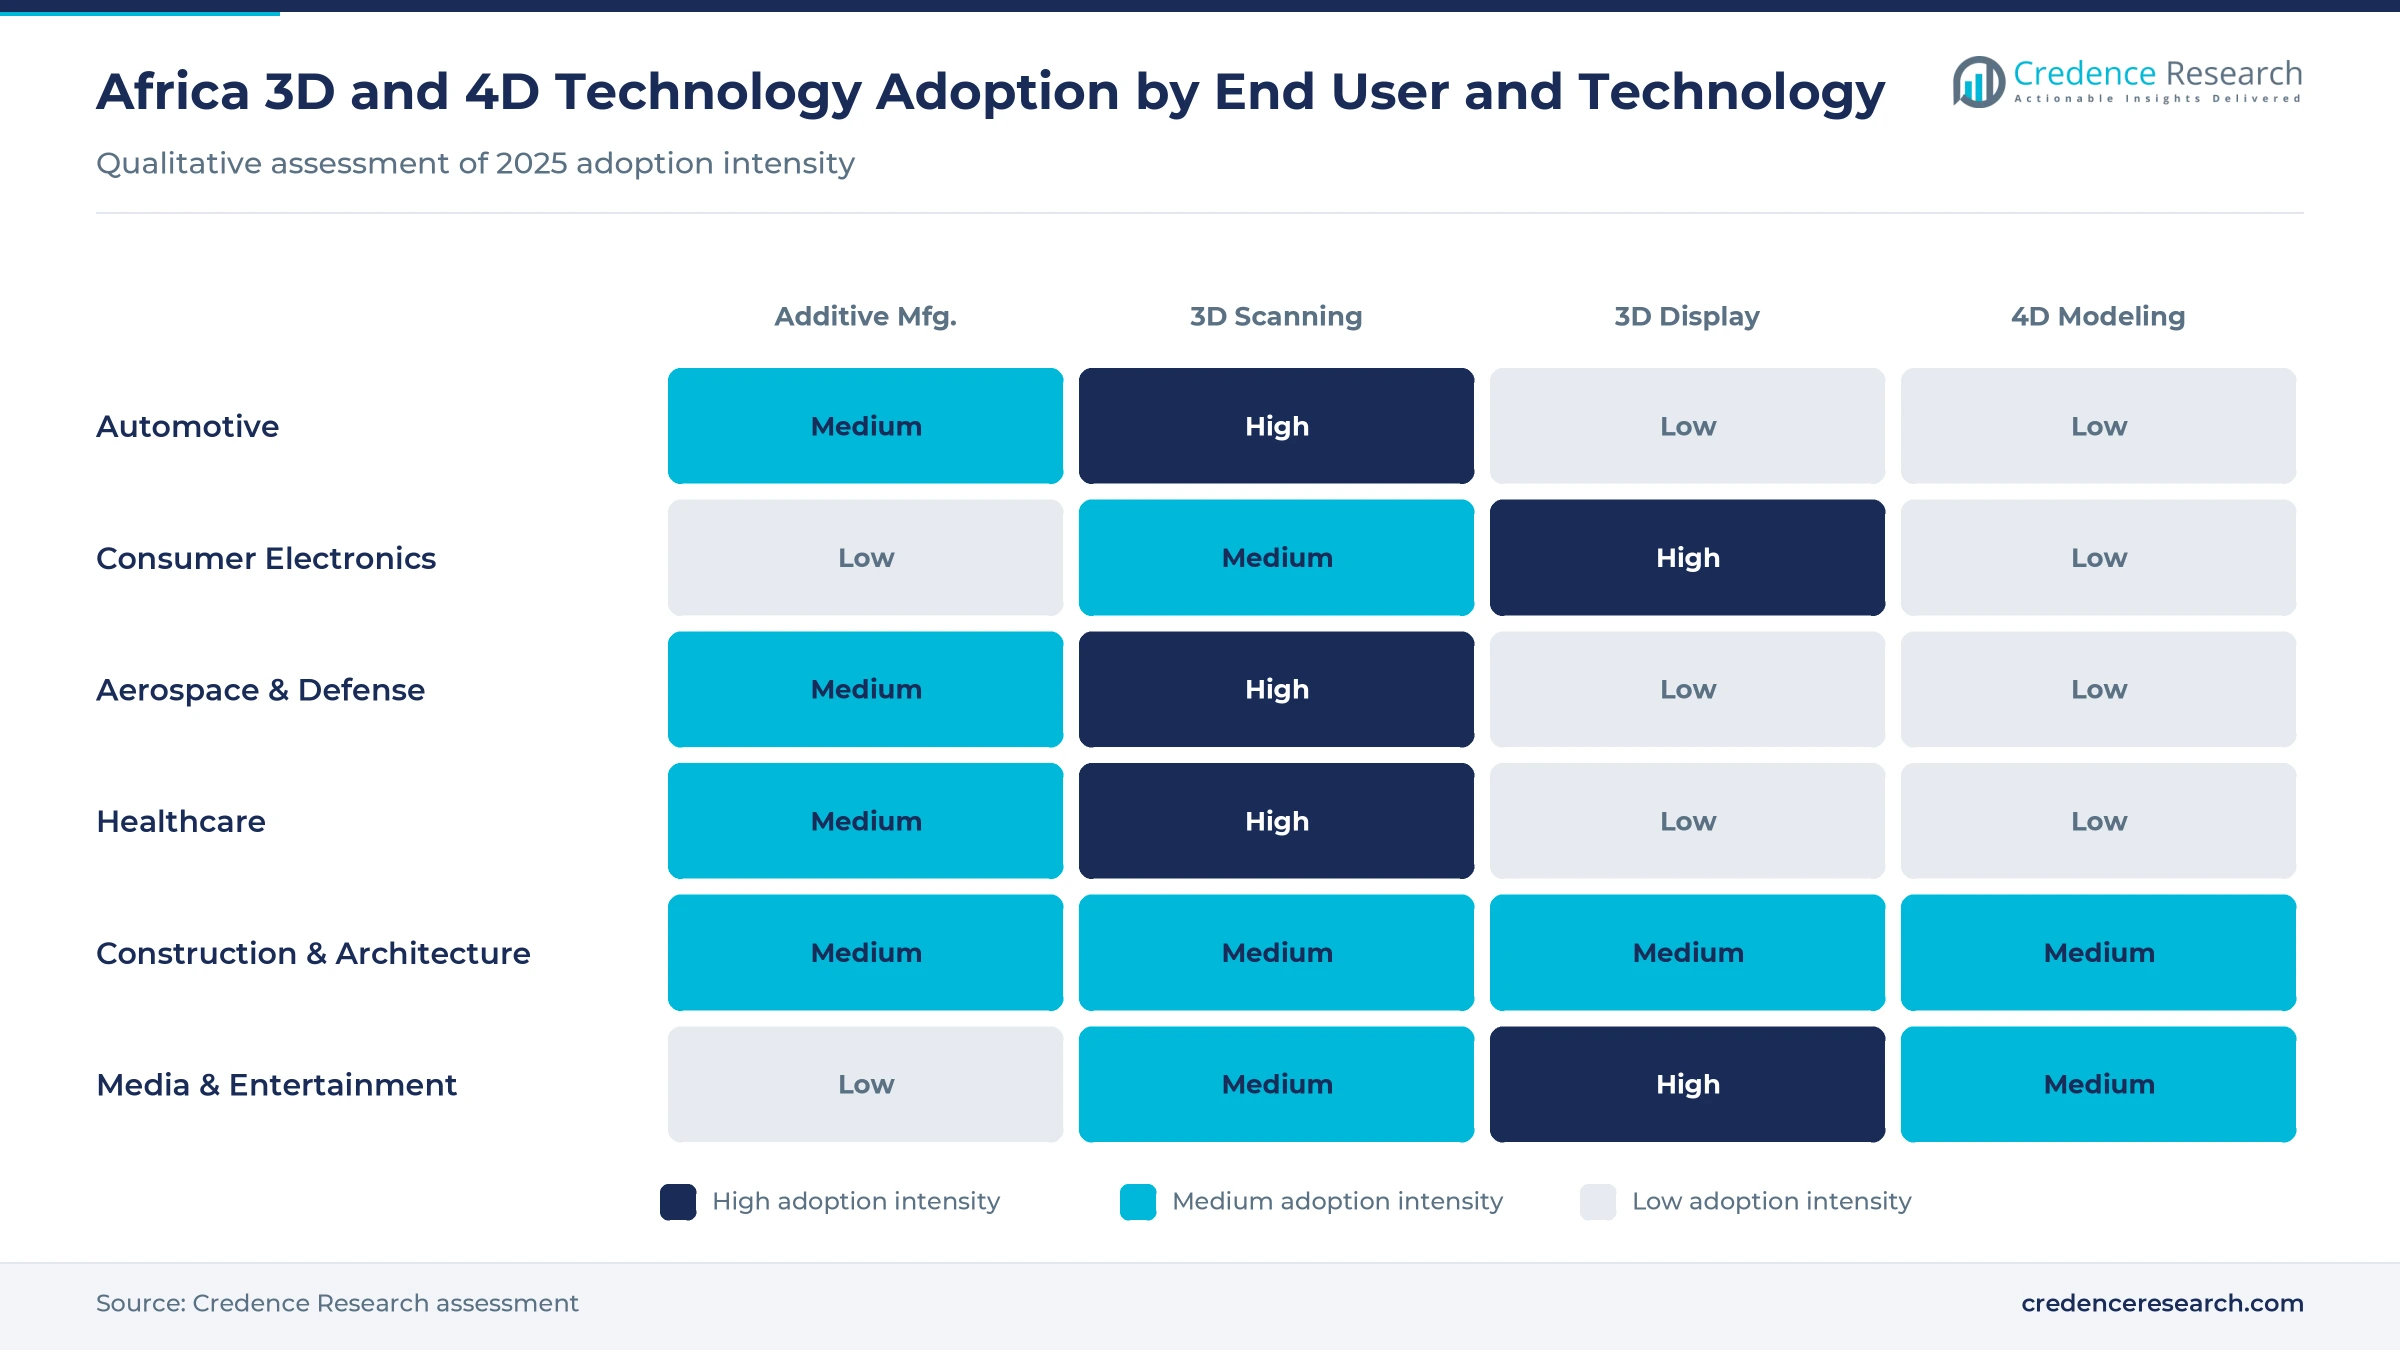
Expansion of architecture, media and immersive visualization uses adds about 2.4 percentage points to the forecast CAGR. Holcim and 14Trees printed 52 homes at Mvule Gardens in Kilifi, Kenya, with a COBOD construction printer, aiming for lower build costs, as described by Holcim. Orascom Construction holds an exclusive COBOD partnership for Egypt. Architects and contractors also use 3D scanning and time-based 4D building models to plan large projects. Construction and architecture is among the faster-growing end users, and aerospace and defense grows fastest at 17.66% a year.
Construction Printing, Donor-Funded Medical Devices and Aerospace Clusters
Trend 1: Is printed housing spreading?
Yes. Housing shortages in Kenya, Egypt and other countries make printed walls attractive because they cut labor time and material waste. Projects remain small but visible.
Trend 2: Are donors funding medical printing?
Yes. International agencies supply scanners and printers for prosthetics and orthotics, and governments are now funding training centers. Hospitals and universities are a fast-growing customer group.
Trend 3: Are aerospace clusters forming?
Yes. Morocco aims to double aerospace turnover to MAD 53 billion by 2030, and Safran launched a landing-gear plant there in February 2026. Aerospace suppliers need metrology, scanning and printing for tooling and parts.
Trend 4: Are smart materials emerging?
Slowly. Smart and stimuli-responsive materials grow fastest by printing material at 20.84% a year, but from a very small base in university research. The wider field is covered in the 4D printing market.
Import Reliance, Funding Gaps and Skills Shortages Limit Growth
Why is import dependence a problem?
Nearly all printers, cameras and displays are imported, so prices carry freight, duties and currency risk. Weak currencies in Nigeria and Egypt raise equipment costs sharply.
Are projects fully funded?
Not always. Nigeria's planned metal printing hub has no published budget and relies on private partners to supply equipment and capital.
Are skills available?
Not enough. In Nigeria, more than 1,000 prosthetics professionals are waiting for training while only 20 trainers were selected in the first round. Similar gaps exist in metal printing and 3D inspection.
Is the installed base small?
Yes. South Africa's last official count found more than 300 additive manufacturing systems in 2019, and reseller coverage is thin in most other countries.
Where are the opportunities?
Service bureaus that offer printing, scanning and design on demand can serve firms that cannot buy their own equipment. Local medical printing and construction printing also offer clear social returns that attract donor and public funds. The execution risk is building trained staff and reliable after-sales support.
South Africa Leads, Morocco and Nigeria Grow Fastest
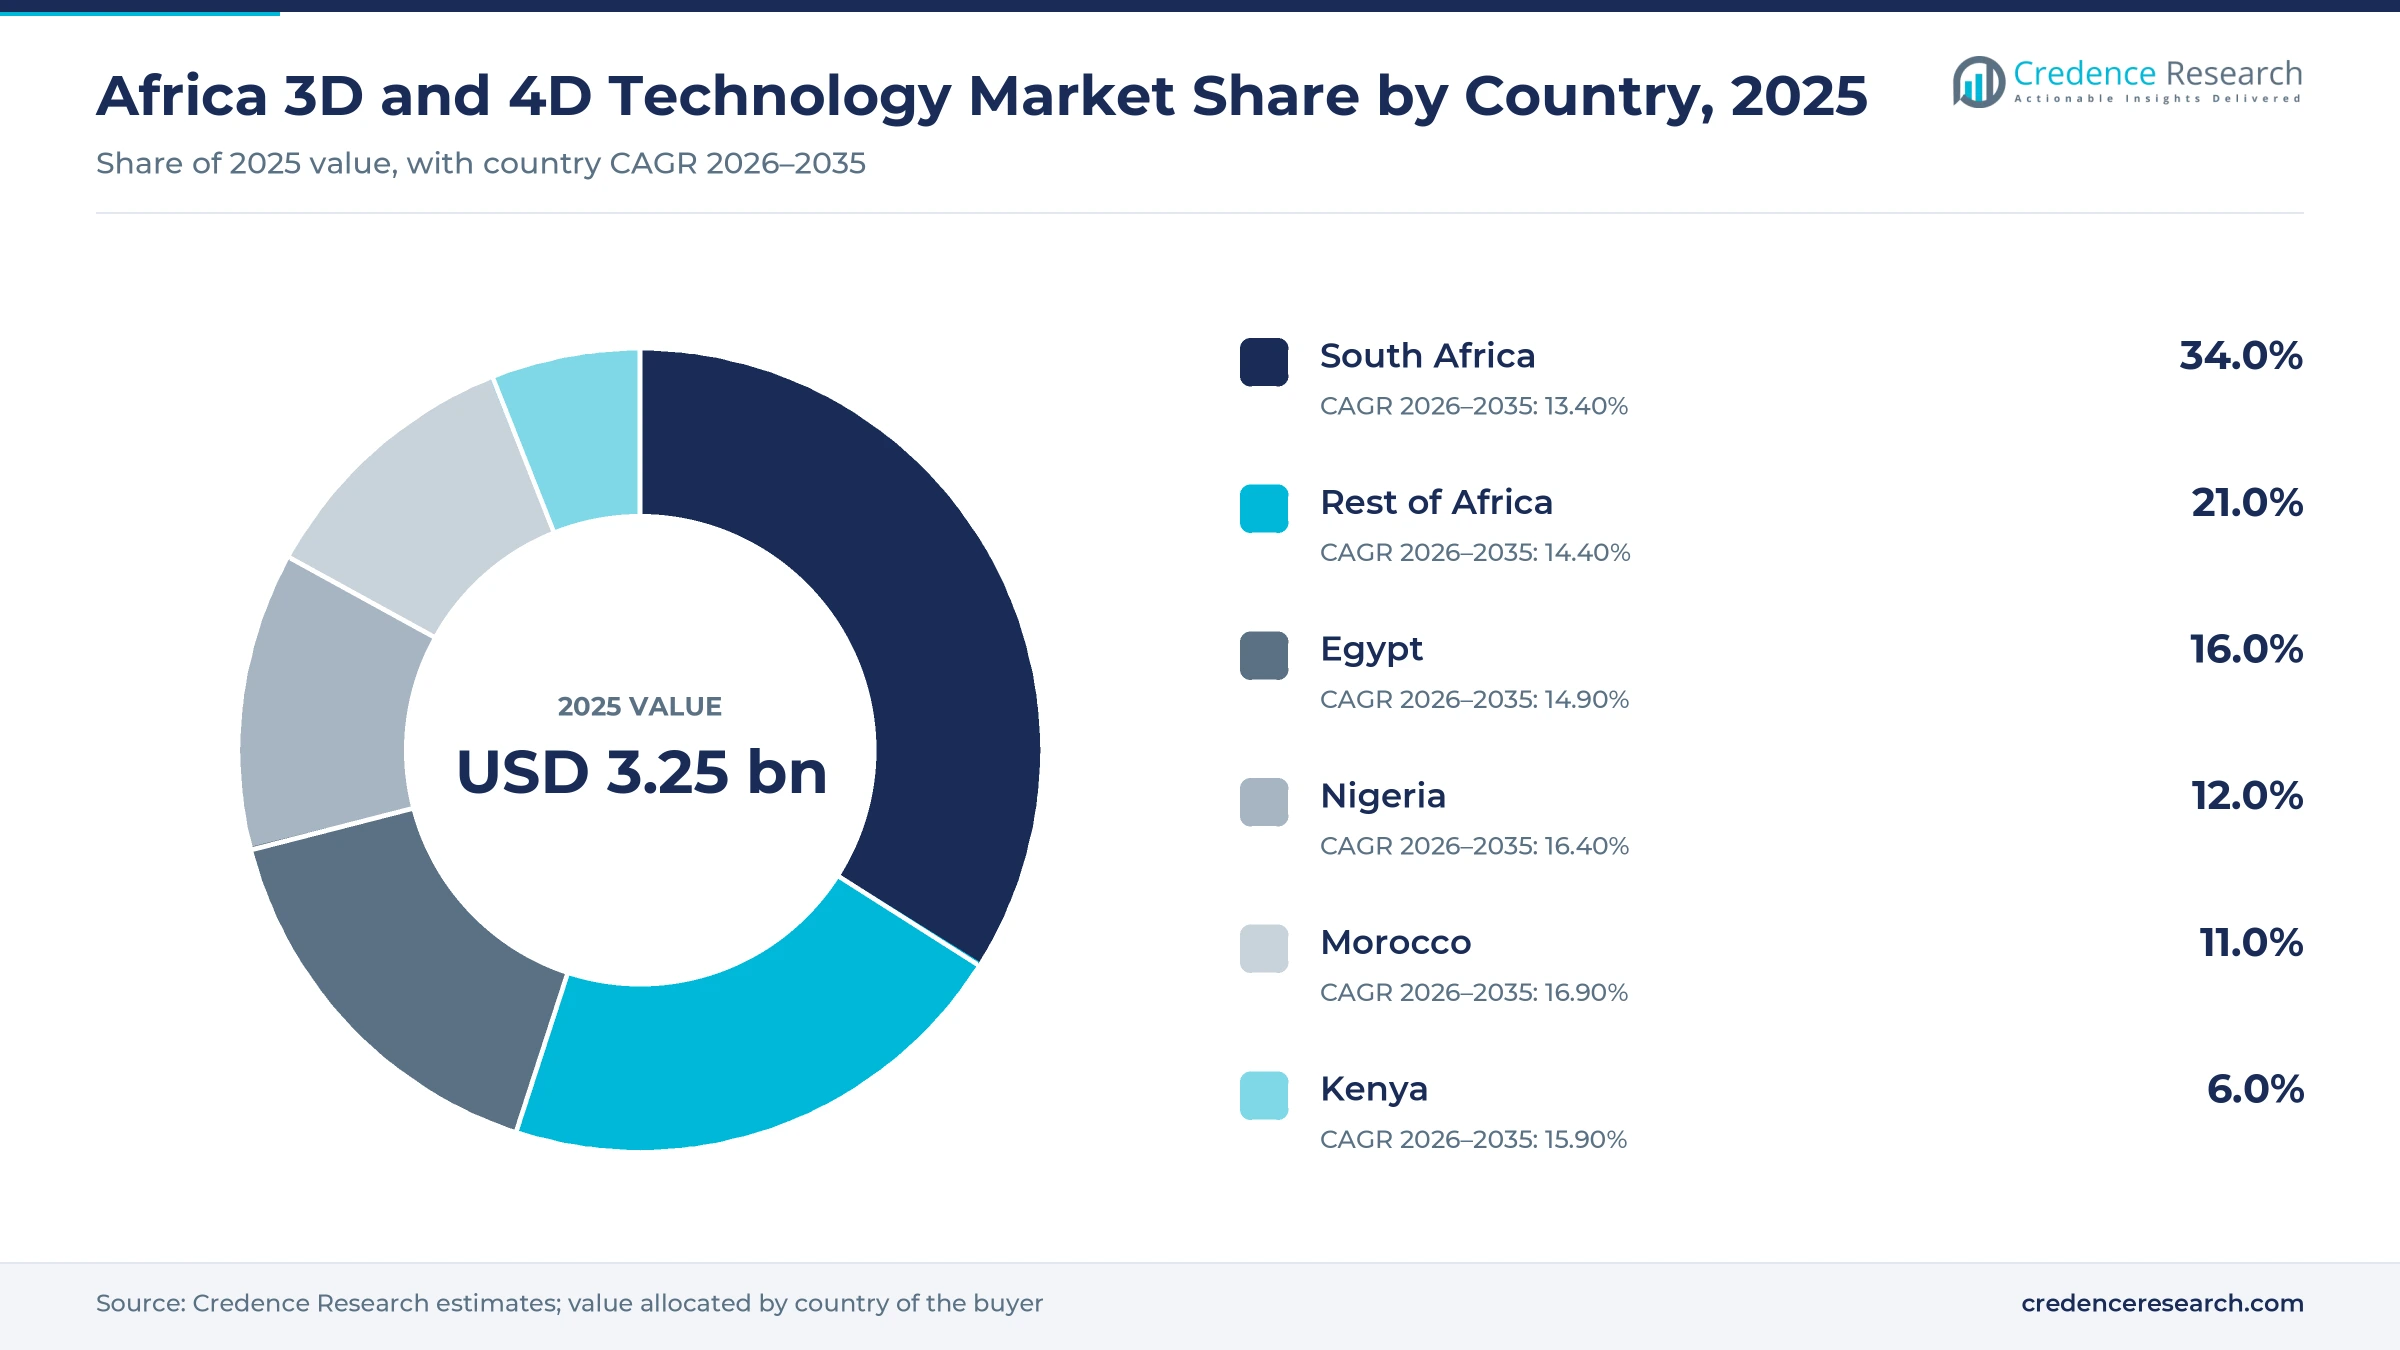
Africa 3D and 4D technology value is allocated to the country of the buyer.
| Country | Share 2025 | CAGR 2026–2035 |
|---|---|---|
| South Africa | 34.0% | 13.40% |
| Rest of Africa | 21.0% | 14.40% |
| Egypt | 16.0% | 14.90% |
| Nigeria | 12.0% | 16.40% |
| Morocco | 11.0% | 16.90% |
| Kenya | 6.0% | 15.90% |
Why does South Africa lead?
South Africa holds a 34.0% share in 2025 and grows at 13.40% a year. The CSIR and Aerosud built the Aeroswift large titanium printer, most universities run printing labs, and Dassault Systèmes and Hexagon have local teams.
Why does Morocco grow fastest?
Morocco holds 11.0% and is the fastest-growing country at 16.90% a year. More than 150 aerospace firms and new Safran plants near Casablanca need scanning, inspection and printed tooling.
What drives Egypt and Nigeria?
Egypt holds 16.0% and grows at 14.90%. Samsung's Beni Suef plant makes TVs and phones, and Orascom is bringing construction printing to the country. Nigeria holds 12.0% and grows at 16.40%, supported by medical printing programs and the planned NASENI metal printing hub.
What about Kenya and the rest of Africa?
Kenya holds 6.0% and grows at 15.90%, led by printed housing and a growing tech sector. The rest of Africa holds 21.0% and grows at 14.40%, with demand concentrated in universities, mining and donor projects.
Programs, Investments and Project Launches, 2025–2026
| Development | Status and why it matters |
|---|---|
| In October 2026, Nigeria's health ministry announced funding for a 3D prosthetics training center in Abuja. | Announced. Builds medical printing skills. |
| In September 2026, NASENI unveiled plans for Nigeria's first metal additive manufacturing hub in Abuja. | Announced. Targets local parts production. |
| In May 2026, UNIDO and Japanese partners handed 3D prosthetic equipment to Nigeria's Medical Rehabilitation Therapists Board. | Completed. Expands donor-funded printing. |
| In February 2026, King Mohammed VI launched a Safran Landing Systems plant in Morocco worth more than EUR 280 million. | Launched. Adds aerospace demand for 3D tools. |
| In February 2026, South Africa's CPAM program closed its fourth call for industry-led printing projects. | Closed. Funds local research. |
| In October 2025, Safran signed agreements for a LEAP engine assembly line and maintenance plant near Casablanca. | Contracted. Expands Morocco's aerospace cluster. |
| In October 2025, RAPDASA held its national additive manufacturing conference in Pretoria. | Completed. Connects research and industry. |
Need a Custom Version of This Report?
Tailor the scope, geography, or segments to your exact requirements.
- Custom geography or segment scope
- Direct access to our analyst team
Global Suppliers Serve Africa Mainly Through Resellers and Local Partners
Global printer, software, camera and display makers dominate supply, usually through resellers. Local firms add value through services, design and construction printing. No share ranking is given because suppliers do not report African sales of these products separately.
Which suppliers have a verified local presence?
Dassault Systèmes SE has offices in Midrand and Stellenbosch in South Africa and sells design software used in product development. Hexagon AB has an Africa team in South Africa and 24 distribution partners for metrology, 3D scanning and design software. Samsung Electronics Co., Ltd. makes TVs and phones at Beni Suef in Egypt and runs skills programs in several countries.
Which suppliers sell mainly through resellers?
Stratasys Ltd. and 3D Systems Corporation sell industrial printers through distributors. Materialise NV supplies printing software and medical planning services. Autodesk, Inc. sells design and BIM software. Basler AG sells 3D cameras for machine vision. Their local offices could not be confirmed, so they are treated as reseller-led suppliers.
Which suppliers serve visualization only?
Panasonic Holdings Corporation sells displays, projectors and professional cameras in the region. Dolby Laboratories, Inc. licenses immersive audio and video technology for cinemas and devices, and does not take part in printing.
How do suppliers compete?
Suppliers compete on reseller reach, local service, training and financing. Construction printer maker COBOD, through partners such as 14Trees and Orascom, shows how local partnerships turn imported technology into African projects. Smaller South African resellers, such as Solid Edge Technology and 3D Printing Systems SA, supply printers and scanners to schools, labs and design studios.
Frequently Asked Questions
How big is the Africa 3D and 4D technology market?
What does the market include?
What drives the market?
Which country leads?
Which product is largest?
What holds the market back?
Table of Content
Chapter 1 Market Segmentation
- 1.1 Segmentation Framework
- 1.1.1 Product and Service Classification
- 1.1.2 Application and End-Use Classification
- 1.1.3 Technology and Solution Classification
- 1.1.4 Customer and Distribution Channel Classification
- 1.1.5 Geographic Segmentation
- 1.1.6 Market Segment Definitions and Boundaries
- 1.2 By Product
- 1.2.1 3D/4D Printing
- 1.2.2 Displays
- 1.2.3 Cameras
- 1.2.4 Sensors
- 1.2.5 Other Visualization Systems
- 1.3 By End User
- 1.3.1 Automotive
- 1.3.2 Consumer Electronics
- 1.3.3 Aerospace & Defense
- 1.3.4 Healthcare
- 1.3.5 Construction & Architecture
- 1.3.6 Media & Entertainment
- 1.4 By Printing Material
- 1.4.1 Polymers
- 1.4.2 Metals
- 1.4.3 Ceramics
- 1.4.4 Composites
- 1.4.5 Smart/Stimuli-Responsive Materials
- 1.5 By Technology
- 1.5.1 Additive Manufacturing
- 1.5.2 3D Imaging/Scanning
- 1.5.3 3D Display
- 1.5.4 4D/Time-Varying Modeling
- 1.6 By Application
- 1.6.1 Prototyping/Manufacturing
- 1.6.2 Medical Modeling
- 1.6.3 Digital Twins/BIM
- 1.6.4 Animation/VFX
- 1.6.5 Inspection
- 1.7 By Customer Type
- 1.7.1 Enterprises/OEMs
- 1.7.2 Service Bureaus
- 1.7.3 Hospitals/Universities
- 1.7.4 Government/Defense
- 1.8 By Country
- 1.8.1 South Africa
- 1.8.2 Egypt
- 1.8.3 Nigeria
- 1.8.4 Morocco
- 1.8.5 Kenya
- 1.8.6 Rest of Africa
Chapter 2 Introduction
- 2.1 Report Objectives and Scope
- 2.2 Product Definition and Industry Terminology
- 2.3 Market Inclusions and Exclusions
- 2.4 Research Process
- 2.4.1 Primary Research and Expert Interviews
- 2.4.2 Secondary Research and Source Review
- 2.4.3 Top-Down and Bottom-Up Estimation
- 2.4.4 Data Triangulation and Verification
- 2.5 Market Size Measurement Basis
- 2.5.1 2025: USD 3.25 billion → 2035: USD 12.92 billion
- 2.6 Historical and Forecast Reference Periods
- 2.6.1 Historical Period: 2018-2025
- 2.6.2 Base Year: 2025
- 2.6.3 Forecast Period: 2025-2035
- 2.7 Research Assumptions and Limitations
Chapter 3 Executive Summary
- 3.1 Market Snapshot and Key Findings
- 3.2 Base-Year Market Size, 2025
- 3.3 Forecast Market Size, 2035
- 3.4 Revenue and Volume Growth Outlook
- 3.5 Key Demand and Supply Indicators
- 3.6 Leading Market Segments
- 3.7 Fastest-Growing Market Opportunities
- 3.8 Regional Performance Highlights
- 3.9 Technology and Industry Transformation
- 3.10 Competitive Landscape Summary
- 3.11 Analyst View and Strategic Implications
Chapter 4 Global Africa 3D 4D Technology Market Trends and Developments
- 4.1 Historical Industry Development, 2018-2025
- 4.2 Recent Market Trends and Developments
- 4.3 Demand and Customer Behavior Trends
- 4.4 Technology and Product Innovation
- 4.5 Artificial Intelligence, Automation and Digitalization
- 4.6 Local Manufacturing and Supply Chain Realignment
- 4.7 Industry Partnerships, Mergers and Acquisitions
- 4.8 Sustainability and Circular Economy Developments
- 4.9 Government and Private Sector Investment Trends
- 4.10 Emerging Business Models and Commercialization
- 4.11 Industry Developments and Announcements
Chapter 5 Global Africa 3D 4D Technology Market Production, Supply and Demand Analysis
- 5.1 Demand Trend and Consumption Analysis, 2018-2025
- 5.2 Demand Forecast, 2025-2035
- 5.3 Production and Output Trend, 2018-2025
- 5.4 Production and Output Forecast, 2025-2035
- 5.5 Installed Capacity and Capacity Utilization
- 5.6 Company-Wise Production Plants and Statistics
- 5.6.1 Installed Production Capacity
- 5.6.2 Actual Production
- 5.6.3 Planned Capacity and Expansion Targets
- 5.7 Supply Chain Structure and Procurement Trends
- 5.8 Supply-Demand Gap and Bottlenecks
- 5.9 Import Dependence and Sourcing Structure
- 5.10 Contract Manufacturing and Outsourcing
- 5.11 Regional Supply and Demand Concentration
Chapter 6 Global Africa 3D 4D Technology Market Pricing Analysis
- 6.1 Pricing Structure and Measurement
- 6.2 Historical Pricing Trends, 2018-2025
- 6.3 Pricing Outlook, 2025-2035
- 6.4 Average Selling Price and Unit Economics
- 6.5 Pricing by Product and Market Segment
- 6.6 Geographic Pricing Differences
- 6.7 Key Input, Energy, Labor and Logistics Costs
- 6.8 Contract Pricing and Purchasing Models
- 6.9 Pricing Sensitivity and Competitive Positioning
- 6.10 Price, Margin and Profitability Implications
Chapter 7 Global Africa 3D 4D Technology Market Dynamics
- 7.1 Market Growth Drivers
- 7.1.1 Demand-Side Drivers
- 7.1.2 Technology and Innovation Drivers
- 7.1.3 Infrastructure and Investment Drivers
- 7.1.4 Regulatory and Policy Drivers
- 7.2 Market Restraints
- 7.2.1 Cost and Affordability Constraints
- 7.2.2 Technology and Adoption Barriers
- 7.2.3 Supply Chain and Operational Constraints
- 7.3 Market Challenges
- 7.3.1 Competitive Pressure and Margin Erosion
- 7.3.2 Skills, Infrastructure and Implementation Gaps
- 7.4 Emerging Market Opportunities
- 7.5 Market Dynamics Impact and Time-Horizon Assessment
Chapter 8 Global Africa 3D 4D Technology Value Chain Analysis
- 8.1 Industry Value Chain Overview
- 8.2 Upstream Suppliers and Critical Inputs
- 8.3 Technology and Component Providers
- 8.4 Manufacturing or Service Delivery
- 8.5 Distribution, Channel Partners and Integrators
- 8.6 Downstream Applications and End Users
- 8.7 Value Addition and Profit Pools
- 8.8 Vertical Integration and Outsourcing
- 8.9 Supplier Concentration and Risk
- 8.10 Supply Chain Localization and Resilience
Chapter 9 Global Africa 3D 4D Technology Market Regulations and Policies
- 9.1 Relevant Laws, Standards and Compliance Frameworks
- 9.2 Product, Service, Safety and Quality Requirements
- 9.3 Government Policies, Incentives and Subsidies
- 9.4 Imports, Exports and Trade Barriers
- 9.5 Public Procurement and Local Content Requirements
- 9.6 Environmental and Sustainability Compliance
- 9.7 Data Protection, AI and Cybersecurity Compliance
- 9.8 Upcoming Policy Changes and Market Implications
Chapter 10 Global Africa 3D 4D Technology Market Hotspots and Opportunities
- 10.1 Market Opportunity Mapping and Growth Hotspots
- 10.2 High-Growth Applications and Customer Groups
- 10.3 Underserved Markets and White-Space Opportunities
- 10.4 Emerging Technology and Product Opportunities
- 10.5 New Capacity and Investment Hotspots
- 10.6 Market Entry and Expansion Opportunities
- 10.7 Distribution and Partnership Opportunities
- 10.8 Near-Term and Long-Term Commercial Potential
- 10.9 Opportunity Attractiveness and Execution Risks
Chapter 11 Global Africa 3D 4D Technology Market Outlook, 2025-2035
- 11.1 Market Size and Analysis
- 11.1.1 Revenue (Market Measurement: 2025: USD 3.25 billion → 2035: USD 12.92 billion)
- 11.1.2 Market Volume and Quantity Sold
- 11.1.3 Historical Market Size, 2018-2025
- 11.1.4 Base-Year Market Size, 2025
- 11.2 Market Forecast, 2025-2035
- 11.2.1 Revenue Forecast to 2035
- 11.2.2 Volume Forecast to 2035
- 11.2.3 CAGR and Year-on-Year Growth
- 11.2.4 Incremental Revenue Opportunity
- 11.3 Forecast Assumptions and Scenario Analysis
- 11.3.1 Base-Case Forecast
- 11.3.2 Optimistic and Conservative Scenarios
- 11.3.3 Technology, Pricing and Policy Sensitivities
- 11.4 Market Attractiveness and Growth Outlook
Chapter 12 Global Africa 3D 4D Technology Market Segmentation and Outlook
- 12.1 Segmentation Summary and Market Shares, 2025
- 12.2 Largest and Fastest-Growing Segments
- 12.3 By Product - Market Size and Forecast, 2025-2035
- 12.3.1 Segment Definition and Scope
- 12.3.2 Historical Market Size, 2018-2025
- 12.3.3 Revenue Forecast, 2025-2035
- 12.3.4 Volume Forecast, 2025-2035
- 12.3.5 Base-Year Market Share, 2025
- 12.3.6 Segment CAGR and Growth Drivers
- 12.3.7 Subsegment Market Size and Forecast
- 12.3.7.1 3D/4D Printing
- 12.3.7.2 Displays
- 12.3.7.3 Cameras
- 12.3.7.4 Sensors
- 12.3.7.5 Other Visualization Systems
- 12.3.8 Subsegment Pricing and Adoption Trends
- 12.3.9 Leading Suppliers and Competition
- 12.3.10 Regional Demand and Opportunities
- 12.4 By End User - Market Size and Forecast, 2025-2035
- 12.4.1 Segment Definition and Scope
- 12.4.2 Historical Market Size, 2018-2025
- 12.4.3 Revenue Forecast, 2025-2035
- 12.4.4 Volume Forecast, 2025-2035
- 12.4.5 Base-Year Market Share, 2025
- 12.4.6 Segment CAGR and Growth Drivers
- 12.4.7 Subsegment Market Size and Forecast
- 12.4.7.1 Automotive
- 12.4.7.2 Consumer Electronics
- 12.4.7.3 Aerospace & Defense
- 12.4.7.4 Healthcare
- 12.4.7.5 Construction & Architecture
- 12.4.7.6 Media & Entertainment
- 12.4.8 Subsegment Pricing and Adoption Trends
- 12.4.9 Leading Suppliers and Competition
- 12.4.10 Regional Demand and Opportunities
- 12.5 By Printing Material - Market Size and Forecast, 2025-2035
- 12.5.1 Segment Definition and Scope
- 12.5.2 Historical Market Size, 2018-2025
- 12.5.3 Revenue Forecast, 2025-2035
- 12.5.4 Volume Forecast, 2025-2035
- 12.5.5 Base-Year Market Share, 2025
- 12.5.6 Segment CAGR and Growth Drivers
- 12.5.7 Subsegment Market Size and Forecast
- 12.5.7.1 Polymers
- 12.5.7.2 Metals
- 12.5.7.3 Ceramics
- 12.5.7.4 Composites
- 12.5.7.5 Smart/Stimuli-Responsive Materials
- 12.5.8 Subsegment Pricing and Adoption Trends
- 12.5.9 Leading Suppliers and Competition
- 12.5.10 Regional Demand and Opportunities
- 12.6 By Technology - Market Size and Forecast, 2025-2035
- 12.6.1 Segment Definition and Scope
- 12.6.2 Historical Market Size, 2018-2025
- 12.6.3 Revenue Forecast, 2025-2035
- 12.6.4 Volume Forecast, 2025-2035
- 12.6.5 Base-Year Market Share, 2025
- 12.6.6 Segment CAGR and Growth Drivers
- 12.6.7 Subsegment Market Size and Forecast
- 12.6.7.1 Additive Manufacturing
- 12.6.7.2 3D Imaging/Scanning
- 12.6.7.3 3D Display
- 12.6.7.4 4D/Time-Varying Modeling
- 12.6.8 Subsegment Pricing and Adoption Trends
- 12.6.9 Leading Suppliers and Competition
- 12.6.10 Regional Demand and Opportunities
- 12.7 By Application - Market Size and Forecast, 2025-2035
- 12.7.1 Segment Definition and Scope
- 12.7.2 Historical Market Size, 2018-2025
- 12.7.3 Revenue Forecast, 2025-2035
- 12.7.4 Volume Forecast, 2025-2035
- 12.7.5 Base-Year Market Share, 2025
- 12.7.6 Segment CAGR and Growth Drivers
- 12.7.7 Subsegment Market Size and Forecast
- 12.7.7.1 Prototyping/Manufacturing
- 12.7.7.2 Medical Modeling
- 12.7.7.3 Digital Twins/BIM
- 12.7.7.4 Animation/VFX
- 12.7.7.5 Inspection
- 12.7.8 Subsegment Pricing and Adoption Trends
- 12.7.9 Leading Suppliers and Competition
- 12.7.10 Regional Demand and Opportunities
- 12.8 By Customer Type - Market Size and Forecast, 2025-2035
- 12.8.1 Segment Definition and Scope
- 12.8.2 Historical Market Size, 2018-2025
- 12.8.3 Revenue Forecast, 2025-2035
- 12.8.4 Volume Forecast, 2025-2035
- 12.8.5 Base-Year Market Share, 2025
- 12.8.6 Segment CAGR and Growth Drivers
- 12.8.7 Subsegment Market Size and Forecast
- 12.8.7.1 Enterprises/OEMs
- 12.8.7.2 Service Bureaus
- 12.8.7.3 Hospitals/Universities
- 12.8.7.4 Government/Defense
- 12.8.8 Subsegment Pricing and Adoption Trends
- 12.8.9 Leading Suppliers and Competition
- 12.8.10 Regional Demand and Opportunities
- 12.9 By Country - Market Size and Forecast, 2025-2035
- 12.9.1 Segment Definition and Scope
- 12.9.2 Historical Market Size, 2018-2025
- 12.9.3 Revenue Forecast, 2025-2035
- 12.9.4 Volume Forecast, 2025-2035
- 12.9.5 Base-Year Market Share, 2025
- 12.9.6 Segment CAGR and Growth Drivers
- 12.9.7 Subsegment Market Size and Forecast
- 12.9.7.1 South Africa
- 12.9.7.2 Egypt
- 12.9.7.3 Nigeria
- 12.9.7.4 Morocco
- 12.9.7.5 Kenya
- 12.9.7.6 Rest of Africa
- 12.9.8 Subsegment Pricing and Adoption Trends
- 12.9.9 Leading Suppliers and Competition
- 12.9.10 Regional Demand and Opportunities
- 12.10 Segment Growth Comparison
- 12.11 Segment Attractiveness and Priority Matrix
Chapter 13 Global Africa 3D 4D Technology End-Use and Application Market Outlook
- 13.1 End-Use Industry and Customer Demand Structure
- 13.2 Leading Applications and Customer Groups
- 13.3 End-Use Market Size, Share and Forecast
- 13.4 Major End-Use Industry Deep Dives
- 13.4.1 Customer Requirements and Use Cases
- 13.4.2 Demand and Replacement Cycles
- 13.4.3 Technical and Regulatory Considerations
- 13.4.4 Purchasing and Procurement Models
- 13.4.5 Leading Vendors and Distribution Channels
- 13.4.6 Forecast and Commercial Opportunities
- 13.5 Emerging Applications and Cross-Segment Demand
- 13.6 End-Use Industry Investment Priorities
Chapter 14 Global Africa 3D 4D Technology Geographic Market Outlook, 2025-2035
- 14.1 Regional Market Size and Share, 2025
- 14.2 Regional Market Forecast, 2025-2035
- 14.3 Regional Pricing, Production and Demand Differences
- 14.4 North America
- 14.4.1 United States
- 14.4.2 Canada
- 14.4.3 Mexico
- 14.5 Europe
- 14.5.1 Germany
- 14.5.2 France
- 14.5.3 Italy
- 14.5.4 United Kingdom
- 14.5.5 Spain
- 14.5.6 Poland
- 14.5.7 Russia
- 14.5.8 Netherlands
- 14.5.9 Belgium
- 14.5.10 Sweden
- 14.5.11 Denmark
- 14.5.12 Norway
- 14.5.13 Rest of Europe
- 14.6 Asia Pacific
- 14.6.1 China
- 14.6.2 India
- 14.6.3 Japan
- 14.6.4 South Korea
- 14.6.5 Thailand
- 14.6.6 Indonesia
- 14.6.7 Vietnam
- 14.6.8 Malaysia
- 14.6.9 Australia
- 14.6.10 Rest of Asia Pacific
- 14.7 Latin America
- 14.7.1 Brazil
- 14.7.2 Argentina
- 14.7.3 Colombia
- 14.7.4 Chile
- 14.7.5 Rest of Latin America
- 14.8 Middle East
- 14.8.1 Saudi Arabia
- 14.8.2 United Arab Emirates
- 14.8.3 Turkey
- 14.8.4 Israel
- 14.8.5 Iran
- 14.8.6 Rest of the Middle East
- 14.9 Africa
- 14.9.1 South Africa
- 14.9.2 Egypt
- 14.9.3 Nigeria
- 14.9.4 Morocco
- 14.9.5 Rest of Africa
- 14.10 Regional Investment, Policy and Supply Chain Differences
- 14.11 Regional Competitive Landscape
- 14.12 Geographic Growth Hotspots
Chapter 15 Global Africa 3D 4D Technology Technology, Innovation and Sustainability Outlook
- 15.1 Technology Landscape and Maturity
- 15.2 Product, Process and Service Innovation
- 15.3 AI, Automation and Digital Tools in the Industry
- 15.4 Technology Adoption and Performance Benchmarking
- 15.5 Innovation Pipeline and R&D Investment
- 15.6 Patent and Intellectual Property Trends
- 15.7 Energy Efficiency and Resource Management
- 15.8 Sustainability, Recycling and Circularity
- 15.9 Technology Roadmap, 2025-2035
- 15.10 Risks of Obsolescence and Technology Substitution
Chapter 16 Global Africa 3D 4D Technology Market Key Strategic Imperatives
- 16.1 Growth and Market Entry Priorities
- 16.2 High-Return Products and Segments
- 16.3 Pricing, Profitability and Cost Optimization
- 16.4 Technology Investment and Product Differentiation
- 16.5 Supply Chain Localization and Resilience
- 16.6 Distribution and Customer Acquisition
- 16.7 Partnership, Acquisition and Capacity Strategy
- 16.8 Regional Expansion Priorities
- 16.9 Short-, Medium- and Long-Term Actions
Chapter 17 Competition Outlook
- 17.1 Industry Competition Characteristics
- 17.2 Market Structure and Concentration
- 17.3 Market Share and Competitive Positioning, 2025
- 17.4 Company-Wise Revenue and Product Benchmarking
- 17.5 Production and Service Capacity Benchmarking
- 17.6 Technology, Pricing and Differentiation
- 17.7 Regional Footprint and Distribution Strength
- 17.8 Mergers, Acquisitions and Strategic Alliances
- 17.9 New Entrants and Competitive Threats
- 17.10 Porter's Five Forces and Industry Attractiveness
- 17.11 Competitive Outlook, 2025-2035
Chapter 18 Company Profiles
- 18.1 Company Coverage and Selection Criteria
- 18.2 3D Systems Corporation
- 18.2.1 Business Description
- 18.2.2 Company Ownership and Geographic Presence
- 18.2.3 Product and Service Portfolio
- 18.2.4 Manufacturing and Operating Footprint
- 18.2.5 Production Capacity and Expansion Plans
- 18.2.6 Financial Performance and Investment
- 18.2.7 Market Share and Competitive Position
- 18.2.8 Technology and Innovation Capabilities
- 18.2.9 Strategic Alliances or Partnerships
- 18.2.10 Recent Developments
- 18.2.11 Growth Strategy and Outlook
- 18.3 Autodesk, Inc.
- 18.4 Dassault Systèmes SE
- 18.5 Dolby Laboratories, Inc.
- 18.6 Panasonic Holdings Corporation
- 18.7 Materialise NV
- 18.8 Hexagon AB
- 18.9 Basler AG
- 18.10 Samsung Electronics Co., Ltd.
- 18.11 Stratasys Ltd.
- 18.12 Other Relevant Market Participants
Note: Every listed company is profiled on the structure shown under the first company. The company list is preliminary and may change based on research findings, market developments, data availability and client requirements.
Chapter 19 Disclaimer
- 19.1 Research and Forecast Disclaimer
- 19.2 Data Source and Estimation Limitations
Note: The depth of individual sections depends on data availability for this market. Volume, capacity, trade and other unit-based metrics are included where applicable.