3D Printing Market Overview:
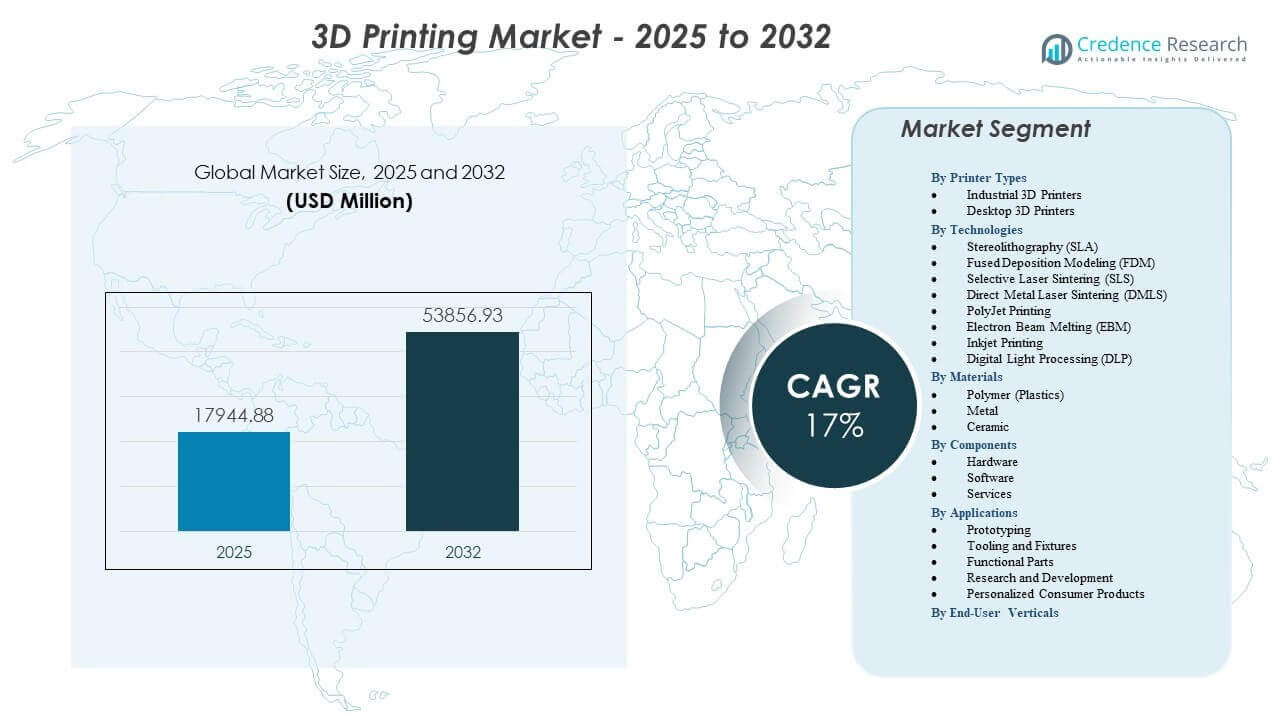
The 3D Printing Market is projected to grow from USD 17,944.88 million in 2025 to an estimated USD 53,856.93 million by 2032, with a compound annual growth rate (CAGR) of 17.0% from 2025 to 2032.
| RT ATTRIBUTE |
DETAILS |
| Historical Period |
2020-2023 |
| Base Year |
2024 |
| Forecast Period |
2025-2032 |
| 3D Printing Market Size 2025 |
USD 17,944.88 million |
| 3D Printing Market, CAGR |
17.0% |
| 3D Printing Market Size 2032 |
USD 53,856.93 million |
3D Printing Market Insights:
- Demand grows due to increased use of lightweight components, customized medical devices, and faster design cycles that support complex engineering needs across major industries.
- Market expansion faces restraints tied to high equipment costs, limited material standardization, and technical skill gaps that slow adoption in resource-constrained environments.
- North America leads the market with strong aerospace, defense, and medical applications, while Europe maintains solid momentum through automotive innovation and structured research programs.
- Asia Pacific emerges as the fastest-expanding region due to large-scale manufacturing upgrades, government-backed digitalization, and rising adoption across electronics and automotive sectors.
Market Drivers
Strong Shift Toward Digital Manufacturing Integration Across Industrial Workflows
Digital transformation accelerates wider use of additive production across aerospace, automotive, and medical sectors. Companies adopt integrated workflows that connect design tools, simulation engines, and automated inspection systems. This shift helps manufacturers reduce development cycles and optimize complex geometries. Engineers gain freedom to redesign components that were previously impossible to build with conventional tooling. Firms apply advanced CAD and topology tools to support large product portfolios. Automated build-preparation systems reduce support needs and streamline pre-production steps. Quality teams monitor part performance through in-process sensors. The 3D Printing Market gains strong momentum through these integrated digital frameworks.
- For instance, Siemens Energy utilized Nexa3D’s software and resin platforms to digitize their production of industrial gas turbine components. By integrating an automated digital workflow, they reduced the design-to-part lead time from 4 weeks to just 48 hours, achieving a 90% reduction in total development time for complex engine prototypes.
Access crucial information at unmatched prices!
Request your sample report today & start making informed decisions powered by Credence Research Inc.!
Download Sample
Rising Need For Lightweight Structures And High-Performance Components Across Key Sectors
Enterprises increase focus on weight reduction targets in aerospace, transport, and defense programs. Engineers select lattice structures to replace heavy cast parts. These redesigned components support stronger performance and improved safety margins. Manufacturers extend material libraries for polymers, composites, and metal powders. Production teams use simulation tools to optimize load-bearing elements. Quality teams validate each component through testing workflows. Lightweight designs reduce fuel use and energy demand across multiple applications. The 3D Printing Market benefits from stronger demand for advanced structural redesign.
- For instance, Boeing partnered with Norsk Titanium to produce the first FAA-approved structural titanium components for the 787 Dreamliner. By using Rapid Plasma Deposition (RPD) technology, they achieved a weight reduction of 15% to 20% compared to traditional forgings and saved approximately $2 million to $3 million in material waste per aircraft.
Growing Adoption Of Customized Medical Devices And Patient-Specific Healthcare Solutions
Healthcare providers increase reliance on personalized implants and surgical guides. Surgeons use anatomical models to improve pre-operative planning and accuracy. Hospitals integrate additive labs into clinical environments. Medical device companies expand biocompatible material portfolios. Specialists design implants tailored to each patient’s structure. AM platforms reduce waiting periods for critical procedures. Research teams support customized prosthetics and orthotics for improved comfort. The 3D Printing Market strengthens its position within next-generation medical workflows.
Expansion Of Distributed Manufacturing For Faster Production And Lower Inventory Burden
Companies adopt decentralized production models to reduce inventory pressure. Localized printing hubs produce parts closer to end-use locations. Supply chains gain resilience during sudden disruptions. Digital libraries support secure on-demand manufacturing. Industrial users reduce storage requirements while improving service lead times. Cloud platforms simplify remote collaboration across design teams. Firms maintain greater control over spare-parts availability for critical assets. The 3D Printing Market gains wider acceptance through flexible and responsive production networks.
Market Trends
Growth Of Large-Format Additive Platforms For Full-Scale Industrial Production
Manufacturers expand investments in oversized printers to create bigger components in aerospace, marine, and energy sectors. These platforms support stronger structural capabilities and faster cycle times. Engineers produce tooling, molds, and final-use assemblies without segmented builds. Large chambers reduce joining steps and improve part integrity. Production teams use these systems to streamline labor needs. Global OEMs integrate multi-laser metal units to raise throughput. Material suppliers develop powders and composites tailored for large systems. The 3D Printing Market sees stronger adoption of high-volume industrial platforms.
- For instance, Relativity Space developed the Stargate 4th Generation metal 3D printer, which utilizes a horizontal print orientation to produce fuel tanks and primary structures up to 33 feet long and 11 feet wide, reducing the total part count of their Terran R rocket by a factor of 100x compared to traditionally manufactured launch vehicles.
Greater Integration Of AI, Automation, And Predictive Quality Systems Across AM Lines
AI-enhanced build engines help teams predict defects before a print begins. Automation improves accuracy across repetitive processes. Robotic handling reduces operator intervention during part removal. Predictive monitoring tools track thermal behavior and powder distribution. Firms combine machine learning algorithms with simulation data to improve print reliability. Automated calibration helps stabilize production. Quality teams gain real-time visibility into layer formation. The 3D Printing Market benefits from smarter and more autonomous manufacturing lines.
- For instance, Velo3D integrated its Assure quality assurance software into the Sapphire production line, which uses AI to monitor over 1,000 sensors in real-time; this system detected atmospheric deviations and layer height errors to achieve a 90% first-time-right print rate on complex shrouded impellers for the energy sector.
Rising Use Of Sustainable Materials And Closed-Loop Recycling Models In Production
Enterprises shift attention toward recyclable powders and bio-based polymers. Production teams reduce waste through controlled powder reuse strategies. Recycling units help recover unused materials during each build. Companies invest in greener resins for consumer goods and industrial tools. Material research groups test carbon-neutral composites for high-performance needs. OEMs integrate sustainability dashboards into their production workflows. Print farms reduce energy demand through optimized thermal control. The 3D Printing Market moves toward cleaner and more circular material ecosystems.
Accelerated Adoption Of Metal Additive Manufacturing Across High-Value Applications
Metal printing gains traction in aerospace, energy, automotive, and medical implants. Engineers deploy titanium, aluminum, nickel alloys, and stainless-steel powders for complex parts. Multi-laser systems increase build rates across production floors. Heat treatment tools refine microstructure consistency. Firms validate metal AM workflows through rigorous qualification standards. Manufacturers use metal platforms to reduce tooling costs. Designers re-engineer legacy components for extended life cycles. The 3D Printing Market benefits from stronger industry confidence in metal technologies.
Market Challenges Analysis
High Cost Barriers, Technical Complexity, And Uneven Adoption Across Industries
Many organizations face difficulty managing capital investment for advanced AM systems. Metal printers require expensive post-processing tools that increase project cost. Technical teams need specialized training to ensure stable operations. Designers must understand material behavior across varying thermal conditions. Limited interoperability affects workflow efficiency between software tools. Enterprises encounter gaps in standardization for part qualification. These issues slow adoption for some industries. The 3D Printing Market experiences constrained uptake where budgets and skills remain limited.
Material Limitations, Quality Variability, And Slow Regulatory Alignment In Critical Sectors
Manufacturers face uneven performance across certain polymers, composites, and powders. Quality consistency depends on controlled parameters that many facilities struggle to maintain. Certification rules change between regions and sectors. Regulatory bodies move cautiously for devices and components that enter high-risk environments. Industries require strong evidence of long-term durability. Lack of universal guidelines introduces delays in product approvals. Companies must invest heavily in testing programs. The 3D Printing Market sees slower progress where compliance requirements remain strict.
Market Opportunities
Expansion Potential Across Aerospace, Healthcare, Energy, And Next-Generation Manufacturing Models
Demand rises for complex components that traditional machining cannot deliver. Aerospace companies seek higher performance and lower weight. Healthcare teams invest in personalized implants, dental devices, and surgical tools. Energy companies redesign turbines and heat-exchange systems for better efficiency. Factories adopt decentralized production cells for digital spare-parts management. Growth in these sectors supports strong technology penetration. Innovation in materials and software increases long-term adoption. The 3D Printing Market positions itself for deeper integration across critical industries.
Emergence Of New Materials, Faster Machines, And Fully Automated Production Ecosystems
Material suppliers create advanced composites, high-strength polymers, and next-generation metal powders. These innovations unlock new design possibilities for engineers. Printer manufacturers introduce faster units that raise throughput. Automated powder handling reduces labor intensity. Smart build engines reduce print errors. Robotics enable continuous operation across print farms. AI-enabled monitoring improves repeatability and performance. The 3D Printing Market gains stronger growth prospects through these evolving material and automation ecosystems.
Market Segmentation Analysis:
By Printer Types
The 3D Printing Market expands through strong demand for industrial and desktop systems. Industrial 3D printers support high-volume production, stronger dimensional accuracy, and continuous manufacturing for aerospace, automotive, and medical users. These systems enable complex geometries and consistent performance across large build platforms. Desktop 3D printers gain traction in education, consumer design, and small labs. Users prefer compact systems for prototyping and faster design cycles. Growth in home-based fabrication increases brand adoption among creators and engineers. Enterprises integrate both printer classes to support layered development workflows. It strengthens multi-environment adoption across professional and personal use cases.
- For instance, Volkswagen utilizes Ultimaker desktop units across its production plants to print over 1,000 tools and fixtures annually, achieving a 91% reduction in tool development costs and a 95% reduction in production lead times compared to sourcing from external industrial suppliers.
By Technologies
The 3D Printing Market benefits from diverse technologies that support different production needs. SLA offers high-resolution output for medical modeling and detailed prototypes. FDM remains popular for low-cost manufacturing across consumer and educational settings. SLS and DMLS provide strong mechanical performance for industrial components. EBM supports high-temperature applications in aerospace and energy programs. PolyJet enhances multi-material and color printing for advanced design tasks. Inkjet and DLP technologies expand rapid production of fine-feature parts. It helps manufacturers choose equipment based on accuracy, material strength, and design intent.
- For instance, Align Technology utilizes 3D Systems’ proprietary Stereolithography (SLA) technology to manufacture over 1.1 million unique clear aligners every day, demonstrating the technology’s capacity for high-resolution mass customization at an industrial scale.
By Materials
The 3D Printing Market gains wide application support through polymer, metal, and ceramic materials. Polymers dominate rapid prototyping, consumer goods, and functional parts requiring flexibility. Metal powders support aerospace brackets, medical implants, and automotive performance components. Ceramic materials aid high-temperature environments and specialized industrial uses. Material suppliers improve consistency, recyclability, and strength through advanced formulations. Engineers refine part performance through controlled thermal behavior. Industries adopt multi-material workflows for varied product portfolios. It supports growth across design engineering and production environments.
By Components
The 3D Printing Market evolves through hardware, software, and service components. Hardware advances enable faster builds, larger volumes, and improved precision. Software platforms integrate design tools, print optimization engines, and inspection features. Service offerings include managed printing, training, consulting, and contract manufacturing. These elements help organizations scale production without heavy operational burdens. Firms rely on automation features in software suites for consistent quality. Service providers address gaps in technical expertise across industries. It reinforces long-term ecosystem development for diverse manufacturing needs.
By Applications
The 3D Printing Market grows through expanding use cases across prototyping, tooling, fixtures, functional parts, research, and personalized consumer goods. Prototyping remains a core application for fast concept validation. Tooling and fixtures reduce downtime in manufacturing lines. Functional parts replace conventional components in automotive, aerospace, and industrial machinery. Research labs explore advanced geometries for new material behavior. Personalized consumer products gain traction through custom design features. Enterprises adopt digital workflows to shorten development cycles. It drives broader integration across product life cycles.
By End-User Verticals
The 3D Printing Market serves a wide range of industries including automotive, aerospace, healthcare, electronics, machinery, construction, energy, oil and gas, education, fashion, dental, and food sectors. Automotive firms use additive tools for prototyping and lightweight parts. Aerospace programs apply metal printing for brackets and engine components. Healthcare facilities produce implants, models, and patient-specific tools. Electronics companies adopt AM for compact structures. Construction and energy sectors test large-format printing for structural and repair applications. Creative industries develop customized jewelry and fashion accessories. It delivers value across sectors seeking flexibility, speed, and design freedom.
Segmentation:
By Printer Types
- Industrial 3D Printers
- Desktop 3D Printers
By Technologies
- Stereolithography (SLA)
- Fused Deposition Modeling (FDM)
- Selective Laser Sintering (SLS)
- Direct Metal Laser Sintering (DMLS)
- PolyJet Printing
- Electron Beam Melting (EBM)
- Inkjet Printing
- Digital Light Processing (DLP)
By Materials
- Polymer (Plastics)
- Metal
- Ceramic
By Components
- Hardware
- Software
- Services
By Applications
- Prototyping
- Tooling and Fixtures
- Functional Parts
- Research and Development
- Personalized Consumer Products
By End-User Verticals
- Automotive
- Aerospace & Defense
- Healthcare
- Consumer Electronics
- Industrial Machinery
- Power & Energy
- Construction
- Oil & Gas
- Education/Research
- Fashion & Jewelry
- Dental
- Food
By Regions
- North America
- Europe
- Germany
- France
- U.K.
- Italy
- Spain
- Rest of Europe
- Asia Pacific
- China
- Japan
- India
- South Korea
- South-east Asia
- Rest of Asia Pacific
- Latin America
- Brazil
- Argentina
- Rest of Latin America
- Middle East & Africa
- GCC Countries
- South Africa
- Rest of the Middle East and Africa
Regional Analysis:
North America holds the largest share of the global 3D Printing Market with an estimated 38% share driven by strong aerospace, defense, and medical adoption. The region leads in high-value metal additive manufacturing and enterprise-grade polymer printing. Large manufacturers invest in automated production cells and qualification labs that support industrial scaling. Universities and research centers expand innovation pipelines across materials and software. Healthcare providers accelerate demand for patient-specific devices. It maintains leadership through a mature supplier ecosystem and high technology readiness.
Europe accounts for roughly 30% share and reflects strong regulatory support for industrial additive adoption. Aerospace and automotive programs in Germany, France, and the UK drive innovation across metal printing. The region benefits from advanced research funding and strong partnerships between OEMs and universities. Manufacturers deploy additive solutions for lightweight components and tooling modernization. Healthcare and dental printing gain momentum through specialized material development. The 3D Printing Market in Europe strengthens with structured quality standards and high engineering expertise. It continues to advance industrial-scale applications.
Asia Pacific holds nearly 24% share and grows at the fastest pace due to large-scale industrial expansion. China, Japan, South Korea, and India invest in localized hardware production and material development. Governments support manufacturing modernization through subsidies and digital adoption programs. Regional firms expand capabilities in metal, polymer, and ceramic technologies. Large enterprises adopt additive tools for electronics, automotive, and consumer goods. The 3D Printing Market in Asia Pacific benefits from rising capital expenditure and strong supply chain depth. It shows significant long-term potential across high-volume manufacturing clusters.
Shape Your Report to Specific Countries or Regions & Enjoy 30% Off!
Key Player Analysis:
- Stratasys
- Xometry
- Protolabs
- 3D Systems
- Bright Laser Technologies
- Farsoon Technologies
- Materialise
- Markforged
- Nano Dimension
- Formlabs
- Velo3D
- Prodways Group
Competitive Analysis:
The 3D Printing Market features a competitive landscape shaped by hardware innovation, software integration, and service expansion. Leading companies such as Stratasys, 3D Systems, Markforged, and Formlabs strengthen their portfolios through new materials, faster hardware, and cloud-connected platforms. Metal-focused players like Velo3D, Bright Laser Technologies, and Farsoon Technologies expand adoption across aerospace and industrial manufacturing. Xometry, Protolabs, and Materialise enhance digital manufacturing networks that connect global customers to on-demand production. Startups in electronics printing and automation broaden competitive pressure. Firms compete on print speed, reliability, material diversity, and workflow automation. It remains highly dynamic due to rapid technology evolution and increased investment across industrial sectors.
Recent Developments:
- In February 2026, Hawk Ridge Systems announced a partnership with Stratasys, adding Stratasys’ multi-material PolyJet 3D printing technologies to its portfolio for advanced prototyping and production in sectors like aerospace and automotive.
Report Coverage:
The research report offers an in-depth analysis based on Printer Types, Technologies, Materials, Components, Applications, End-User Verticals, and Regions. It details leading market players, providing an overview of their business, product offerings, investments, revenue streams, and key applications. Additionally, the report includes insights into the competitive environment, SWOT analysis, current market trends, as well as the primary drivers and constraints. Furthermore, it discusses various factors that have driven market expansion in recent years. The report also explores market dynamics, regulatory scenarios, and technological advancements that are shaping the industry. It assesses the impact of external factors and global economic changes on market growth. Lastly, it provides strategic recommendations for new entrants and established companies to navigate the complexities of the market.
Future Outlook:
- Demand strengthens for industrial-grade systems as manufacturers integrate additive workflows into high-volume production.
- Adoption rises for metal technologies that support complex aerospace and automotive components.
- Software-driven automation gains wider use to stabilize quality and improve process reliability.
- Material innovation expands across polymers, composites, and metals tailored for sector-specific needs.
- Healthcare adoption accelerates through personalized implants and procedural planning models.
- Distributed manufacturing networks grow as companies shift to localized and flexible production.
- Large-format printers gain traction for tooling, construction elements, and oversized industrial parts.
- Design optimization tools support lighter, stronger structures across engineering projects.
- Regulatory frameworks evolve to improve qualification and broaden industrial acceptance.
- Sustainability goals push companies toward recyclable materials and low-waste additive processes in the 3D Printing Market.


