Antinuclear Antibody Test Market Overview:
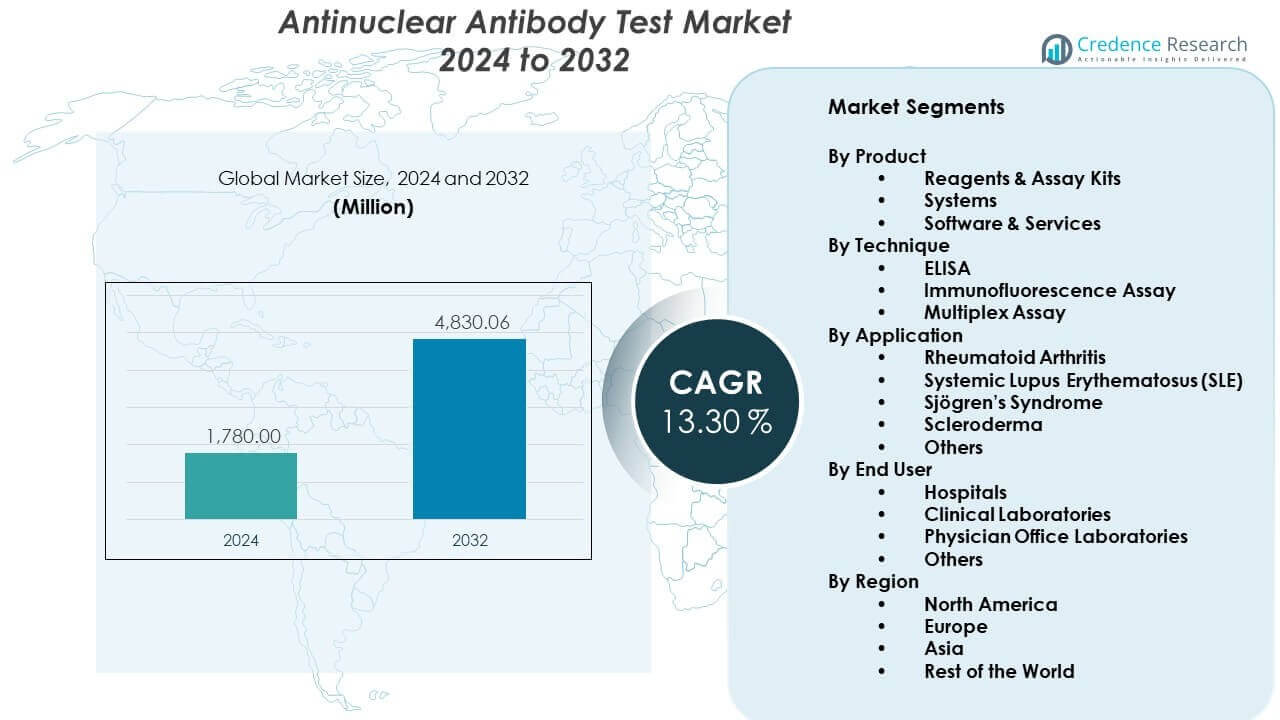
The Antinuclear Antibody Test Market is projected to grow from USD 1780 million in 2024 to an estimated USD 4830.06 million by 2032, with a compound annual growth rate (CAGR) of 13.30% from 2024 to 2032.
| REPORT ATTRIBUTE |
DETAILS |
| Historical Period |
2020-2023 |
| Base Year |
2024 |
| Forecast Period |
2025-2032 |
| Antinuclear Antibody Test Market Size 2024 |
USD 13.30 million |
| Antinuclear Antibody Test Market, CAGR |
5.7% |
| Antinuclear Antibody Test Market Size 2032 |
USD 4830.06 million |
Growing focus on early detection of autoimmune disorders drives strong uptake of antinuclear antibody testing. Healthcare providers now emphasize routine screening for conditions such as lupus and rheumatoid arthritis, which increases test volumes. Automation in immunoassay platforms improves accuracy and workflow efficiency, encouraging adoption in high-throughput labs. Rising patient awareness and improved access to specialty diagnostics also support broader utilization. Expansion of precision medicine initiatives further accelerates the integration of ANA testing into clinical decision pathways.
North America leads the Antinuclear Antibody Test Market due to strong diagnostic infrastructure, higher disease awareness, and widespread adoption of advanced immunology testing. Europe follows with robust uptake supported by well-established laboratory networks and clinician focus on early autoimmune screening. The Asia Pacific region is emerging rapidly as healthcare access grows and autoimmune disease diagnosis becomes more prioritized. Rising investments in lab automation and expanding healthcare capacity make countries such as China and India key contributors to future growth.
Antinuclear Antibody Test Market Insights:
- The Antinuclear Antibody Test Market is projected to grow from USD 1,780 million in 2024 to USD 4,830.06 million by 2032, reflecting a 30% CAGR, driven by expanding autoimmune screening needs and rising adoption of automated platforms.
- North America (40%), Europe (30%), and Asia Pacific (25%) dominate due to strong diagnostic infrastructure, high clinician awareness, and structured laboratory networks that support advanced autoimmune testing.
- The Asia Pacific region, holding 25%, is the fastest-growing market, supported by expanding healthcare spending, upgraded laboratory capacity, and rising early-diagnosis priorities across major countries.
- Reagents & Assay Kits account for about 45% of the product segment, driven by their recurring use in routine ANA screening and broad application across clinical laboratories.
- Hospitals contribute nearly 40% of end-user share due to higher test volumes, advanced diagnostic setups, and greater adoption of automated immunology systems.
Access crucial information at unmatched prices!
Request your sample report today & start making informed decisions powered by Credence Research Inc.!
Download Sample
Antinuclear Antibody Test Market Drivers:
Growing Adoption of Autoimmune Disease Screening Supported by Advanced Diagnostic Capabilities
The Antinuclear Antibody Test Market expands due to rising awareness of autoimmune disorders and earlier screening demand among diverse patient groups. Clinicians prefer reliable test panels that help identify disease patterns with higher confidence. Laboratories increase investment in automated platforms that improve accuracy and reduce manual errors. Hospitals focus on protocols that support early diagnosis and better disease management outcomes. Demand strengthens due to growing referrals from rheumatologists and primary care physicians. Training programs for medical staff create better understanding of test interpretation. Healthcare systems upgrade diagnostic infrastructure to support higher throughput. The market benefits from consistent emphasis on early intervention strategies.
Increasing Integration of Automated Immunoassay Systems in Medium and Large Clinical Laboratories
Automation adoption accelerates due to the need for faster turnaround times and better workflow consistency. Automated immunoassay analyzers deliver higher reproducibility across high-volume settings. Standardized test kits support laboratories that handle complex autoimmune panels. The Antinuclear Antibody Test Market gains traction when automation reduces the burden on skilled technicians. It supports seamless reporting through enhanced data management features. Labs prefer modular systems that scale with test demand. Procurement teams evaluate instruments based on flexibility across multiple assays. Automation encourages central laboratories to consolidate operations for efficiency gains.
- For instance, Bio-Rad Laboratories’ BioPlex 2200 system utilizes multiplex flow immunoassay technology to process up to 100 samples per hour, allowing laboratories to simultaneously screen for 11 different ANA analytes from a single patient tube.
Rising Prevalence of Autoimmune Disorders Driving Broader Diagnostic Utilization Across Care Pathways
Autoimmune disease cases increase globally, pushing diagnostic networks to expand testing access. Patients seek early evaluation due to wider recognition of disease symptoms. Clinicians rely on ANA testing to guide next-step investigations and treatment decisions. Public health bodies highlight autoimmune conditions in chronic disease programs. The Antinuclear Antibody Test Market grows as demand rises from outpatient clinics and specialty centers. It gains momentum when patient advocacy groups promote awareness campaigns. Digital tools help patients track symptom patterns, prompting timely diagnostic visits. Screening becomes more routine in regions improving healthcare infrastructure.
Clinical Emphasis on Early Intervention Strengthening Demand for Comprehensive Autoimmune Panels
Healthcare providers prioritize early detection strategies to prevent disease progression. ANA testing remains a key part of diagnostic workflows for lupus and related conditions. Providers expand testing in preventive care programs. The Antinuclear Antibody Test Market benefits when insurers include autoimmune panels under broader coverage. It encourages more patients to access testing through primary providers. Research efforts support biomarker development for improved diagnostic accuracy. Hospitals develop protocols that streamline patient triage toward rheumatology. Clinicians look for tests that reduce delays and improve referral quality.
- For instance, Werfen (Inova Diagnostics) has deployed the Aptiva platform, which utilizes Particle-Based Multi-Analyte Technology (PMAT) to achieve a dynamic range exceeding 300 IU/mL, allowing clinicians to detect low-titer autoantibodies that were previously missed by traditional methods.
Antinuclear Antibody Test Market Trends:
Expansion of Multiplex Testing Platforms Supporting More Detailed Autoimmune Profiling
Multiplex platforms gain traction due to the need for broader antibody profiling in a single workflow. These platforms support laboratories aiming to streamline complex autoimmune investigations. The Antinuclear Antibody Test Market benefits when multiplex panels shorten diagnostic timelines. It strengthens clinician confidence by reducing repeat testing requirements. Vendors develop platforms with improved optical and digital detection technologies. Laboratories adopt solutions that accommodate numerous antibody targets with minimal sample volume. Demand grows in research institutions studying disease heterogeneity. Adoption increases when multiplexing aligns with precision-medicine goals.
- For instance, the Bio-Rad BioPlex 2200 system utilizes magnetic bead-based multiplex technology to simultaneously detect 11 specific autoantibodies including dsDNA, Smith, and RNP from a single 10-microliter patient sample.
Advancements in Algorithm-Driven Pattern Interpretation Enhancing Diagnostic Confidence
Pattern interpretation improves with analytical tools that guide technicians through standardized workflows. AI-enabled platforms help reduce variability across different operators. The Antinuclear Antibody Test Market gains relevance when automated interpretation supports consistent outcomes. It improves decision support for clinicians evaluating ambiguous autoimmune cases. Vendors integrate software that flags atypical patterns for further review. Labs invest in platforms that simplify reporting for electronic health records. Pattern recognition advances help reduce misinterpretation rates. Diagnostic teams rely on clearer visual outputs that accelerate case assessments.
Shift Toward Point-of-Care Immunology Testing in Decentralized Healthcare Settings
Interest grows in point-of-care solutions that support rural and decentralized settings. These compact platforms offer quick results for frontline clinical teams. The Antinuclear Antibody Test Market benefits when point-of-care tools reduce referral delays. It supports clinics that cannot invest in high-capacity analyzers. Manufacturers design portable instruments with simplified workflows. Adoption increases among outpatient centers seeking rapid autoimmune screening. Health systems explore distributed diagnostic networks for improved accessibility. Market participants introduce consumables suited for near-patient environments.
Increasing Focus on Harmonization of ANA Test Protocols Across Regional and Global Networks
Regulatory bodies work to standardize testing guidelines across borders. Laboratories respond by aligning workflows with updated reporting formats. The Antinuclear Antibody Test Market progresses when harmonization improves comparability of results. It helps clinicians interpret tests with more confidence across institutions. Vendors revise reagent formulations to meet emerging guideline expectations. Laboratories adopt shared quality assurance programs for proficiency improvement. Harmonization efforts support integrated diagnostic pathways. Training modules improve staff competence in standardized methodologies.
- For instance, the adoption of the International Consensus on ANA Patterns (ICAP) has strengthened global harmonization of ANA IFA reporting, and platforms such as Werfen’s NOVA View incorporate ICAP nomenclature to support consistent pattern recognition and standardized diagnostic workflows.
Antinuclear Antibody Test Market Challenges Analysis:
High Variability in Test Interpretation and Limited Standardization Across Laboratories
Interpretation inconsistencies challenge clinical confidence in ANA testing due to operator-dependent variation. Laboratories struggle with differences in staining intensity and pattern recognition. The Antinuclear Antibody Test Market experiences pressure when inconsistent outputs delay diagnostic decisions. It prompts clinicians to request repeat tests for confirmation. Standardization efforts remain slow across regions with diverse regulatory oversight. Smaller labs face difficulty investing in advanced imaging tools. Training gaps further widen result variability. The challenge persists despite improvements in automated systems.
Limited Access to Advanced Diagnostic Infrastructure in Developing Regions
Many regions lack the equipment required to support high-quality autoimmune testing. Hospitals depend on centralized laboratories that operate with constrained capacity. The Antinuclear Antibody Test Market faces obstacles when infrastructure limits testing reach. It restricts timely diagnosis for patients in underserved settings. Limited reimbursement frameworks reduce the affordability of autoimmune panels. Skilled personnel shortages hinder accurate interpretation. Logistics issues delay reagent supply and equipment servicing. These barriers slow adoption in emerging healthcare markets.
Antinuclear Antibody Test Market Opportunities:
Expansion of Automated and Multiplex Platforms Across Emerging Diagnostics Networks
Automation adoption in developing regions offers new pathways for market expansion. Laboratories seek platforms that reduce manual workloads and improve reliability. The Antinuclear Antibody Test Market gains momentum when automation reaches mid-tier hospitals. It encourages providers to upgrade legacy systems. Vendors can expand distribution channels supporting training and long-term service. Hospitals look for systems compatible with broader autoimmune test panels. Adoption grows when infrastructure investments align with national health reforms. The opportunity strengthens as labs modernize their testing capacity.
Growing Use of Pattern-Based AI Tools to Improve Interpretation Accuracy in Autoimmune Testing
AI-based interpretation platforms create strong commercial potential for developers. These tools help reduce inconsistencies across laboratories. The Antinuclear Antibody Test Market benefits when AI strengthens decision support. It introduces opportunities for partnerships with digital health firms. Research groups deploy AI tools for antibody mapping studies. Hospitals integrate software that improves reporting clarity. Vendors promote systems with scalable analytics features. AI integration enables more reliable pattern recognition across complex cases.
Antinuclear Antibody Test Market Segmentation Analysis:
By Product Segment
The Antinuclear Antibody Test Market expands through strong demand for reagents and assay kits that support routine autoimmune testing across diverse clinical settings. Systems gain traction due to automation needs in high-volume laboratories seeking faster turnaround times and improved standardization. Software and services play a growing role by supporting data interpretation, quality control, and reporting functions. The segment structure reflects rising adoption of integrated platforms that streamline workflows and reduce manual errors. It aligns with laboratory priorities centered on accuracy and operational efficiency. Vendors enhance portfolios with flexible product configurations. The product mix supports broad diagnostic coverage and consistent test performance.
By Technique Segment
ELISA retains wide use due to simplicity, scalability, and compatibility with established laboratory workflows. Immunofluorescence assay remains a preferred reference method because of its detailed pattern recognition capability. Multiplex assay adoption grows where clinicians require comprehensive antibody profiling for complex autoimmune cases. The Antinuclear Antibody Test Market supports technique diversification to meet varied diagnostic needs. It reflects laboratory preference for platforms that balance precision, throughput, and interpretive clarity. Each technique segment contributes to distinct testing pathways. Technology upgrades improve reproducibility and reduce operator-dependent variability. Laboratories evaluate techniques based on case complexity and turnaround requirements.
- For instance, Thermo Fisher Scientific’s EliA autoimmune testing platform uses a fluorescence-based enzyme immunoassay method that delivers high analytical precision and improved standardization for dsDNA antibody detection, supporting more reliable clinical interpretation than traditional manual ELISA techniques.
By Application and End User Segments
Rheumatoid arthritis, SLE, Sjögren’s syndrome, scleroderma, and other autoimmune conditions drive screening demand across care pathways. Providers use ANA testing to guide early diagnosis and referral decisions. Hospitals lead adoption due to advanced diagnostic capabilities. Clinical laboratories support large test volumes with automated platforms. Physician office laboratories expand testing access for frontline evaluation. The segment spread highlights the broad clinical relevance of ANA screening. It supports consistent disease monitoring across healthcare networks.
- For instance, in high-volume hospital settings, the Werfen BIO-FLASH chemiluminescence analyzer supports rapid autoimmune testing workflows by delivering fast, fully automated detection of key SLE-related autoantibodies, enabling acute care teams to accelerate diagnostic evaluation for patients with complex multisystem symptoms.
Segmentation:
By Product
- Reagents & Assay Kits
- Systems
- Software & Services
By Technique
- ELISA
- Immunofluorescence Assay
- Multiplex Assay
By Application
- Rheumatoid Arthritis
- Systemic Lupus Erythematosus (SLE)
- Sjögren’s Syndrome
- Scleroderma
- Others
By End User
- Hospitals
- Clinical Laboratories
- Physician Office Laboratories
- Others
By Region
- North America
- Europe
- Germany
- France
- U.K.
- Italy
- Spain
- Rest of Europe
- Asia Pacific
- China
- Japan
- India
- South Korea
- South-east Asia
- Rest of Asia Pacific
- Latin America
- Brazil
- Argentina
- Rest of Latin America
- Middle East & Africa
- GCC Countries
- South Africa
- Rest of the Middle East and Africa
Regional Analysis:
North America
North America holds the largest share of the Antinuclear Antibody Test Market, accounting for around 40% of total revenue. Strong diagnostic infrastructure supports high adoption across hospitals and laboratories. Clinicians rely on advanced immunology platforms that improve accuracy and reduce interpretation gaps. The region benefits from established reimbursement frameworks that encourage autoimmune screening. Research institutions contribute to steady assay development and workflow improvements. The market strengthens due to growing awareness of autoimmune disease symptoms. It maintains leadership through continued investment in automated and digital diagnostic systems.
Europe
Europe represents approximately 30% of the global market, driven by strong laboratory networks and standardized diagnostic practices. Countries across the region adopt harmonized testing guidelines that support consistent reporting. Hospitals expand autoimmune panels to improve early detection rates. The Antinuclear Antibody Test Market benefits from broad clinician training programs that enhance pattern interpretation skills. It grows steadily due to rising autoimmune disorder prevalence and improved healthcare access. Regulatory bodies promote quality assurance programs to improve proficiency across laboratories. Europe remains a key region due to its structured diagnostic ecosystem.
Asia Pacific and Rest of the World
Asia Pacific holds nearly 25% of global share, supported by rapid expansion of healthcare infrastructure and rising test awareness. Demand increases in China and India where autoimmune screening becomes more integrated into routine care. Laboratories invest in automated systems that improve scalability. It gains momentum as large patient pools drive test volume growth. The remaining 5% share comes from regions in Latin America, the Middle East, and Africa where diagnostic capabilities continue to develop. Providers seek cost-effective platforms that support broad population access. Growth potential remains strong as investments strengthen testing capacity across emerging markets.
Shape Your Report to Specific Countries or Regions & Enjoy 30% Off!
Key Player Analysis:
Competitive Analysis:
The Antinuclear Antibody Test Market features strong competition driven by innovation in automated platforms, reagent quality, and advanced interpretation software. Major players focus on expanding test menus, improving standardization, and strengthening global distribution networks. Companies invest in technology upgrades that support higher throughput and more consistent pattern recognition. Strategic collaborations help vendors enter new regions and expand customer bases. It benefits from continuous improvements in assay precision and workflow integration. Competitors emphasize regulatory compliance and training programs that enhance laboratory performance. Product differentiation remains centered on accuracy, ease of use, and digital support features.
Recent Developments:
- In February 2025, Bio-Rad Laboratories announced its intent to acquire Stilla Technologies, a developer of digital PCR solutions, to expand its clinical diagnostics reach into high-sensitivity applications like liquid biopsy and infectious disease testing. By February 2026, Bio-Rad confirmed that its diagnostics segment had returned to growth, fueled by strong demand for its QX700 Droplet Digital PCR family and plans for further IVD product launches throughout the year.
- In January 2024, ZEUS Scientific officially began operating as Sebia Autoimmune & Infectious Diseases following its earlier acquisition by Sebia. This rebranding integrated ZEUS’s FDA-cleared dIFine digital immunofluorescence system and ANA HEp-2 indirect fluorescent antibody (IFA) assays into a broader catalog that includes the Alegria 2 system for automated autoimmune testing.
Report Coverage:
The research report offers an in-depth analysis based on Product, Technique, Disease/Application, End User, and Region. It details leading market players, providing an overview of their business, product offerings, investments, revenue streams, and key applications. Additionally, the report includes insights into the competitive environment, SWOT analysis, current market trends, as well as the primary drivers and constraints. Furthermore, it discusses various factors that have driven market expansion in recent years. The report also explores market dynamics, regulatory scenarios, and technological advancements that are shaping the industry. It assesses the impact of external factors and global economic changes on market growth. Lastly, it provides strategic recommendations for new entrants and established companies to navigate the complexities of the market.
Future Outlook:
- Growing demand for early autoimmune screening will drive stronger adoption of advanced diagnostic platforms across hospitals and reference laboratories, improving clinical decision pathways worldwide.
- Laboratories will increasingly rely on automated immunoassay systems that support faster processing, improved consistency, and reduced technician dependency in routine autoimmune testing environments.
- AI-enabled interpretation tools will elevate accuracy by supporting clearer pattern recognition and minimizing subjective variability linked to manual assessment.
- Rising awareness of autoimmune diseases will encourage providers to integrate broader antibody panels into routine evaluations, strengthening diagnostic coverage for complex conditions.
- Portable and decentralized testing systems will expand access in underserved regions, supporting earlier detection and timely clinical intervention across diverse patient populations.
- Cloud-based reporting tools will reshape laboratory workflows by improving connectivity, real-time data exchange, and accessibility of structured diagnostic insights.
- Continuous training programs for laboratory professionals will enhance proficiency in pattern interpretation and strengthen overall diagnostic reliability across institutions.
- Emerging markets will experience rapid expansion due to growing healthcare investment, improved laboratory infrastructure, and wider clinical awareness of autoimmune disorders.
- Collaborations between diagnostics companies and research groups will accelerate innovation in assay performance and analytical software development.
- Adoption of multiplex testing solutions will rise as clinicians demand comprehensive profiling capabilities that streamline autoimmune investigations and reduce repeat testing.


