Market Overview
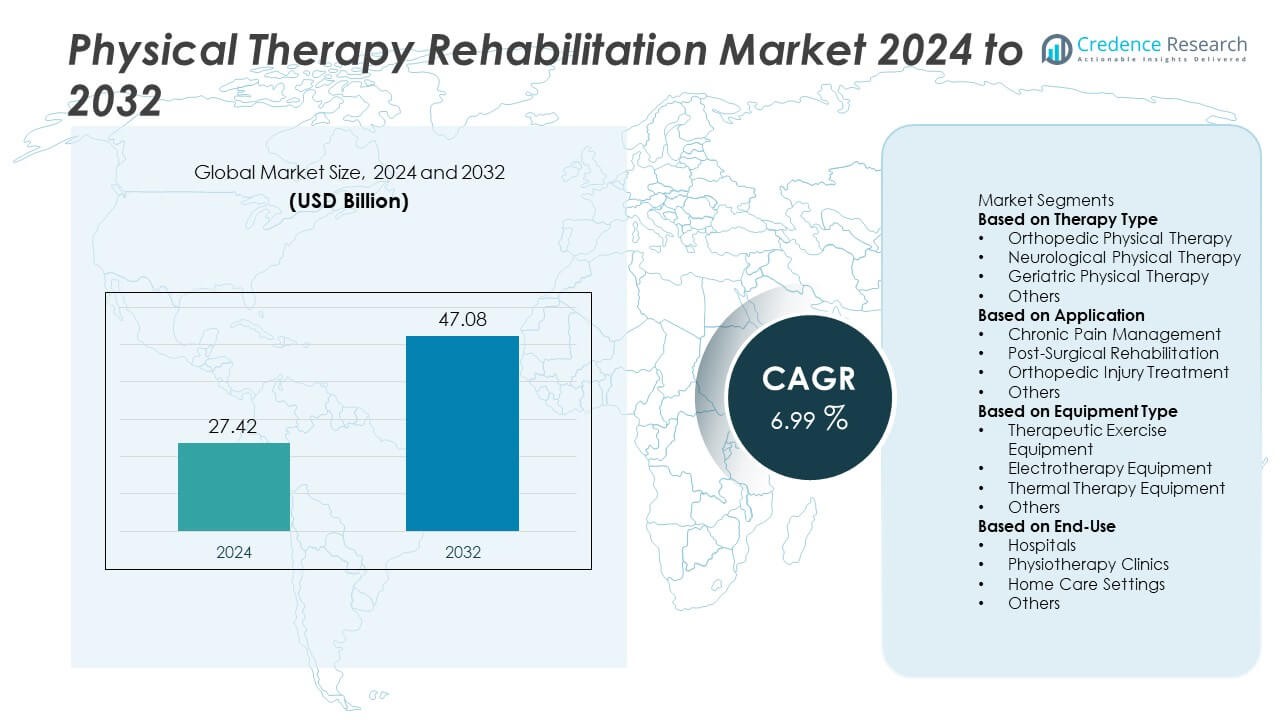
The Physical Therapy Rehabilitation Market was valued at USD 27.42 billion in 2024 and is projected to reach USD 47.08 billion by 2032, registering a CAGR of 6.99% during the forecast period.
| REPORT ATTRIBUTE |
DETAILS |
| Historical Period |
2020-2023 |
| Base Year |
2024 |
| Forecast Period |
2025-2032 |
| Physical Therapy Rehabilitation Market Size 2024 |
USD 27.42 Billion |
| Physical Therapy Rehabilitation Market, CAGR |
6.99% |
| Physical Therapy Rehabilitation Market Size 2032 |
USD 47.08 Billion |
The Physical Therapy Rehabilitation market is shaped by major players such as Select Medical Holdings Corporation, Upstream Rehabilitation, Athletico Physical Therapy, ATI Physical Therapy, U.S. Physical Therapy, BTL Industries, Enovis, Zimmer Biomet, Performance Health, and Medline Industries. These companies strengthen their competitive position through clinic expansion, advanced rehabilitation equipment, and digital therapy solutions. North America leads the market with a 39% market share, supported by strong healthcare infrastructure and high adoption of physiotherapy services. Europe follows with a 28% share, driven by established rehabilitation networks, while Asia Pacific holds a 23% share, expanding rapidly due to rising healthcare investment and growing demand for orthopedic and chronic pain rehabilitation.
Access crucial information at unmatched prices!
Request your sample report today & start making informed decisions powered by Credence Research Inc.!
Download Sample
Market Insights
- The Physical Therapy Rehabilitation market reached USD 27.42 billion in 2024 and is forecast to hit USD 47.08 billion by 2032, registering a 6.99% CAGR, driven by rising demand for mobility restoration and pain-management services.
- Market growth is supported by a surge in chronic pain cases, higher orthopedic surgery volumes, and greater adoption of therapeutic exercise programs, where orthopedic physical therapy leads with a 41% segment share due to strong demand for musculoskeletal recovery.
- Key trends include rapid uptake of digital and home-based rehabilitation models, along with wider use of electrotherapy and thermal therapy devices, while therapeutic exercise equipment dominates the equipment segment with a 44% share.
- The competitive landscape strengthens as major players expand clinic networks, invest in advanced rehabilitation tools, and integrate tele-rehabilitation platforms to enhance patient outcomes and service efficiency.
- Regional performance is led by North America with a 39% share, followed by Europe at 28%, and Asia Pacific at 23%, supported by rising healthcare investment and broader access to physiotherapy services.
Market Segmentation Analysis:
By Therapy Type
Orthopedic physical therapy holds the dominant position in the therapy type segment with a 41% market share, driven by the high prevalence of musculoskeletal disorders and rising incidences of fractures, joint injuries, and surgical recovery needs. Growing sports injuries and age-related mobility challenges further raise demand for orthopedic rehabilitation services. Neurological and geriatric therapies also expand as stroke cases rise and the elderly population increases. The segment benefits from improved assessment tools, advanced treatment protocols, and strong patient awareness regarding early rehabilitation.
- For instance, BTL Industries introduced its BTL Super Inductive System, which delivers focused electromagnetic stimulation using a field intensity of up to 2.5 Tesla.
By Application
Chronic pain management leads the application segment with a 38% market share, supported by the rising global burden of back pain, arthritis, and lifestyle-related musculoskeletal disorders. Increasing preference for non-pharmacological pain relief drives greater adoption of structured therapy programs. Post-surgical rehabilitation also expands due to higher volumes of knee, hip, and spinal surgeries. Orthopedic injury treatment grows with increased sports participation and trauma cases. Improved access to outpatient physiotherapy centers and personalized recovery plans continues to support growth across this segment.
- For instance, Enovis (DJO Global) enhanced its COMPEX electrotherapy line with muscle stimulators operating at up to 120 mA output, enabling precise neuromuscular stimulation for chronic pain programs.
By Equipment Type
Therapeutic exercise equipment dominates the equipment type segment with a 44% market share, driven by its central role in strength building, mobility training, and functional recovery programs. Healthcare facilities increasingly adopt advanced rehabilitation tools to deliver personalized therapy and improve patient outcomes. Electrotherapy and thermal therapy devices also see growing use due to their effectiveness in pain reduction and inflammation control. The segment benefits from technology upgrades, connected rehabilitation systems, and rising demand for home-based exercise kits that support long-term recovery outside clinical settings.
Key Growth Driver
Rising Burden of Musculoskeletal and Chronic Conditions
The growing incidence of musculoskeletal disorders and chronic diseases drives strong demand for physical therapy rehabilitation. Rising cases of arthritis, back pain, joint degeneration, and long-term mobility issues push patients toward structured therapy programs. Lifestyle changes, sedentary routines, and higher obesity rates also increase the need for long-term rehabilitation support. Hospitals and physiotherapy centers expand specialized programs for chronic pain management and functional recovery. As more patients seek non-invasive, medication-free treatment options, rehabilitation services play a key role in improving strength, mobility, and overall quality of life across all age groups.
- For instance, Zimmer Biomet expanded the ROSA® Knee System, which uses real-time data and optical trackers during surgery to assist surgeons with bone resections and soft tissue assessment.
Increasing Post-Surgical Rehabilitation Needs
Growth in orthopedic, neurological, and cardiac surgeries boosts the need for targeted rehabilitation. Increasing volumes of knee replacements, hip replacements, and spinal surgeries require structured therapy to restore mobility and reduce recovery time. Surgeons integrate physiotherapy into post-operative pathways to prevent complications and enhance functional outcomes. Rising trauma and sports injuries also boost demand for personalized rehabilitation plans. Healthcare facilities invest in advanced therapy equipment and skilled therapists to support faster recovery. Strong emphasis on early mobilization and outpatient rehabilitation continues to expand the market’s post-surgical segment.
- For instance, Medline Industries offers various solutions for temperature management, including Accu-Therm hot/cold gel packs for general pain relief and the advanced ComfortTemp Patient Warming System used in surgical settings.
Expanding Geriatric Population Requiring Mobility Support
The aging population contributes significantly to market expansion, as elderly individuals face higher risks of joint disorders, balance issues, fractures, and degenerative conditions. Geriatric patients rely on physical therapy to maintain strength, prevent falls, and improve daily functioning. Rehabilitation programs designed for age-related needs support longer independence and reduced hospitalization rates. Increased awareness of preventive care and home-based physiotherapy further boosts adoption. Governments and healthcare systems invest in geriatric care infrastructure, encouraging wider use of physiotherapy for long-term mobility support and chronic disease management.
Key Trend & Opportunity
Growth of Technologically Advanced Rehabilitation Solutions
The market benefits from growing adoption of digital therapy tools, AI-based assessments, and connected rehabilitation systems. Wearable sensors, motion-tracking devices, and virtual therapy platforms enhance treatment accuracy, patient engagement, and real-time monitoring. Clinics use data-driven tools to track progress and personalize treatment plans. Robotic-assisted therapy and smart exercise equipment improve outcomes in complex neurological and orthopedic cases. Home-based digital rehabilitation also expands as patients seek convenient, cost-effective therapy. These innovations create new opportunities for device manufacturers, software providers, and remote care platforms.
- For instance, ReWalk Robotics advanced its ReWalk Personal 6.0 exoskeleton, which supports assisted walking with a top speed of 0.71 meters per second. The system uses powered hip and knee joints controlled through onboard tilt sensors.
Expansion of Home-Based and Tele-Rehabilitation Models
Home-based rehabilitation grows rapidly due to rising demand for remote care, reduced hospital visits, and cost-efficient treatment. Tele-rehabilitation platforms support video consultations, digital exercise programs, and progress tracking, making therapy accessible to rural and underserved populations. Patients recovering from surgeries or managing chronic pain prefer home-based models for convenience. Providers invest in hybrid care pathways that blend in-clinic therapy with remote monitoring. This shift improves continuity of care and supports long-term rehabilitation adherence. The trend opens new opportunities for digital platforms, wearable technology vendors, and home-care service providers.
- For instance, Hinge Health strengthened its digital MSK platform using wearable motion sensors that record joint movement at up to 200 samples per second. The system integrates real-time feedback into home exercise sessions to increase engagement.
Key Challenge
Shortage of Skilled Physical Therapists
A persistent shortage of trained physiotherapists limits the market’s ability to meet rising demand. Many regions face gaps in therapist-to-patient ratios, leading to longer waiting times and reduced access to specialized care. High workloads and burnout among therapists further strain service delivery. Smaller clinics struggle with recruitment and retention due to limited budgets. The shortage impacts the expansion of advanced rehabilitation programs, particularly in rural and emerging markets. Healthcare systems must invest in training, education, and workforce development to address this constraint and ensure scalable rehabilitation services.
High Cost of Advanced Equipment and Therapy Sessions
The high cost of modern rehabilitation equipment and therapy sessions presents a major barrier for both providers and patients. Advanced tools such as robotic systems, electrotherapy devices, and digital platforms require significant capital investment. Many patients also face financial constraints due to limited insurance coverage for long-term therapy. These factors restrict adoption of innovative treatment options, particularly in low-income regions. Clinics may delay equipment upgrades, affecting treatment quality. Cost pressures slow the transition toward advanced rehabilitation models unless supported by better reimbursement policies and affordable technology solutions.
Regional Analysis
North America
North America leads the Physical Therapy Rehabilitation market with a 39% market share, supported by strong healthcare infrastructure, high adoption of advanced rehabilitation technologies, and a large patient base suffering from chronic pain and orthopedic conditions. The region benefits from high insurance coverage for therapy services and strong integration of outpatient and home-based rehabilitation models. Rising sports injuries and an aging population further increase therapy demand. Investment in robotic rehabilitation, AI-assisted therapy systems, and digital monitoring platforms strengthens growth. Expanding tele-rehabilitation adoption across the U.S. and Canada continues to enhance accessibility and market penetration.
Europe
Europe holds a 28% market share, driven by rising focus on preventive care, improved reimbursement policies, and strong demand for rehabilitation services among elderly populations. Germany, the U.K., and France lead due to well-established physiotherapy networks and advanced clinical standards. The region experiences growing adoption of exercise therapy, electrotherapy, and digital rehabilitation tools for neurological and musculoskeletal recovery. Increased investment in post-surgical rehabilitation programs and expansion of specialized physiotherapy centers support market growth. The surge in chronic pain cases and government initiatives promoting physical therapy further strengthen regional development.
Asia Pacific
Asia Pacific accounts for a 23% market share, expanding rapidly due to growing healthcare investments, rising orthopedic injury cases, and increasing awareness of rehabilitation services. China, Japan, India, and South Korea drive demand with large population bases and rising chronic disease incidence. Improved access to physiotherapy clinics and growing insurance coverage support adoption across urban areas. The region sees rising interest in home-based rehabilitation and digital platforms due to affordability and accessibility. Expanding medical tourism in countries such as India and Thailand also strengthens the use of physical therapy in post-operative recovery.
Latin America
Latin America holds a 6% market share, driven by rising demand for physical therapy in managing chronic pain, sports injuries, and post-surgical recovery. Brazil, Mexico, and Argentina lead adoption due to expanding private healthcare facilities and growing awareness of physiotherapy benefits. Investment in outpatient rehabilitation centers and training programs for therapists supports market growth. Economic constraints limit access to advanced equipment, but demand for basic exercise therapy and manual rehabilitation remains strong. The region also sees gradual adoption of digital rehabilitation tools, especially in urban centers seeking cost-effective therapy options.
Middle East & Africa
The Middle East & Africa region accounts for a 4% market share, supported by rising investment in healthcare infrastructure and growing cases of orthopedic injuries, chronic pain, and post-surgical mobility issues. Gulf countries, including the UAE and Saudi Arabia, lead adoption with advanced rehabilitation centers and strong demand for premium therapy services. Africa experiences slower growth due to limited access, but urban areas show rising interest in physiotherapy for injury recovery and pain management. Increased focus on sports rehabilitation, geriatric care, and private-sector expansion supports steady progress across the region.
Market Segmentations:
By Therapy Type
- Orthopedic Physical Therapy
- Neurological Physical Therapy
- Geriatric Physical Therapy
- Others
By Application
- Chronic Pain Management
- Post-Surgical Rehabilitation
- Orthopedic Injury Treatment
- Others
By Equipment Type
- Therapeutic Exercise Equipment
- Electrotherapy Equipment
- Thermal Therapy Equipment
- Others
By End-Use
- Hospitals
- Physiotherapy Clinics
- Home Care Settings
- Others
By Geography
- North America
- Europe
- Germany
- France
- U.K.
- Italy
- Spain
- Rest of Europe
- Asia Pacific
- China
- Japan
- India
- South Korea
- South-east Asia
- Rest of Asia Pacific
- Latin America
- Brazil
- Argentina
- Rest of Latin America
- Middle East & Africa
- GCC Countries
- South Africa
- Rest of the Middle East and Africa
Competitive Landscape
The Physical Therapy Rehabilitation market features strong competition among major players such as Select Medical Holdings Corporation, Upstream Rehabilitation, Athletico Physical Therapy, ATI Physical Therapy, U.S. Physical Therapy, BTL Industries, Enovis, Zimmer Biomet, Performance Health, and Medline Industries. These companies strengthen their presence by expanding clinic networks, investing in advanced rehabilitation technologies, and enhancing service quality. Providers focus on integrating digital tools, including tele-rehabilitation platforms, wearable monitoring systems, and AI-supported assessment software, to improve patient outcomes and streamline care delivery. Equipment manufacturers develop upgraded exercise systems, electrotherapy devices, and connected rehabilitation solutions to meet rising demand for personalized therapy. Strategic partnerships with hospitals, sports organizations, and outpatient centers support broader adoption of specialized rehabilitation programs. Companies also invest in training programs for therapists to ensure consistent service standards across facilities. Growing emphasis on post-surgical recovery, chronic pain management, and home-based therapy continues to shape competitive strategies across global markets.
Shape Your Report to Specific Countries or Regions & Enjoy 30% Off!
Key Player Analysis
- Select Medical Holdings Corporation
- Upstream Rehabilitation
- Athletico Physical Therapy
- ATI Physical Therapy
- S. Physical Therapy, Inc.
- BTL Industries
- Enovis (DJO Global)
- Zimmer Biomet
- Performance Health
- Medline Industries
Recent Developments
- In October 2025, Zimmer Biomet highlighted robotics & musculoskeletal product innovations at the 2025 AAHKS Annual Meeting, including its recently acquired robotic technology.
- In April 2025, U.S. Physical Therapy, Inc. announced the acquisition of an outpatient home-care physical and speech therapy practice.
- In August 2024, Athletico Physical Therapy was recognised by Centers for Medicare & Medicaid Services (CMS) for exceptional performance in the MIPS programme.
Report Coverage
The research report offers an in-depth analysis based on Therapy Type, Application, Equipment Type, End-Use and Geography. It details leading market players, providing an overview of their business, product offerings, investments, revenue streams, and key applications. Additionally, the report includes insights into the competitive environment, SWOT analysis, current market trends, as well as the primary drivers and constraints. Furthermore, it discusses various factors that have driven market expansion in recent years. The report also explores market dynamics, regulatory scenarios, and technological advancements that are shaping the industry. It assesses the impact of external factors and global economic changes on market growth. Lastly, it provides strategic recommendations for new entrants and established companies to navigate the complexities of the market.
Future Outlook
- Demand for rehabilitation services will rise as chronic pain and mobility disorders increase worldwide.
- Digital and home-based therapy models will expand as patients seek convenient recovery options.
- Clinics will adopt more wearable sensors and AI tools to track patient progress in real time.
- Robotic-assisted therapy systems will gain wider use for complex neurological and orthopedic rehabilitation.
- Post-surgical rehabilitation demand will grow as knee, hip, and spine procedures continue to increase.
- Geriatric-focused therapy programs will strengthen due to a rapidly aging global population.
- Tele-rehabilitation platforms will play a larger role in extending care to rural and underserved regions.
- Rehabilitation centers will invest more in advanced exercise systems to support personalized treatment plans.
- Strategic partnerships between hospitals, sports organizations, and clinics will enhance specialized therapy services.
- Global expansion of outpatient physiotherapy networks will improve accessibility and accelerate long-term market growth.


