
Arc Flash Protection Market Overview:
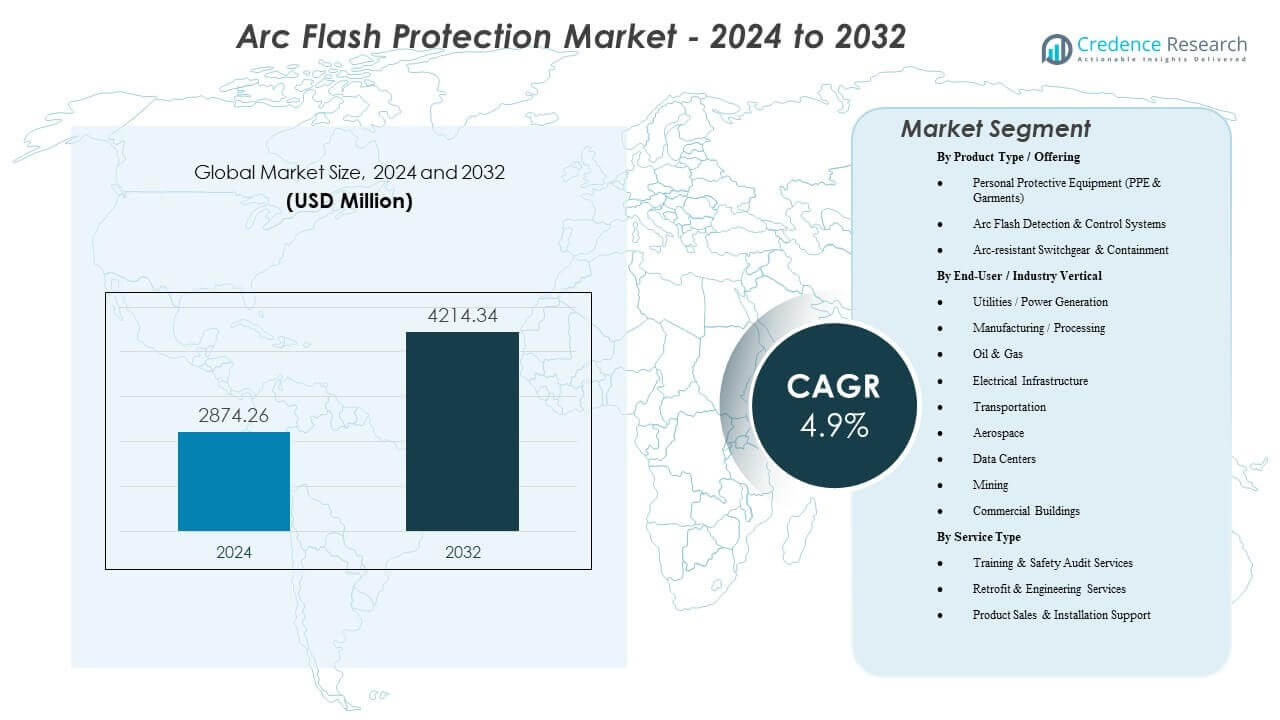
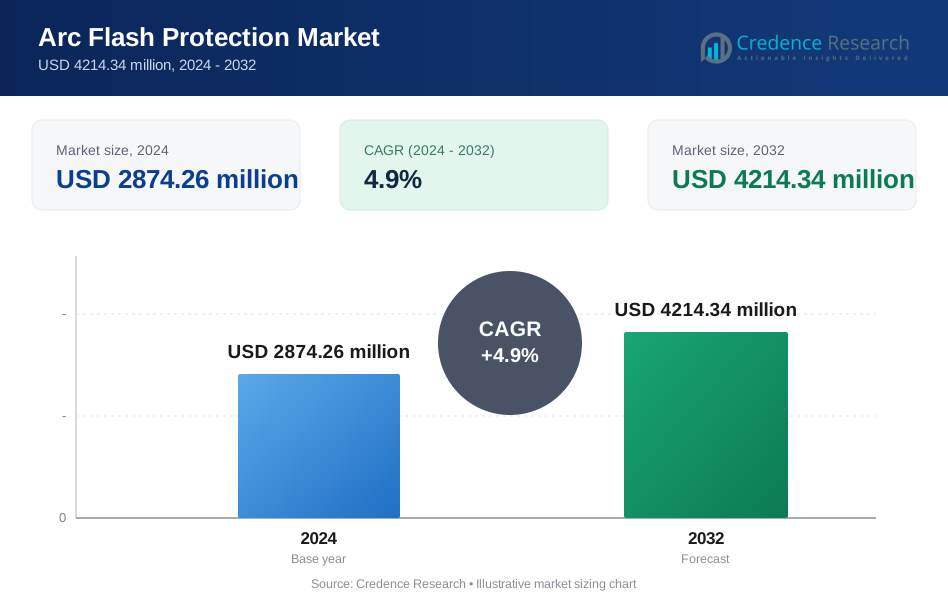
The Arc Flash Protection Market is projected to grow from USD 2874.26 million in 2024 to an estimated USD 4214.34 million by 2032, with a compound annual growth rate (CAGR) of 4.9% from 2024 to 2032.
| REPORT ATTRIBUTE | DETAILS |
|---|---|
| Historical Period | 2020-2023 |
| Base Year | 2024 |
| Forecast Period | 2025-2032 |
| Arc Flash Protection Market Size 2024 | USD 2874.26 million |
| Arc Flash Protection Market, CAGR | 4.9% |
| Arc Flash Protection Market Size 2032 | USD 4214.34 million |
Market drivers include increased investment in electrical infrastructure upgrades and the rising integration of automated equipment in manufacturing environments. Firms strengthen worker protection programs through advanced PPE, real-time sensors, and high-speed relays that minimize fault impact. Utility operators implement containment-tested switchgear to enhance grid resilience and operational continuity. Growing electrification across industries demands systems that manage higher load variability safely. The market also benefits from stronger adoption of digital monitoring platforms that support predictive maintenance and early hazard prevention.
North America leads the Arc Flash Protection Market due to strict safety regulations and rapid modernization of power systems across industrial and utility fleets. Europe follows with strong adherence to worker protection standards and widespread investment in upgraded electrical assets. Asia-Pacific emerges as the fastest-growing region driven by industrial expansion, infrastructure development, and increasing focus on risk mitigation in complex electrical environments. Latin America and the Middle East & Africa show rising adoption as utilities and industrial sites prioritize safer operational frameworks.
Arc Flash Protection Market Insights:
- The Arc Flash Protection Market is projected to grow from USD 2874.26 million in 2024 to USD 4214.34 million by 2032, registering a 4.9% CAGR during the forecast period.
- Strong enforcement of electrical safety standards and increased investment in modernizing infrastructure drive wider adoption of PPE, detection systems, and containment-tested switchgear.
- High installation costs and slow upgrade cycles in older industrial facilities create restraints, limiting faster deployment of advanced arc flash mitigation solutions.
- North America leads the market due to strict regulations and strong modernization activity, while Europe follows with consistent adherence to safety standards across industries.
- Asia-Pacific emerges as the fastest-growing region supported by industrial expansion, electrification projects, and rising focus on improving operational safety across manufacturing and utility sectors.
Arc Flash Protection Market Drivers
Rising Global Enforcement of Electrical Safety Regulations Across Industrial and Utility Environments
The Arc Flash Protection Market gains strong momentum from strict regulatory enforcement across high-risk sectors. Governments push companies to upgrade electrical safety programs that limit hazardous faults. Firms adopt PPE, monitoring tools, and arc-resistant systems to meet compliance demands. Safety audits push organizations to develop structured risk programs. Growth in electrified factories widens the need for reliable fault-control systems. Renewable integration expands grid complexity and raises the need for improved protection layers. It creates steady demand for standards-aligned products. Companies expand training initiatives to lower field risks linked with legacy equipment.
- For instance, Siemens 3WL air circuit breakers achieve clearing times below 50 ms, reducing incident energy during severe faults.
Growing Corporate Investments Toward Modernized Electrical Infrastructure and Asset Reliability Goals
Many industries invest in modern switchgear and digital protection devices that reduce hazards. The shift toward stable operations persuades firms to deploy faster detection systems. Digital substations support wider operational upgrade cycles. Rising maintenance costs push companies to install safer components. Companies deploy systems that shorten clearing time during faults. It supports steady market progress. Industries aim to protect staff from evolving electrical risks. Expanding utility networks widen investment in tested safety products.
Increased Adoption of Advanced Personal Protective Equipment With Improved Comfort and Performance Features
Manufacturers develop lighter suits, improved face shields, and flexible gloves for safer workplace operations. These solutions cut worker fatigue in demanding tasks. It encourages higher compliance in field teams working on energized systems. New materials offer strong thermal resistance with better breathability. Firms replace older gear with higher-performing models. Design improvements help workers maintain visibility in confined spaces. Demand rises for PPE that supports long maintenance cycles. Industries prefer equipment tested under updated arc standards.
Rising Grid Expansion Projects and Industrial Electrification Driving Demand for Fault-Mitigation Solutions
Rapid industrial growth expands the use of complex equipment that requires arc flash protection. Grid expansion introduces new switchyards, substations, and distribution assets. It raises the need for reliable protection systems across all phases of deployment. More factories deploy powered machinery that heightens exposure risks. Automation accelerates the need for improved electrical safeguards. Companies seek real-time fault detection for critical floors. Utilities adopt designs that contain high-energy faults within secure enclosures. Global electrification expands the market’s long-term pathway.
- For instance, Eaton Arc Quenching Magnum DS switchgear reduces incident energy by up to 95% using high-speed quenching chambers.
Market Trends
Acceleration of Smart Sensing Technologies and Real-Time Monitoring Tools in Electrical Safety Programs
The Arc Flash Protection Market experiences a strong shift toward smart sensors that detect faults early. Real-time alerts help teams respond faster in complex sites. Firms deploy solutions that monitor breakers and switchgear behavior. Many operations prefer continuous tracking for high-risk equipment. It strengthens predictive maintenance planning. AI-supported insights guide teams in scheduling essential repairs. Remote dashboards improve visibility across large facilities. Data-driven diagnostics improve preventive action.
- For instance, the Littelfuse PGR-8800 arc-flash relay delivers sub-1 ms detection for metal-clad compartments, helping reduce breaker reaction time.
Increasing Preference for Arc-Resistant Switchgear With Enhanced Containment and Isolation Features
Industries choose switchgear platforms that restrict high-energy faults within defined compartments. These designs reduce worker exposure during maintenance. Many firms retire older units that lack containment structures. It improves overall system reliability. Utilities focus on equipment that meets modern endurance standards. Large plants demand gear that handles severe internal faults. Growth in heavy industries supports steady switchgear upgrades. The trend accelerates adoption across greenfield projects.
- For instance, ABB SafeGear® HD is type-tested for 50 kA internal arc containment for one second, ensuring high resilience in critical installations.
Shift Toward Lightweight, Ergonomic, and Comfort-Driven PPE for Higher Workforce Compliance
Manufacturers upgrade suit fabrics to reduce heat stress in demanding electrical tasks. Many teams prefer headgear and shields with improved visibility. It helps workers manage long shifts safely. Suit ventilation improves comfort in warm regions. Firms choose PPE that supports mobility in tight areas. Gloves deliver higher dexterity for precision tasks. Rising workforce expectations shape product innovation. High-performing gear improves daily operational readiness.
Growth of Digital Substations and Integrated Protection Systems in Modern Grid Architecture
Smart substations gain wider adoption across utilities. These systems integrate fault detection, monitoring, and automated clearing functions. It streamlines protection workflows across distributed networks. Companies use digital solutions to coordinate fast responses. Unified systems reduce downtime linked with electrical failures. Grid modernization supports consistent adoption. High-density industrial hubs accelerate the trend. Digital layouts help utilities manage rising load pressures.
Arc Flash Protection Market Challenges Analysis
High Cost of Advanced Protection Systems and Limited Upgrade Budgets in Developing Regions
The Arc Flash Protection Market faces hurdles due to high acquisition and installation costs. Many firms delay upgrades due to capital strain. It affects adoption in utilities with constrained funding. Complex protective gear also requires regular replacement cycles. Firms struggle to justify large investments for older plants. Training requirements raise operational expenses. Procurement teams face pressure to balance safety with cost. Economies with slow industrial upgrades adopt solutions at a gradual pace.
Low Awareness Levels and Skill Gaps in Electrical Hazard Management Across Industrial Workforces
Many regions lack structured training programs for electrical safety. Teams depend on outdated procedures that limit protection quality. It delays adoption of modern fault-mitigation systems. Firms struggle to build skilled teams that follow updated standards. Limited awareness raises risks in high-energy sites. Workforce turnover complicates long-term training efforts. It restricts effective implementation of new protection tools. Industries with rapid expansion face higher challenges in maintaining uniform safety protocols.
Market Opportunities
Rising Global Focus on Electrification, Renewable Integration, and Grid Automation Creating Large Adoption Windows
The Arc Flash Protection Market gains opportunities from large electrification programs across industries. Renewable plants require robust protection layers. It creates scope for new switchgear, PPE, and detection tools. Many utilities expand smart grid investments to address load fluctuations. Infrastructure spending opens steady demand cycles. Companies seek integrated and responsive protection platforms. Growth across heavy industries pushes upgrades. Regions planning new industrial corridors increase long-term opportunities.
Advances in Material Science, IoT-Driven Diagnostics, and Predictive Maintenance Platforms Expanding Product Potential
Manufacturers integrate advanced materials that improve heat resistance and comfort. IoT tools enhance equipment visibility across networks. It supports maintenance teams in identifying early hazards. Predictive software enables risk scoring in complex environments. Firms benefit from improved planning accuracy. Skilled teams deploy advanced gear with better outcomes. Digital tools improve operational continuity. New innovations widen adoption across emerging sectors.
Arc Flash Protection Market Segmentation Analysis:
By Product Type / Offering
Personal protective equipment holds a strong share in the Arc Flash Protection Market due to its direct role in worker safety across energized environments. Arc-rated suits, hoods, gloves, and balaclavas support frontline tasks that require durable thermal resistance and comfort. Warning equipment helps teams maintain awareness in complex electrical zones. It remains a core purchase category for utilities, manufacturing plants, and service contractors. Detection and control systems gain traction through sensors, relays, and automated control units that limit incident energy. These systems support predictive fault management. Arc-resistant switchgear and containment solutions expand adoption in high-load facilities that require enclosed protection structures.
- For instance, Honeywell’s Salisbury Pro-Wear® Plus suits use lightweight AR fabrics that reduce suit weight by up to 20% while maintaining 40–65 cal/cm² arc ratings.
By End-User / Industry Vertical
Utilities and power generation lead the Arc Flash Protection Market due to ongoing modernization of transmission and distribution assets. Manufacturing and processing industries invest heavily in PPE and detection systems to maintain workflow stability. Oil and gas facilities prioritize high-strength containment and real-time monitoring to limit risks during electrical operations. Electrical infrastructure projects use integrated protection tools for safer grid expansion. It gains further demand across transportation, aerospace, and data centers that operate sensitive systems. Mining sites adopt rugged gear for hazardous locations. Commercial buildings deploy basic PPE and detection units to meet compliance needs.
- For instance, PPE used in oil and gas settings is certified for temperature swings from –40°C to 55°C, suited for extreme field operations.
By Service Type
Training and safety audit services support steady growth in the Arc Flash Protection Market by strengthening workforce readiness. Companies depend on structured programs to improve awareness and operational discipline. Retrofit and engineering services gain demand from aging infrastructure that requires safety upgrades. These services help align older systems with modern operational standards. Product sales and installation support remain essential for organizations that plan systematic adoption of PPE, detection devices, and switchgear. It enables firms to deploy tested solutions that improve protection at critical nodes.
Segmentation:
By Product Type / Offering
- Personal Protective Equipment (PPE & Garments)
- Arc-rated Suits
- Hoods and Face Shields
- Gloves
- Balaclavas
- Warning Equipment
- Arc Flash Detection & Control Systems
- Sensors
- Relays
- Control Systems
- Arc-resistant Switchgear & Containment
By End-User / Industry Vertical
- Utilities / Power Generation
- Manufacturing / Processing
- Oil & Gas
- Electrical Infrastructure
- Transportation
- Aerospace
- Data Centers
- Mining
- Commercial Buildings
By Service Type
- Training & Safety Audit Services
- Retrofit & Engineering Services
- Product Sales & Installation Support
By Region
- North America
- U.S.
- Canada
- Mexico
- Europe
- Germany
- France
- U.K.
- Italy
- Spain
- Rest of Europe
- Asia Pacific
- China
- Japan
- India
- South Korea
- South-east Asia
- Rest of Asia Pacific
- Latin America
- Brazil
- Argentina
- Rest of Latin America
- Middle East & Africa
- GCC Countries
- South Africa
- Rest of the Middle East and Africa
Regional Analysis:
North America holds the largest share of the Arc Flash Protection Market, accounting for roughly 35–38% of global demand due to strict electrical safety mandates and strong adoption across utilities and industrial plants. The region benefits from advanced grid modernization programs that drive investment in PPE, detection systems, and arc-resistant switchgear. It maintains high enforcement of NFPA and OSHA standards, which supports consistent product upgrades. Strong participation from leading manufacturers improves technology availability. Service providers gain steady traction through training programs. The region continues to expand protective infrastructure across new renewable projects.
Europe represents about 28–30% of the Arc Flash Protection Market, driven by regulatory alignment with worker safety protocols across industrial and commercial sectors. Countries with advanced manufacturing clusters deploy structured risk mitigation programs that support wider PPE adoption. It gains further traction from active investments in smart grid and substation upgrades. Energy transition plans in major EU economies strengthen the need for high-performance switchgear. Utility companies deploy advanced detection relays to maintain network stability. Strong compliance culture supports steady long-term growth.
Asia-Pacific accounts for roughly 24–26% of global share and shows the fastest expansion due to rapid industrial growth and expanding power networks. Large-scale construction of transmission and distribution systems drives broad adoption of control systems and PPE. It benefits from government-led modernization efforts across China, India, and Southeast Asia. Manufacturing hubs invest in structured safety programs to manage rising electrical loads. Multinational companies expand presence to support local supply chains. Latin America and the Middle East & Africa hold a combined 8–10% share, with growth supported by energy diversification and new industrial corridors.
Key Player Analysis:
- Schneider Electric SE
- ABB Ltd
- Siemens AG
- Eaton Corporation plc
- Honeywell International Inc.
- DuPont de Nemours, Inc.
- Littelfuse, Inc.
- Hubbell Incorporated
- Arcteq Relays Ltd
- SEL (Schweitzer Engineering Laboratories)
- MSA Safety Incorporated
- General Electric Company
Competitive Analysis:
The Arc Flash Protection Market features a strong mix of global electrical equipment manufacturers and specialist PPE suppliers that compete through product innovation and regulatory compliance strength. Leading companies invest in lightweight suits, advanced relays, and containment technologies that improve workplace safety. It encourages firms to differentiate through integrated platforms that combine detection, monitoring, and protection capabilities. Companies such as PPE suppliers rely on material innovation to improve comfort and durability. Electrical system manufacturers focus on digital enhancements that support predictive fault control. Service providers expand training and audit offerings to strengthen customer retention. Competitive intensity remains high due to rising safety requirements across utilities, industrial plants, and infrastructure projects. Firms maintain active partnerships with end users to support long-term operational safety goals.
Recent Developments:
- In February 2026, ABB strengthened its electrical engineering advisory capabilities through the acquisition of Premium Power in Europe expanding services including arc flash studies and grid compliance.
- In August 2024, Schneider Electric launched the MasterPacT MTZ Active circuit breaker featuring a native Energy Reduction Maintenance Setting to lower arc flash risks during maintenance by enabling faster fault clearance and enhancing personnel safety.
- In June 2024, Paulson Manufacturing released new toric arc flash face shields these shields have a curved design for better optical clarity and comfort while maintaining protection against electrical hazards.
- In May 2024, National Safety Apparel was acquired by Blue Point Capital Partners. This strategic acquisition provides the company with capital and resources to expand its arc flash and flame-resistant PPE portfolio through new product development and further acquisitions.
Report Coverage:
The research report offers an in-depth analysis based on Product Type / Offering, End-User / Industry Vertical, Service Type and Region. It details leading market players, providing an overview of their business, product offerings, investments, revenue streams, and key applications. Additionally, the report includes insights into the competitive environment, SWOT analysis, current market trends, as well as the primary drivers and constraints. Furthermore, it discusses various factors that have driven market expansion in recent years. The report also explores market dynamics, regulatory scenarios, and technological advancements that are shaping the industry. It assesses the impact of external factors and global economic changes on market growth. Lastly, it provides strategic recommendations for new entrants and established companies to navigate the complexities of the market.
Future Outlook:
- Growing industrial expansion will support wider adoption of protective gear and detection systems across complex electrical environments.
- Rising focus on grid modernization will strengthen demand for advanced relays, sensors, and containment technologies.
- Companies will prioritize lighter, ergonomic PPE that improves comfort and compliance among field teams.
- Digital substation growth will support integrated protection platforms that improve hazard detection.
- Utilities will upgrade legacy equipment to align with stricter safety rules and operational risk targets.
- Service-based offerings will gain traction as firms invest in structured training and engineering support.
- Integration of predictive diagnostic tools will enhance maintenance planning and reduce downtime.
- Expanding renewable installations will require reliable protective systems across new energy corridors.
- Manufacturing hubs will accelerate investment in high-performance detection units for operational continuity.
- Product innovation will remain strong as companies refine materials, improve switching systems, and expand global reach.
Request a Free Sample
Fill in your details and we'll send you a free sample report.
- Sample data tables & charts
- Research methodology
Need a Custom Version of This Report?
Tailor the scope, geography, or segments to your exact requirements.
- Custom geography or segment scope
- Direct access to our analyst team
Frequently Asked Questions
What is the current market size for the Arc Flash Protection Market, and what is its projected size in 2032?
At what Compound Annual Growth Rate is the Arc Flash Protection Market projected to grow between 2024 and 2032?
Which Arc Flash Protection Market segment held the largest share in 2024?
What are the primary factors fueling the growth of the Arc Flash Protection Market?
Who are the leading companies in the Arc Flash Protection Market?
Which region commanded the largest share of the Arc Flash Protection Market in 2024?
Table of Content
Chapter 1. Report Introduction
- 1.1 Report Description & Purpose
- 1.1.1 Report Title & Market Definition
- 1.1.2 Unique Selling Propositions (USP) & Key Differentiators
- 1.1.3 Value Proposition for Stakeholders
- 1.2 Research Objectives
- 1.2.1 Market Sizing Objectives (Volume & Revenue)
- 1.2.2 Segmentation Objectives
- 1.2.3 Competitive Intelligence Objectives
- 1.2.4 Forecast & Scenario Objectives
- 1.3 Report Scope
- 1.3.1 Arc Flash Protection Scope – Types & Subtypes Covered
- 1.3.2 Geographic Scope – Regions & Countries Covered
- 1.3.3 Historical Period, Base Year & Forecast Period (2024; forecast to 2032)
- 1.3.4 Inclusions & Exclusions
- 1.4 HS Code & Classification Framework
- 1.5 Currency, Units & Pricing Basis
- 1.6 Target Stakeholders
- 1.7 Limitations & Assumptions
Chapter 2. Executive Summary
- 2.1 Global Arc Flash Protection Market Snapshot
- 2.1.1 Market Size – Historical (2024) & Forecast (2024-2032) (2024: USD 2874.26 million → 2032: USD 4214.34 million)
- 2.1.2 Volume & Revenue – Global Totals
- 2.1.3 Key Market Highlights – Top Five Facts
- 2.2 Arc Flash Protection Market Segmentation Snapshot
- 2.2.1 Market Split by Region – 2024 vs. 2032
- 2.3 Competitive Snapshot
- 2.3.1 Top 10 Players by Revenue Share – 2024
- 2.3.2 Top 10 Players by Volume Share – 2024
- 2.3.3 Recent Strategic Developments (18-Month Summary)
- 2.4 Key Investment Highlights & Strategic Conclusions
Chapter 3. Arc Flash Protection Market Dynamics & Industry Analysis
- 3.1 Market Overview & Context
- 3.1.1 Arc Flash Protection Market Position in the Broader Automotive Value Chain
- 3.1.2 OEM vs. Replacement Market Dynamics
- 3.1.3 Market Maturity & Development Stage by Region
- 3.2 Arc Flash Protection Market Drivers
- 3.3 Arc Flash Protection Market Restraints & Challenges
- 3.4 Arc Flash Protection Market Opportunities
- 3.5 Porter's Five Forces Analysis
- 3.5.1 Threat of New Entrants
- 3.5.2 Bargaining Power of Suppliers
- 3.5.3 Bargaining Power of Buyers
- 3.5.4 Threat of Substitutes
- 3.5.5 Competitive Rivalry – Intensity Assessment
- 3.6 Arc Flash Protection Value Chain Analysis
- 3.6.1 Upstream – Raw Material/Input Suppliers
- 3.6.1.1 Raw Material/Input 1
- 3.6.1.2 Raw Material/Input 2
- 3.6.1.3 Raw Material/Input 3
- 3.6.2 Midstream – Production/Manufacturing/Service Delivery
- 3.6.2.1 Production/Process Overview
- 3.6.2.2 Key Facility Locations & Capacity by Manufacturer
- 3.6.3 Downstream – Distribution & End Consumer
- 3.6.3.1 Primary Channel – B2B/OEM
- 3.6.3.2 Secondary Channels – Dealer, Retail, Online, Direct
- 3.6.4 Value Chain Profitability Analysis
- 3.6.1 Upstream – Raw Material/Input Suppliers
- 3.7 PESTEL Analysis
- 3.7.1 Political Factors
- 3.7.2 Economic Factors
- 3.7.3 Social Factors
- 3.7.4 Technological Factors
- 3.7.5 Environmental Factors
- 3.7.6 Legal Factors
- 3.8 Arc Flash Protection Supply Chain Analysis
- 3.8.1 Raw Material/Input Supply Risk Assessment
- 3.8.2 Manufacturing Concentration Risk (Geographic Exposure)
- 3.8.3 Trade Disruption Impact Analysis
- 3.9 Regulatory & Policy Landscape
Note: The regulatory and policy landscape section covers regulations based on their applicability to the market, Arc Flash Protection category, geography, and scope of the study. Only regulatory frameworks with a material impact on operations, compliance, trade, sustainability, or market access are analyzed in detail.
Chapter 4. Key Investment Pockets & Opportunity Analysis
- 4.1 Arc Flash Protection Market Attractiveness Analysis
- 4.1.1 By Region – Investment Attractiveness Matrix (Volume × CAGR)
- 4.2 Absolute Revenue Growth Opportunity
- 4.2.1 By Region – Absolute USD Growth Through 2032
- 4.3 Incremental Volume Opportunity
- 4.3.1 By Region – Incremental Volume Through 2032
- 4.3.2 Segment – Incremental Volume
- 4.4 Emerging Submarket Opportunity Deep Dive (Subject to Applicability)
- 4.5 Emerging Market Opportunity Scorecards
- 4.5.1 United States
- 4.5.2 Europe
- 4.5.3 Asia
- 4.5.4 Middle East & Africa
Note: Emerging Market Opportunity Scorecards will be included based on relevance and strategic importance. Regions listed are indicative and may vary depending on data availability and market dynamics.
Chapter 5. Arc Flash Protection Import-Export Analysis & Trade Flows
- 5.1 Global Trade Overview
- 5.1.1 Global Export Value by Country (2024)
- 5.1.2 Global Export Volume by Country (2024)
- 5.1.3 Global Import Value by Country (2024)
- 5.1.4 Global Import Volume by Country (2024)
- 5.1.5 Net Trade Balance by Country (2024)
- 5.2 Export Analysis – Segment
- 5.2.1 Type 1 (HS Code)
- 5.2.2 Type 2 (HS Code)
- 5.2.3 Type 3 (HS Code)
- 5.2.4 Type 4 (HS Code)
- 5.2.5 Type 5 (HS Code)
- 5.3 Import Analysis – Segment
- 5.3.1 Type 1 (HS Code)
- 5.3.2 Type 2 (HS Code)
- 5.3.3 Type 3 (HS Code)
- 5.3.4 Type 4 (HS Code)
- 5.3.5 Type 5 (HS Code)
- 5.4 Average Unit Trade Prices
- 5.4.1 Average Export Price – Segment & Country
- 5.4.2 Average Import Price – Segment & Source Country
- 5.4.3 Price Trends (2024)
- 5.5 Key Trade Route Analysis
- 5.5.1 Trade Route 1
- 5.5.2 Trade Route 2
- 5.5.3 Trade Route 3
- 5.5.4 Trade Route 4
- 5.5.5 Trade Route 5
- 5.6 Trade Policy Impact Assessment
- 5.6.1 US Anti-Dumping & Section 301 Tariffs
- 5.6.2 EU Customs Union Impact
- 5.6.3 Major Free Trade Agreements
- 5.6.4 USMCA Rules of Origin
Note: Trade policy analysis will be included only where relevant to the Arc Flash Protection market.
Chapter 6. Competitive Landscape & Company Benchmarking
- 6.1 Arc Flash Protection Market Concentration & Structure
- 6.1.1 Herfindahl-Hirschman Index (HHI) – vs. 2024
- 6.1.2 Tier 1, Tier 2 & Tier 3 Market Structure
- 6.1.3 Global, Regional & Local Player Dynamics
- 6.2 Arc Flash Protection Market Share Analysis – 2024
- 6.2.1 Global Revenue Share by Company
- 6.2.2 Global Volume Share by Company
- 6.2.3 Regional Revenue Share
- 6.2.4 Market Share Evolution ( vs. 2024)
- 6.2.5 OEM Segment Share by Company
- 6.2.6 Replacement Segment Share by Company
- 6.3 Production/Delivery Capacity & Facility Analysis
- 6.3.1 Global Installed Capacity
- 6.3.2 Capacity Utilization Rates
- 6.3.3 Production/Output Volume
- 6.3.4 Facility Locations & Capacity Map
- 6.3.5 Planned Capacity Additions
- 6.4 Arc Flash Protection Competitive Benchmarking Matrix
- 6.4.1 Revenue, Volume, CAGR & Profitability Comparison
- 6.4.2 Channel Revenue Mix
- 6.4.3 Geographic Revenue Exposure
- 6.4.4 R&D Intensity
- 6.4.5 Sustainability Maturity
- 6.5 Strategic Developments in Arc Flash Protection (Last 24 Months)
- 6.5.1 Mergers, Acquisitions & Divestments
- 6.5.2 New Arc Flash Protection Launches
- 6.5.3 Facility Expansions
- 6.5.4 Strategic Alliances, Joint Ventures & Partnerships
- 6.5.5 Distribution Expansion & Market Entry
- 6.5.6 Sustainability & ESG Initiatives
- 6.6 Competitive Strategy Mapping
- 6.6.1 Leader, Challenger, Follower & Niche Classification
- 6.6.2 Pricing Strategy Comparison
- 6.6.3 Channel Strategy Matrix
Note: Strategic developments are included based on their materiality and the availability of reliable information.
Chapter 7. Global Arc Flash Protection Market – By Distribution Channel
- 7.1 Segment Overview
- 7.1.1 Volume & Revenue Split by Channel (2024 & 2032)
- 7.1.2 Channel Mix Evolution (2024-2032)
Chapter 8. Regional Market Analysis – Global Overview
- 8.1 Global Regional Overview
- 8.1.1 Regional Volume Share
- 8.1.2 Regional Revenue Share
- 8.1.3 Regional Volume by Region
- 8.1.4 Regional Revenue by Region
- 8.1.5 Regional Forecast Through 2032
- 8.2 Cross-Regional Segment Analysis
- 8.2.1 By Distribution Channel
- 8.2.2 By Brand/Price Tier
Chapter 9. North America Arc Flash Protection Market
- 9.1 United States
- 9.2 Canada
- 9.3 Mexico
Chapter 10. Europe Arc Flash Protection Market
- 10.1 Germany
- 10.2 France
- 10.3 Italy
- 10.4 United Kingdom
- 10.5 Spain
- 10.6 Poland
- 10.7 Russia
- 10.8 Netherlands
- 10.9 Belgium
- 10.10 Sweden
- 10.11 Denmark
- 10.12 Norway
- 10.13 Rest of Europe
Chapter 11. Asia Pacific Arc Flash Protection Market
- 11.1 China
- 11.2 India
- 11.3 Japan
- 11.4 South Korea
- 11.5 Thailand
- 11.6 Indonesia
- 11.7 Vietnam
- 11.8 Malaysia
- 11.9 Australia
- 11.10 Rest of Asia Pacific
Chapter 12. Latin America Arc Flash Protection Market
- 12.1 Brazil
- 12.2 Argentina
- 12.3 Colombia
- 12.4 Chile
- 12.5 Rest of Latin America
Chapter 13. Middle East Arc Flash Protection Market
- 13.1 Saudi Arabia
- 13.2 United Arab Emirates
- 13.3 Turkey
- 13.4 Israel
- 13.5 Iran
- 13.6 Rest of the Middle East
Chapter 14. Africa Arc Flash Protection Market
- 14.1 South Africa
- 14.2 Egypt
- 14.3 Nigeria
- 14.4 Morocco
- 14.5 Rest of Africa
Chapter 15. Arc Flash Protection Company Profiles
- 15.1 [Company 01]
- 15.1.1 Company Overview
- 15.1.2 Key Management Personnel
- 15.1.3 Products & Services Portfolio
- 15.1.4 Financial Performance
- 15.1.5 Key Market Focus & Geographic Presence
- 15.1.6 Recent Developments & Strategic Initiatives
Note: The company profile list is preliminary and may change based on research findings, market developments, data availability, and client requirements.
Chapter 16. Appendices
- Appendix A – List of Abbreviations & Acronyms
- Appendix B – Industry Classification Code Reference – Full Series
- Appendix C – Production & Capacity Data Tables
- Appendix D – End-Use & Demand Base Tables
- Appendix E – Consumption & Replacement Rate Assumptions
- Appendix F – ASP Reference Tables
- Appendix G – Manufacturing & Facility Database
- Appendix H – Import-Export Data Tables
- Appendix I – Regulatory Summary Tables
- Appendix J – Primary Research Participant List (Anonymized)
- Appendix K – Primary Research Questionnaire Framework
- Appendix L – Data Sources & Bibliography
- Appendix M – Market Size Divergence & Source Comparison
Chapter 17. Research Methodology
- 17.1 Research Framework & Philosophy
- 17.2 Secondary Research – Sources, Hierarchy & Data Extraction
- 17.3 Data Modeling – Bottom-Up & Top-Down Market Sizing
- 17.4 Primary Research – Stakeholder Framework, LOI & Sample Sizes
- 17.5 Forecast Methodology – Regression, Scenario & Sensitivity Analysis
- 17.6 Quality Control – Four-Layer Validation Framework
- 17.7 Limitations & Standard Assumptions
- 17.8 Disclaimer
