Automated Demand Response Market Overview:
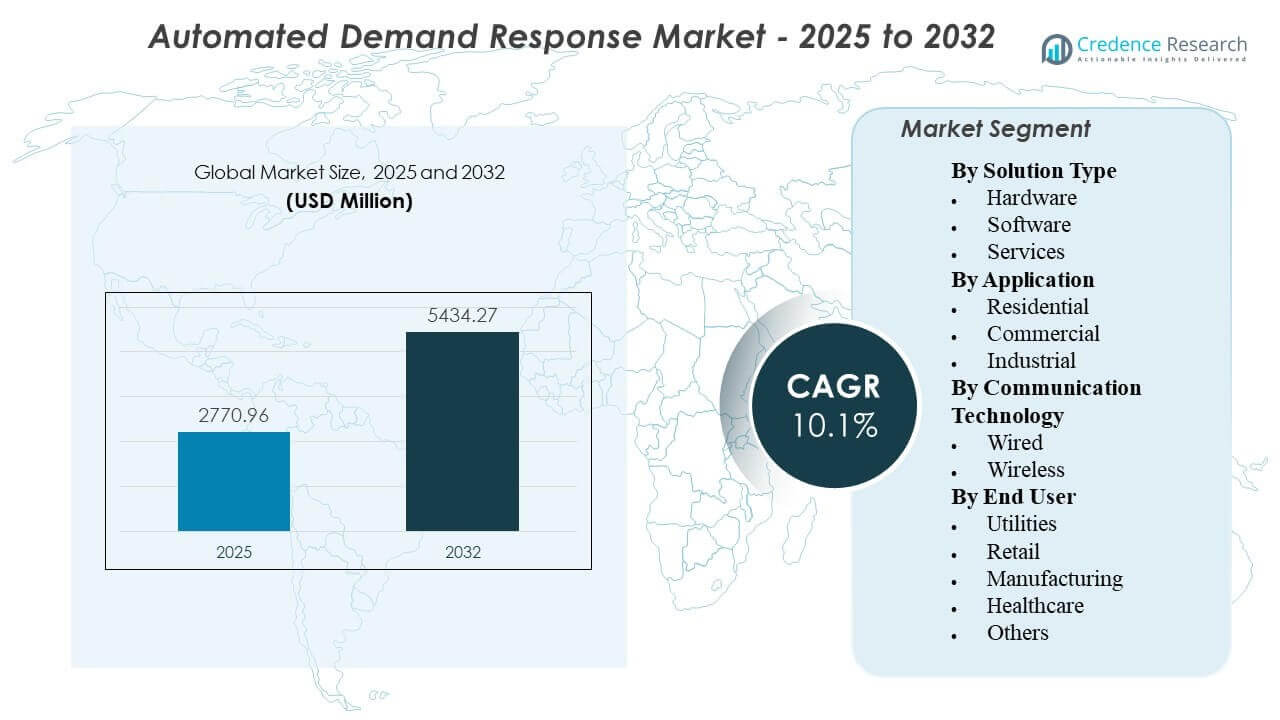
The global Automated Demand Response Market size was estimated at USD 2,770.96 million in 2025 and is expected to reach USD 5,434.27 million by 2032, growing at a CAGR of 10.1% from 2025 to 2032. Growth is driven by the accelerating need for utilities and large energy consumers to automate peak-load management and improve grid reliability through faster, repeatable response actions. Ongoing digitization of grid operations and wider deployment of connected building and industrial controls are strengthening participation and improving event performance across customer portfolios.
| REPORT ATTRIBUTE |
DETAILS |
| Historical Period |
2020-2024 |
| Base Year |
2025 |
| Forecast Period |
2026-2032 |
| Automated Demand Response Market Size 2025 |
USD 2,770.96 million |
| Automated Demand Response Market, CAGR |
10.1% |
| Automated Demand Response Market Size 2032 |
USD 5,434.27 million |
Key Market Trends & Insights
- The market was valued at USD 2,770.96 million in 2025, reflecting strong adoption momentum in utility-led and aggregator-enabled programs.
- The market is projected to reach USD 5,434.27 million by 2032, supported by scaling deployments across commercial and industrial customer bases.
- The market is expected to expand at a 10.1% CAGR, indicating sustained investment in automation-ready load flexibility.
- The forecast period 2025–2032 highlights multi-year program expansion cycles tied to grid modernization and connected device adoption.
- The base year 2025 and forecast year 2032 reflect a planning horizon aligned with utility capacity planning and demand-side flexibility procurement cycles.
Segment Analysis
Automated demand response adoption is expanding as utilities and large energy users shift from manual event participation to automation that improves predictability, reduces operational burden, and enables repeatable performance. Program operators increasingly prioritize end-to-end workflows that include asset onboarding, event dispatch, monitoring, and measurement frameworks, particularly for portfolios spanning multiple sites. Deployment economics improve when existing building or industrial control systems can be integrated with minimal retrofit complexity, supporting faster scaling in commercial facilities and select industrial loads.
Segment performance also reflects differences in controllability and risk tolerance across end users. Commercial buildings often provide high-frequency, low-disruption flexibility through HVAC, lighting, and refrigeration strategies, whereas industrial participation depends on process constraints and engineered curtailment pathways. Communication choices and solution design increasingly emphasize fast deployment, interoperability, and cybersecurity controls, with vendors differentiating through integration capability, reliability, and scalability across distributed assets.
Access crucial information at unmatched prices!
Request your sample report today & start making informed decisions powered by Credence Research Inc.!
Download Sample
By Solution Type Insights
Software is expected to lead adoption because automated demand response depends on orchestration capabilities such as event scheduling, dispatch logic, portfolio monitoring, and reporting workflows. Buyers prioritize platforms that can integrate with metering, grid operations tools, and on-site controls while supporting scalable onboarding across thousands of endpoints. As programs mature, software differentiation increasingly centers on interoperability, policy-based automation, and performance verification readiness. Services expand alongside software due to integration complexity, customer enablement needs, and continuous optimization requirements across multi-site portfolios.
By Application Insights
Commercial is expected to remain the leading application area because buildings offer controllable loads that can be automated with limited operational disruption and clear comfort constraints. Many commercial sites already operate building management systems, which reduces integration time and supports faster rollout across chains and portfolios. Industrial demand remains significant where flexibility can be engineered into non-critical loads, but adoption varies based on process sensitivity and site-specific design requirements. Residential participation grows where connected devices are widespread, although outcomes depend on device penetration and customer engagement consistency.
By Communication Technology Insights
Wireless is expected to lead because it enables rapid deployment across distributed, behind-the-meter assets without extensive rewiring, making it well suited for commercial chains and geographically dispersed portfolios. Wireless connectivity also supports faster retrofits and broader device compatibility where site conditions vary. Adoption priorities increasingly include cybersecurity posture, reliability, and network resilience in addition to install speed. Wired remains important in industrial settings and critical environments where deterministic performance and tightly controlled networks are preferred.
By End User Insights
Utilities are expected to be the leading end users because they design, procure, and operate most automated demand response programs and require portfolio-level visibility and control. Utilities also drive integration requirements with metering, settlement, and grid operations systems, influencing solution selection and vendor differentiation. Manufacturing adoption rises where energy cost exposure is high and sites can implement structured flexibility without impacting core processes. Healthcare participation tends to focus on non-clinical loads and prioritizes safety, redundancy, and strict operational constraints.
Automated Demand Response Market Drivers
Grid reliability needs and peak load management
Utilities are facing tighter capacity margins and more frequent peak events, increasing the value of dependable load flexibility. Automated demand response helps convert voluntary, manual response into repeatable event execution with lower operational friction. As peak management becomes a planning tool rather than a one-off action, program owners prioritize automation that can scale across thousands of endpoints. This driver is strongest where utilities require consistent performance and faster dispatch response during constrained grid conditions.
Expansion of connected devices and building/industrial controls
Wider deployment of smart thermostats, building management systems, and industrial control layers improves the addressable base for automated response. When control systems already exist, ADR can be implemented with fewer retrofits, accelerating program rollout and improving participation economics. Connected controls also enable more granular strategies such as staged curtailment, setpoint adjustments, and automated recovery logic. This increases achievable load reduction without significantly disrupting occupant comfort or critical processes.
- For instance, Enel X reported that Lineage’s Oxford Cold Storage facility in Australia doubled its cold storage capacity while keeping electricity use at 37 GWh per year, and the site can reduce demand by up to 3,250 kW for up to two hours during high-demand periods without affecting operations or product quality.
Rising energy cost volatility and operational cost optimization
Large commercial and industrial users increasingly look for tools that reduce peak demand charges and improve energy productivity. Automated programs reduce the need for manual intervention, lowering labor burden and improving consistency across multi-site operations. Participants also benefit from better visibility into event performance and baseline tracking, which supports internal energy governance. The resulting ROI narrative strengthens adoption, especially among customers managing multiple facilities or energy-intensive operations.
- For instance, Enel X documented that Kimberly-Clark’s Huntsville mill in Ontario, a 7 MW facility, was able to curtail 5.3 MW during a 4-hour dispatch, allowing the plant to align demand response with planned maintenance instead of relying on purely manual shutdown decisions.
Policy support and utility investment in demand-side flexibility
Many power markets are strengthening mechanisms that encourage demand-side participation to support system balancing and defer infrastructure upgrades. Utilities increasingly fund or co-fund enabling technologies to improve enrollment and performance, which accelerates adoption of automation-ready solutions. As demand-side flexibility becomes part of broader grid modernization agendas, ADR benefits from integration priorities across metering, distribution operations, and customer programs. This driver also supports longer-term platform procurement cycles that favor scalable software and services ecosystems.
Automated Demand Response Market Challenges
Automated demand response programs face integration complexity across heterogeneous sites, devices, and protocols, which can slow deployment timelines. Customers often operate mixed equipment generations, and achieving consistent control behavior requires site-specific engineering and testing. Cybersecurity and data governance requirements add further friction, particularly when remote dispatch touches critical operational systems. These factors increase implementation cost and can delay scale-up beyond early pilots.
Performance assurance remains another challenge because outcomes depend on baseline methodology, device responsiveness, and customer operational constraints during events. Industrial and healthcare participants often impose strict limits on what can be curtailed, reducing flexibility depth and requiring careful automation logic. Measurement and verification practices can vary by program, creating disputes over delivered value and settlement outcomes. As portfolios scale, maintaining consistent response quality across thousands of endpoints becomes a continuing operational burden.
- For instance, EnergyHub reported that it became the first DERMS provider to exceed 1 million distributed energy resources under management, with those resources delivering 1.35 GW of flexibility.
Automated Demand Response Market Trends and Opportunities
A key trend is the shift toward portfolio-based orchestration across multiple asset types, where ADR is coordinated alongside building controls, distributed energy resources, and emerging flexible loads. Program operators are standardizing onboarding and dispatch workflows to reduce per-site setup time and improve scalability. This trend creates opportunities for platforms that simplify device enrollment, automate control strategies, and provide strong monitoring visibility. Vendors that can demonstrate repeatable performance across large fleets are better positioned for utility-wide rollouts.
- For instance, AutoGrid states that its platform manages 8 GW of flexible resources across 40+ global energy customers, and in Tata Power’s program it supported 75 MW of peak capacity reduction within the first six months by engaging 55,000 residential customers and 6,000 large commercial and industrial customers.
Another trend is the growing focus on customer experience and operational simplicity, where automation must be easy to adopt and reliable in day-to-day operations. Solutions are increasingly designed to minimize disruption through configurable comfort/process guardrails and smarter event recovery strategies. This opens opportunities in commercial chains, multi-site retailers, and managed property portfolios that value standardized deployment models. Service-led delivery and long-term optimization support are becoming more important as program owners pursue sustained performance rather than one-time installations.
Regional Insights
North America
North America leads with an estimated 38.2% share in 2025 due to established demand response program structures, higher penetration of enabling grid and customer-side infrastructure, and mature commercial and industrial participation models. Utilities and aggregators in this region typically emphasize scalable automation, standardized onboarding, and operational reliability, which supports repeatable event execution across large portfolios. Commercial buildings remain a primary deployment base because automation can be implemented through existing building controls and centralized facilities management. The region’s vendor ecosystem and integration capability also support faster time-to-value for utility-led deployments.
Europe
Europe accounted for an estimated 22.7% share in 2025, supported by strong decarbonization agendas and increasing focus on flexibility as renewable penetration rises across power systems. Adoption often progresses through market-specific frameworks, with implementation shaped by country-level program design, regulatory structures, and grid operator requirements. Demand response participation is strengthened where commercial building stock and industrial clusters can deliver predictable flexibility without compromising operational continuity. Interoperability and cybersecurity considerations remain central as utilities integrate automation into broader smart-grid and flexibility strategies.
Asia Pacific
Asia Pacific captured an estimated 27.1% share in 2025, driven by rapid load growth in urban centers, expanding commercial infrastructure, and grid stress that increases the value of peak management and automated flexibility. Adoption is typically uneven across countries, with faster uptake in markets advancing smart grid deployments and connected building and industrial automation. Large commercial portfolios and energy-intensive industries provide scalable use cases where integration barriers can be managed through standardized rollout models. As utilities and regulators expand flexibility programs, solution providers benefit from increased demand for orchestration platforms and scalable device connectivity.
Latin America
Latin America represented an estimated 7.4% share in 2025, with adoption generally program- and project-led and momentum strongest where grid modernization and reliability needs encourage demand-side flexibility. Commercial and industrial participation can be meaningful in select markets, but scaling depends on policy clarity, utility investment cycles, and enabling infrastructure deployment. Solutions that minimize retrofit complexity and provide clear operational savings tend to gain traction faster. Partnerships and service-led models can be important to accelerate onboarding and improve performance outcomes in multi-site deployments.
Middle East & Africa
The Middle East & Africa held an estimated 4.6% share in 2025 and remains an emerging market, with adoption centered on modernization initiatives, large commercial users, and targeted efficiency programs. Demand response use cases often prioritize reliability, peak management, and operational resilience, particularly for high-load facilities and fast-growing urban developments. Deployment typically requires careful integration planning, cybersecurity controls, and operational safeguards, especially in critical facilities. Growth is expected to concentrate in markets with strong utility-led digitization roadmaps and expanding commercial infrastructure.
Competitive Landscape
Competition is shaped by the ability to deliver reliable automated event execution at scale, integrate with utility systems and customer-side controls, and support measurement and reporting requirements across diverse portfolios. Vendors differentiate through platform interoperability, device and protocol support, cybersecurity posture, and services that reduce deployment friction. As programs expand beyond pilots, buyers increasingly favor solutions that simplify onboarding, standardize workflows, and deliver consistent performance across multiple customer segments and site types.
Itron Inc. is positioned around grid-edge enablement where automation value increases when utilities can coordinate customer-side flexibility with broader distribution operations. The company’s approach typically aligns with utility procurement priorities that emphasize integration readiness, operational visibility, and scalability across large endpoint footprints. As automated demand response expands, capability to connect metering, grid operations, and customer-side controls becomes a practical differentiator for utility rollouts. This positioning supports deployments that require standardized onboarding and repeatable performance across heterogeneous customer portfolios.
The industry research and growth report includes detailed analyses of the competitive landscape of the market and information about key companies, including:
- Itron Inc.
- Hitachi, Ltd.
- Mitsubishi Electric Corporation
- Eaton Corporation plc
- General Electric Company
- ABB Ltd.
- Schneider Electric SE
- Siemens AG
- Honeywell International Inc.
- Enel S.p.A. / Enel X
- Johnson Controls, Inc.
- AutoGrid Systems, Inc.
Qualitative and quantitative analysis of companies has been conducted to help clients understand the wider business environment as well as the strengths and weaknesses of key industry players. Data is qualitatively analyzed to categorize companies as pure play, category-focused, industry-focused, and diversified; it is quantitatively analyzed to categorize companies as dominant, leading, strong, tentative, and weak.
Shape Your Report to Specific Countries or Regions & Enjoy 30% Off!
Recent Developments
- In February 2026, Tata Power partnered with AutoGrid to expand AI-enabled smart energy management in India, and the announcement said Tata Power’s new program built on the AutoGrid Flex platform would also add an automated demand response layer supported by its EZ Home smart plug platform.
- In December 2025, EnergyHub acquired Resideo’s Grid Services demand response business, a move aimed at expanding EnergyHub’s ability to help utilities manage connected devices such as thermostats, electric vehicles, and batteries through a single grid-edge DERMS platform.
- In July 2025, Constellation and GridBeyond launched an AI-powered demand response program in PJM, using GridBeyond’s predictive analytics platform to help business customers reduce electricity use during peak periods, lower costs, and improve grid flexibility.
Report Scope
| Report Attribute |
Details |
| Market size value in 2025 |
USD 2,770.96 million |
| Revenue forecast in 2032 |
USD 5,434.27 million |
| Growth rate (CAGR) |
10.1% (2025–2032) |
| Base year |
2025 |
| Forecast period |
2026–2032 |
| Quantitative units |
USD million |
| Segments covered |
By Solution Type Outlook: Hardware, Software, Services;
By Application Outlook: Residential, Commercial, Industrial;
By Communication Technology Outlook: Wired, Wireless;
By End User Outlook: Utilities, Retail, Manufacturing, Healthcare, Others |
| Regional scope |
North America, Europe, Asia Pacific, Latin America, Middle East & Africa |
| Key companies profiled |
Itron Inc.; Hitachi, Ltd.; Mitsubishi Electric Corporation; Eaton Corporation plc; General Electric Company; ABB Ltd.; Schneider Electric SE; Siemens AG; Honeywell International Inc.; Enel S.p.A. / Enel X; Johnson Controls, Inc.; AutoGrid Systems, Inc. |
| No. of Pages |
330 |
Segmentation
By Solution Type
- Hardware
- Software
- Services
By Application
- Residential
- Commercial
- Industrial
By Communication Technology
By End User
- Utilities
- Retail
- Manufacturing
- Healthcare
- Others
By Region
- North America
- Europe
- Germany
- France
- U.K.
- Italy
- Spain
- Rest of Europe
- Asia Pacific
- China
- Japan
- India
- South Korea
- South-east Asia
- Rest of Asia Pacific
- Latin America
- Brazil
- Argentina
- Rest of Latin America
- Middle East & Africa
- GCC Countries
- South Africa
- Rest of the Middle East and Africa


