
Battery Plate Market Overview:
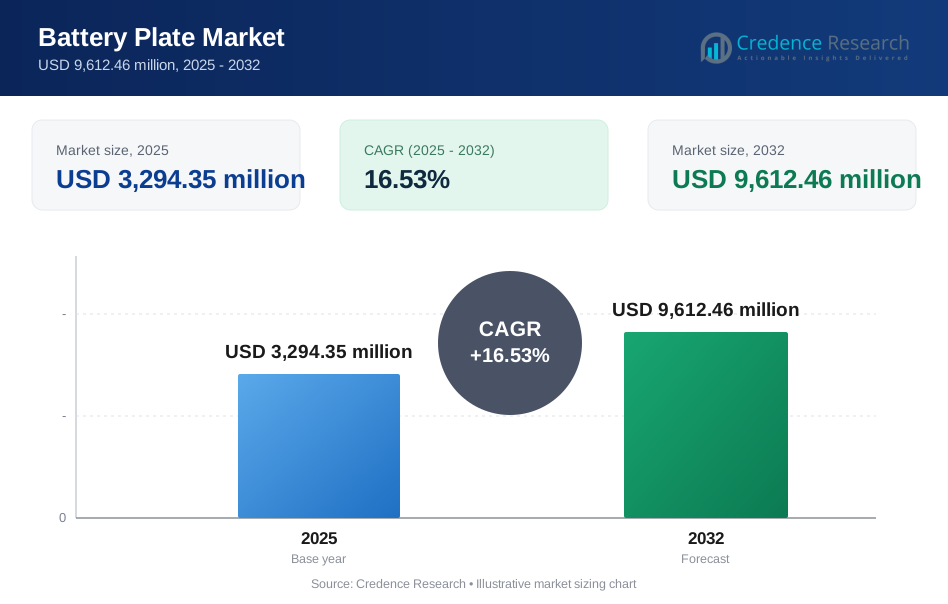
The global Battery Plate Market size was estimated at USD 3294.35 million in 2025 and is expected to reach USD 9612.46 million by 2032, growing at a CAGR of 16.53% from 2025 to 2032. Demand is primarily driven by sustained battery replacement cycles and expanding electrification, which increases throughput requirements for core battery components across multiple end-use environments. Asia Pacific remains the largest production and consumption hub supported by scaled manufacturing ecosystems and high-volume downstream battery demand.
| REPORT ATTRIBUTE | DETAILS |
|---|---|
| Historical Period | 2020-2024 |
| Base Year | 2025 |
| Forecast Period | 2026-2032 |
| Battery Plate Market Size 2025 | USD 3294.35 million |
| Battery Plate Market, CAGR | 16.53% |
| Battery Plate Market Size 2032 | USD 9612.46 million |
Key Market Trends & Insights
- Asia Pacific accounted for the largest regional share of 61.2% in 2025, reflecting concentration of battery manufacturing capacity and downstream demand centers.
- North America represented 16.9% share in 2025, supported by stable automotive replacement demand and growing energy storage deployments.
- Europe held 12.8% share in 2025, with demand shaped by industrial electrification programs and tightening performance expectations across applications.
- Lead-acid Batteries accounted for the largest share of 55.8% in 2025, supported by a large installed base and cost-optimized supply chains.
- Automotive accounted for the largest share of 51.6% in 2025, driven by ongoing SLI demand and increasing electrified vehicle penetration across fleets.

Segment Analysis
Battery plate demand is influenced by a mix of mature lead-acid supply chains and accelerating lithium-ion adoption across mobility and stationary storage. Cost-focused procurement continues to favor proven plate designs where reliability and throughput consistency matter most, especially in high-volume applications. At the same time, performance expectations are rising as batteries face higher cycling intensity and broader operating conditions in modern platforms. Manufacturing capability, recycling integration, and quality-control repeatability remain key differentiators that shape supplier selection.
End-use expansion in energy storage and electronics is increasing the importance of plate material choices and process improvements that support durability and consistent electrochemical performance. Buyer behavior increasingly emphasizes total cost of ownership, including cycle life, maintenance needs, and operating stability across temperature ranges. Supply relationships often depend on qualification time, proven defect-rate performance, and the ability to scale without quality degradation. This dynamic supports continued investment in production automation and material optimization for both established and emerging battery platforms.
By Battery Type Insights
Lead-acid Batteries accounted for the largest share of 55.8% in 2025. Lead-acid systems continue to benefit from established manufacturing depth and mature recycling pathways that stabilize input availability and pricing. High replacement frequency in traditional automotive and industrial backup applications supports predictable, recurring demand for lead-based plates. Supplier selection in this category is typically driven by reliability, throughput capacity, and consistent grid/plate geometry that supports standardized battery formats.
By Material / Plate Material Insights
Lead Alloy accounted for the largest share of 46.3% in 2025. Lead-alloy plate designs are widely adopted because alloying improves corrosion resistance and structural stability under repeated cycling. Alloy compositions help balance conductivity, mechanical strength, and service life requirements across common duty cycles. Adoption is further supported by manufacturing familiarity and established qualification standards that reduce switching risk for high-volume battery producers.
By End User / Application Insights
Automotive accounted for the largest share of 51.6% in 2025. Automotive demand remains anchored in large installed bases that require routine battery replacement and consistent supply of standardized components. OEM and aftermarket channels prefer suppliers that can deliver stable quality at scale, with dependable lead times and proven compliance performance. The segment also benefits from ongoing electrification trends that increase the importance of component reliability and platform-level performance consistency.
Battery Plate Market Drivers
Expansion of Electrification Across Mobility and Industrial Systems
Battery adoption continues to expand as mobility platforms electrify and industries increase reliance on battery-backed power continuity. Battery plate demand rises with increasing production volumes of batteries and replacement needs across deployed fleets. Higher utilization intensity in modern applications elevates performance expectations for core components and accelerates specification upgrades. This trend supports sustained investment in component manufacturing scale and process control.
- For instance, CATL’s Shenxing LFP battery is designed to deliver 400 km of driving range from a 10-minute charge and over 700 km on a full charge, showing how electrified platforms are pushing battery component suppliers toward tighter performance and manufacturing standards.
Large Installed Base and Predictable Replacement Cycles
Replacement-driven demand remains a key contributor, particularly in applications where battery systems are routinely serviced or swapped. Predictable maintenance intervals and lifecycle replacement create stable procurement volumes for plate manufacturers. Standardized battery formats in high-volume segments support repeat orders and sustained throughput requirements. The replacement cycle dynamic also encourages long-term supplier relationships anchored in reliability and quality performance.
Growth in Stationary Energy Storage Deployments
Energy storage adoption is increasing across grid support, renewable integration, and backup power use cases. Higher cycling requirements in these systems place emphasis on durability, consistency, and performance stability of battery components. This encourages material and process improvements that reduce degradation under repeated charge-discharge conditions. Storage expansion supports incremental demand across multiple battery types and plate material choices.
- For instance, BASF and NGK’s NAS MODEL L24 sodium-sulfur battery is reported to have a degradation rate of less than 1% per year, support 6 hours of continuous discharge at 200 kW per unit, and reduce project lifetime costs by about 20%, illustrating why long-duration storage deployments are intensifying demand for more durable battery materials and component designs.
Manufacturing Scale-Up and Process Optimization Investments
Producers are improving automation, quality control, and repeatability to meet tighter tolerances and reduce defect rates. Higher-volume battery production requires component suppliers that can scale without compromising consistency. Process improvements also enable better material utilization and improved performance outcomes at competitive cost targets. As procurement becomes more performance-linked, suppliers with advanced manufacturing capabilities gain stronger positioning.
Battery Plate Market Challenges
Supply chain volatility and input cost fluctuations can create uncertainty in component pricing and margins, especially when procurement contracts are structured around fixed pricing windows. Compliance expectations, environmental regulations, and safe handling requirements increase operational complexity for manufacturers and can raise the cost of capacity expansion. In addition, quality failures at the component level can trigger costly recalls or warranty exposure for downstream battery producers, making qualification cycles longer and more rigorous.
- For instance, ENTEK announced that its Indiana lithium-ion separator expansion is designed in Phase 1 to supply separators for 1.4 to 1.6 million EVs annually by 2027, with a planned expansion to about 3.2 billion square meters of separator output, underscoring how scaled component manufacturing requires substantial process control and qualification discipline.
Technology transitions add another layer of complexity as buyers balance legacy platform requirements with newer performance-driven specifications. Shifts in battery chemistry preferences can change the relative demand profile for plate designs and materials, requiring capacity and portfolio adjustments. Competitive pressure can intensify pricing challenges, particularly in commoditized segments where differentiation is limited. These factors raise the importance of operational efficiency and consistent performance metrics for supplier retention.
Battery Plate Market Trends and Opportunities
Manufacturers are increasingly focused on enhancing durability and reducing degradation through material optimization and tighter process controls. As duty cycles intensify across mobility and storage, buyers prioritize consistent electrochemical performance and longer service life rather than only upfront cost. This trend supports opportunities for suppliers that can demonstrate measurable improvements in reliability and defect reduction. Demand growth in energy storage also creates whitespace for specialized designs aligned with high-cycle applications.
Procurement behavior is also shifting toward supplier consolidation and longer-term agreements with proven delivery reliability and quality performance. Suppliers that provide stable lead times, scalable capacity, and engineering support are better positioned to win multi-year programs. The rise of localized manufacturing and regional supply resilience initiatives can create additional opportunities for capacity investments closer to key end markets. These dynamics support value creation through operational excellence, qualification readiness, and portfolio breadth.
- For instance, Panasonic Energy began mass production at its Kansas battery factory with a planned annual capacity of about 32 GWh, expects roughly 20% higher productivity than its Nevada facility, and aims to raise its combined U.S. battery production capacity to about 73 GWh, illustrating how localized scale and manufacturing efficiency can support long-term supply agreements.
Regional Insights
North America
North America accounted for 16.9% share in 2025, supported by a stable automotive replacement market and growing deployments of batteries in commercial and industrial backup systems. Procurement in North America often emphasizes consistent quality performance, compliance readiness, and reliable supply continuity. Battery demand is supported by electrification initiatives and increasing interest in storage for resilience and grid support. Component suppliers that can meet tight specification tolerances and deliver at scale typically gain stronger positioning. The region also benefits from a mature ecosystem of OEM and aftermarket channels that support predictable replacement volumes.
Europe
Europe held 12.8% share in 2025, with demand shaped by electrified mobility adoption, industrial modernization, and a rising focus on energy efficiency and emissions reduction. Buyers frequently prioritize traceability, compliance alignment, and consistent performance over extended operating conditions. The region’s heterogeneous market structure increases the importance of local partnerships and qualification readiness across multiple countries. Component sourcing strategies often favor suppliers with strong process control and documentation capability. Continued investment in storage and electrified platforms supports steady demand for dependable plate solutions.
Asia Pacific
Asia Pacific led with 61.2% share in 2025, driven by the concentration of battery manufacturing hubs and high-volume downstream demand across mobility, electronics, and storage. Scale advantages and dense supplier ecosystems support cost competitiveness and high throughput. Buyers in the region frequently prioritize manufacturing consistency, capacity availability, and rapid qualification timelines for large programs. Expansion of storage deployments and electrification across multiple sectors supports broad-based demand for battery components. Regional competitiveness remains high, encouraging ongoing process improvement and efficiency upgrades.
Latin America
Latin America accounted for 5.4% share in 2025, supported by automotive replacement cycles and increasing demand for reliable backup power solutions in commercial and infrastructure settings. Market growth is often influenced by affordability considerations and the availability of established distribution networks. Suppliers that can provide stable pricing, dependable delivery, and consistent quality are typically preferred for recurring procurement. Industrial and commercial users continue to adopt batteries for continuity and resilience, supporting incremental plate demand. Local market dynamics can vary widely across countries, shaping procurement and channel strategies.
Middle East & Africa
Middle East & Africa held 3.7% share in 2025, with demand supported by backup power requirements, infrastructure development, and increasing focus on power continuity. Commercial, telecom, and critical infrastructure users often drive baseline battery adoption, supporting steady component requirements. Procurement decisions typically weigh durability, operating stability in harsh conditions, and serviceability considerations. Adoption of storage solutions is also rising where power reliability is a priority. Suppliers that can support consistent quality and reliable distribution tend to be better positioned in the region.
Competitive Landscape
The Battery Plate Market is moderately to highly competitive, shaped by a mix of large integrated battery manufacturers and specialized lead-acid producers that compete on cost, plate quality consistency, recycling integration, and long-term supply reliability. Competitive positioning is strongly influenced by manufacturing scale, upstream access to lead and alloys (including secondary/recycled lead), and process control capabilities that reduce defect rates and improve plate life. Suppliers differentiate through grid design know-how, alloy formulation expertise, automation levels, and the ability to deliver consistent performance across high-volume automotive and industrial duty cycles. As lithium-ion adoption rises, competitive intensity also increases around technology upgrades, capacity optimization, and customer qualification requirements, especially where customers are tightening performance specifications.
Clarios, LLC is positioned as a scale-led participant with deep relationships across OEM and aftermarket battery channels, supported by high-volume manufacturing and established quality systems. GS Yuasa, EnerSys, and East Penn Manufacturing maintain strong competitive positions through a mix of broad product coverage, engineered performance, and long-standing customer qualification across automotive and industrial applications.
The industry research and growth report includes detailed analyses of the competitive landscape of the market and information about key companies, including:
- Clarios, LLC
- GS Yuasa Corporation
- Exide Industries Ltd.
- East Penn Manufacturing
- EnerSys
- Amara Raja Energy & Mobility Ltd.
- FIAMM Energy Storage Solutions S.p.A.
- Narada Power Source Co., Ltd.
- Camel Group Co., Ltd.
- Chaowei Power Holdings Ltd.
- Leoch International Technology Ltd.
- Crown Battery Manufacturing Co.
Qualitative and quantitative analysis of companies has been conducted to help clients understand the wider business environment as well as the strengths and weaknesses of key industry players. Data is qualitatively analyzed to categorize companies as pure play, category-focused, industry-focused, and diversified; it is quantitatively analyzed to categorize companies as dominant, leading, strong, tentative, and weak.
Recent Developments
- In a July 2025, the FIAMM business was part of AURELIUS’ acquisition of FIAMM Energy Technology, and the buyer said the deal would support transformation and growth across energy transition markets
- In March 2025, EnerSys partnered with Mitsubishi Logisnext Americas to expand power choices for forklift operations, with the collaboration covering batteries, energy-efficient chargers, and battery management devices.
- In a December 2024, Amara Raja Energy & Mobility Ltd. partnered with Hyundai Motor India to supply indigenously manufactured AGM batteries, a move that strengthens its position in advanced automotive battery applications.
Report Scope
| Report Attribute | Details |
| Market size value in 2025 | USD 3294.35 million |
| Revenue forecast in 2032 | USD 9612.46 million by 2032 |
| Growth rate (CAGR) | 16.53% (2025–2032) |
| Base year | 2025 |
| Forecast period | 2025–2032 |
| Quantitative units | USD million |
| Segments covered | By Battery Type Outlook: Lead-acid Batteries, Lithium-ion Batteries, Other Batteries; By Material / Plate Material Outlook: Lead, Lead Alloy, Others; By End User / Application Outlook: Automotive, Aerospace, Energy Storage, Electronics, Others |
| Regional scope | North America, Europe, Asia Pacific, Latin America, Middle East & Africa |
| Key companies profiled | Clarios, LLC; GS Yuasa Corporation; Exide Industries Ltd.; East Penn Manufacturing; EnerSys; Amara Raja Energy & Mobility Ltd.; FIAMM Energy Storage Solutions S.p.A.; Narada Power Source Co., Ltd.; Camel Group Co., Ltd.; Chaowei Power Holdings Ltd.; Leoch International Technology Ltd.; Crown Battery Manufacturing Co. |
| No. of Pages | 328 |
Segmentation
By Battery Type
- Lead-acid Batteries
- Lithium-ion Batteries
- Other Batteries
By Material / Plate Material
- Lead
- Lead Alloy
- Others
By End User / Application
- Automotive
- Aerospace
- Energy Storage
- Electronics
- Others
By Region
- North America
- U.S.
- Canada
- Mexico
- Europe
- Germany
- France
- U.K.
- Italy
- Spain
- Rest of Europe
- Asia Pacific
- China
- Japan
- India
- South Korea
- South-east Asia
- Rest of Asia Pacific
- Latin America
- Brazil
- Argentina
- Rest of Latin America
- Middle East & Africa
- GCC Countries
- South Africa
- Rest of the Middle East and Africa
Request a Free Sample
Fill in your details and we'll send you a free sample report.
- Sample data tables & charts
- Research methodology
Need a Custom Version of This Report?
Tailor the scope, geography, or segments to your exact requirements.
- Custom geography or segment scope
- Direct access to our analyst team
Frequently Asked Questions
What is the market size of the Battery Plate Market in 2025 and what is the forecast for 2032?
What is the CAGR for the Battery Plate Market during 2025–2032?
Which region leads the Battery Plate Market in 2025?
Which segment is largest by battery type in 2025?
Which end-user/application segment leads in 2025?
Who are the key companies profiled in the Battery Plate Market?
Table of Content
Chapter 1. Report Introduction
- 1.1 Report Description & Purpose
- 1.1.1 Report Title & Market Definition
- 1.1.2 Unique Selling Propositions (USP) & Key Differentiators
- 1.1.3 Value Proposition for Stakeholders
- 1.2 Research Objectives
- 1.2.1 Market Sizing Objectives (Volume & Revenue)
- 1.2.2 Segmentation Objectives
- 1.2.3 Competitive Intelligence Objectives
- 1.2.4 Forecast & Scenario Objectives
- 1.3 Report Scope
- 1.3.1 Battery Plate Scope – Types & Subtypes Covered
- 1.3.2 Geographic Scope – Regions & Countries Covered
- 1.3.3 Historical Period, Base Year & Forecast Period (2025; forecast to 2032)
- 1.3.4 Inclusions & Exclusions
- 1.4 HS Code & Classification Framework
- 1.5 Currency, Units & Pricing Basis
- 1.6 Target Stakeholders
- 1.7 Limitations & Assumptions
Chapter 2. Executive Summary
- 2.1 Global Battery Plate Market Snapshot
- 2.1.1 Market Size – Historical (2025) & Forecast (2025-2032) (2025: USD 3,294.35 million → 2032: USD 9,612.46 million)
- 2.1.2 Volume & Revenue – Global Totals
- 2.1.3 Key Market Highlights – Top Five Facts
- 2.2 Battery Plate Market Segmentation Snapshot
- 2.2.1 Market Split by Region – 2025 vs. 2032
- 2.3 Competitive Snapshot
- 2.3.1 Top 10 Players by Revenue Share – 2025
- 2.3.2 Top 10 Players by Volume Share – 2025
- 2.3.3 Recent Strategic Developments (18-Month Summary)
- 2.4 Key Investment Highlights & Strategic Conclusions
Chapter 3. Battery Plate Market Dynamics & Industry Analysis
- 3.1 Market Overview & Context
- 3.1.1 Battery Plate Market Position in the Broader Automotive Value Chain
- 3.1.2 OEM vs. Replacement Market Dynamics
- 3.1.3 Market Maturity & Development Stage by Region
- 3.2 Battery Plate Market Drivers
- 3.3 Battery Plate Market Restraints & Challenges
- 3.4 Battery Plate Market Opportunities
- 3.5 Porter's Five Forces Analysis
- 3.5.1 Threat of New Entrants
- 3.5.2 Bargaining Power of Suppliers
- 3.5.3 Bargaining Power of Buyers
- 3.5.4 Threat of Substitutes
- 3.5.5 Competitive Rivalry – Intensity Assessment
- 3.6 Battery Plate Value Chain Analysis
- 3.6.1 Upstream – Raw Material/Input Suppliers
- 3.6.1.1 Raw Material/Input 1
- 3.6.1.2 Raw Material/Input 2
- 3.6.1.3 Raw Material/Input 3
- 3.6.2 Midstream – Production/Manufacturing/Service Delivery
- 3.6.2.1 Production/Process Overview
- 3.6.2.2 Key Facility Locations & Capacity by Manufacturer
- 3.6.3 Downstream – Distribution & End Consumer
- 3.6.3.1 Primary Channel – B2B/OEM
- 3.6.3.2 Secondary Channels – Dealer, Retail, Online, Direct
- 3.6.4 Value Chain Profitability Analysis
- 3.6.1 Upstream – Raw Material/Input Suppliers
- 3.7 PESTEL Analysis
- 3.7.1 Political Factors
- 3.7.2 Economic Factors
- 3.7.3 Social Factors
- 3.7.4 Technological Factors
- 3.7.5 Environmental Factors
- 3.7.6 Legal Factors
- 3.8 Battery Plate Supply Chain Analysis
- 3.8.1 Raw Material/Input Supply Risk Assessment
- 3.8.2 Manufacturing Concentration Risk (Geographic Exposure)
- 3.8.3 Trade Disruption Impact Analysis
- 3.9 Regulatory & Policy Landscape
Note: The regulatory and policy landscape section covers regulations based on their applicability to the market, Battery Plate category, geography, and scope of the study. Only regulatory frameworks with a material impact on operations, compliance, trade, sustainability, or market access are analyzed in detail.
Chapter 4. Key Investment Pockets & Opportunity Analysis
- 4.1 Battery Plate Market Attractiveness Analysis
- 4.1.1 By Region – Investment Attractiveness Matrix (Volume × CAGR)
- 4.2 Absolute Revenue Growth Opportunity
- 4.2.1 By Region – Absolute USD Growth Through 2032
- 4.3 Incremental Volume Opportunity
- 4.3.1 By Region – Incremental Volume Through 2032
- 4.3.2 Segment – Incremental Volume
- 4.4 Emerging Submarket Opportunity Deep Dive (Subject to Applicability)
- 4.5 Emerging Market Opportunity Scorecards
- 4.5.1 United States
- 4.5.2 Europe
- 4.5.3 Asia
- 4.5.4 Middle East & Africa
Note: Emerging Market Opportunity Scorecards will be included based on relevance and strategic importance. Regions listed are indicative and may vary depending on data availability and market dynamics.
Chapter 5. Battery Plate Import-Export Analysis & Trade Flows
- 5.1 Global Trade Overview
- 5.1.1 Global Export Value by Country (2025)
- 5.1.2 Global Export Volume by Country (2025)
- 5.1.3 Global Import Value by Country (2025)
- 5.1.4 Global Import Volume by Country (2025)
- 5.1.5 Net Trade Balance by Country (2025)
- 5.2 Export Analysis – Segment
- 5.2.1 Type 1 (HS Code)
- 5.2.2 Type 2 (HS Code)
- 5.2.3 Type 3 (HS Code)
- 5.2.4 Type 4 (HS Code)
- 5.2.5 Type 5 (HS Code)
- 5.3 Import Analysis – Segment
- 5.3.1 Type 1 (HS Code)
- 5.3.2 Type 2 (HS Code)
- 5.3.3 Type 3 (HS Code)
- 5.3.4 Type 4 (HS Code)
- 5.3.5 Type 5 (HS Code)
- 5.4 Average Unit Trade Prices
- 5.4.1 Average Export Price – Segment & Country
- 5.4.2 Average Import Price – Segment & Source Country
- 5.4.3 Price Trends (2025)
- 5.5 Key Trade Route Analysis
- 5.5.1 Trade Route 1
- 5.5.2 Trade Route 2
- 5.5.3 Trade Route 3
- 5.5.4 Trade Route 4
- 5.5.5 Trade Route 5
- 5.6 Trade Policy Impact Assessment
- 5.6.1 US Anti-Dumping & Section 301 Tariffs
- 5.6.2 EU Customs Union Impact
- 5.6.3 Major Free Trade Agreements
- 5.6.4 USMCA Rules of Origin
Note: Trade policy analysis will be included only where relevant to the Battery Plate market.
Chapter 6. Competitive Landscape & Company Benchmarking
- 6.1 Battery Plate Market Concentration & Structure
- 6.1.1 Herfindahl-Hirschman Index (HHI) – vs. 2025
- 6.1.2 Tier 1, Tier 2 & Tier 3 Market Structure
- 6.1.3 Global, Regional & Local Player Dynamics
- 6.2 Battery Plate Market Share Analysis – 2025
- 6.2.1 Global Revenue Share by Company
- 6.2.2 Global Volume Share by Company
- 6.2.3 Regional Revenue Share
- 6.2.4 Market Share Evolution ( vs. 2025)
- 6.2.5 OEM Segment Share by Company
- 6.2.6 Replacement Segment Share by Company
- 6.3 Production/Delivery Capacity & Facility Analysis
- 6.3.1 Global Installed Capacity
- 6.3.2 Capacity Utilization Rates
- 6.3.3 Production/Output Volume
- 6.3.4 Facility Locations & Capacity Map
- 6.3.5 Planned Capacity Additions
- 6.4 Battery Plate Competitive Benchmarking Matrix
- 6.4.1 Revenue, Volume, CAGR & Profitability Comparison
- 6.4.2 Channel Revenue Mix
- 6.4.3 Geographic Revenue Exposure
- 6.4.4 R&D Intensity
- 6.4.5 Sustainability Maturity
- 6.5 Strategic Developments in Battery Plate (Last 24 Months)
- 6.5.1 Mergers, Acquisitions & Divestments
- 6.5.2 New Battery Plate Launches
- 6.5.3 Facility Expansions
- 6.5.4 Strategic Alliances, Joint Ventures & Partnerships
- 6.5.5 Distribution Expansion & Market Entry
- 6.5.6 Sustainability & ESG Initiatives
- 6.6 Competitive Strategy Mapping
- 6.6.1 Leader, Challenger, Follower & Niche Classification
- 6.6.2 Pricing Strategy Comparison
- 6.6.3 Channel Strategy Matrix
Note: Strategic developments are included based on their materiality and the availability of reliable information.
Chapter 7. Global Battery Plate Market – By Distribution Channel
- 7.1 Segment Overview
- 7.1.1 Volume & Revenue Split by Channel (2025 & 2032)
- 7.1.2 Channel Mix Evolution (2025-2032)
Chapter 8. Regional Market Analysis – Global Overview
- 8.1 Global Regional Overview
- 8.1.1 Regional Volume Share
- 8.1.2 Regional Revenue Share
- 8.1.3 Regional Volume by Region
- 8.1.4 Regional Revenue by Region
- 8.1.5 Regional Forecast Through 2032
- 8.2 Cross-Regional Segment Analysis
- 8.2.1 By Distribution Channel
- 8.2.2 By Brand/Price Tier
Chapter 9. North America Battery Plate Market
- 9.1 United States
- 9.2 Canada
- 9.3 Mexico
Chapter 10. Europe Battery Plate Market
- 10.1 Germany
- 10.2 France
- 10.3 Italy
- 10.4 United Kingdom
- 10.5 Spain
- 10.6 Poland
- 10.7 Russia
- 10.8 Netherlands
- 10.9 Belgium
- 10.10 Sweden
- 10.11 Denmark
- 10.12 Norway
- 10.13 Rest of Europe
Chapter 11. Asia Pacific Battery Plate Market
- 11.1 China
- 11.2 India
- 11.3 Japan
- 11.4 South Korea
- 11.5 Thailand
- 11.6 Indonesia
- 11.7 Vietnam
- 11.8 Malaysia
- 11.9 Australia
- 11.10 Rest of Asia Pacific
Chapter 12. Latin America Battery Plate Market
- 12.1 Brazil
- 12.2 Argentina
- 12.3 Colombia
- 12.4 Chile
- 12.5 Rest of Latin America
Chapter 13. Middle East Battery Plate Market
- 13.1 Saudi Arabia
- 13.2 United Arab Emirates
- 13.3 Turkey
- 13.4 Israel
- 13.5 Iran
- 13.6 Rest of the Middle East
Chapter 14. Africa Battery Plate Market
- 14.1 South Africa
- 14.2 Egypt
- 14.3 Nigeria
- 14.4 Morocco
- 14.5 Rest of Africa
Chapter 15. Battery Plate Company Profiles
- 15.1 [Company 01]
- 15.1.1 Company Overview
- 15.1.2 Key Management Personnel
- 15.1.3 Products & Services Portfolio
- 15.1.4 Financial Performance
- 15.1.5 Key Market Focus & Geographic Presence
- 15.1.6 Recent Developments & Strategic Initiatives
Note: The company profile list is preliminary and may change based on research findings, market developments, data availability, and client requirements.
Chapter 16. Appendices
- Appendix A – List of Abbreviations & Acronyms
- Appendix B – Industry Classification Code Reference – Full Series
- Appendix C – Production & Capacity Data Tables
- Appendix D – End-Use & Demand Base Tables
- Appendix E – Consumption & Replacement Rate Assumptions
- Appendix F – ASP Reference Tables
- Appendix G – Manufacturing & Facility Database
- Appendix H – Import-Export Data Tables
- Appendix I – Regulatory Summary Tables
- Appendix J – Primary Research Participant List (Anonymized)
- Appendix K – Primary Research Questionnaire Framework
- Appendix L – Data Sources & Bibliography
- Appendix M – Market Size Divergence & Source Comparison
Chapter 17. Research Methodology
- 17.1 Research Framework & Philosophy
- 17.2 Secondary Research – Sources, Hierarchy & Data Extraction
- 17.3 Data Modeling – Bottom-Up & Top-Down Market Sizing
- 17.4 Primary Research – Stakeholder Framework, LOI & Sample Sizes
- 17.5 Forecast Methodology – Regression, Scenario & Sensitivity Analysis
- 17.6 Quality Control – Four-Layer Validation Framework
- 17.7 Limitations & Standard Assumptions
- 17.8 Disclaimer
