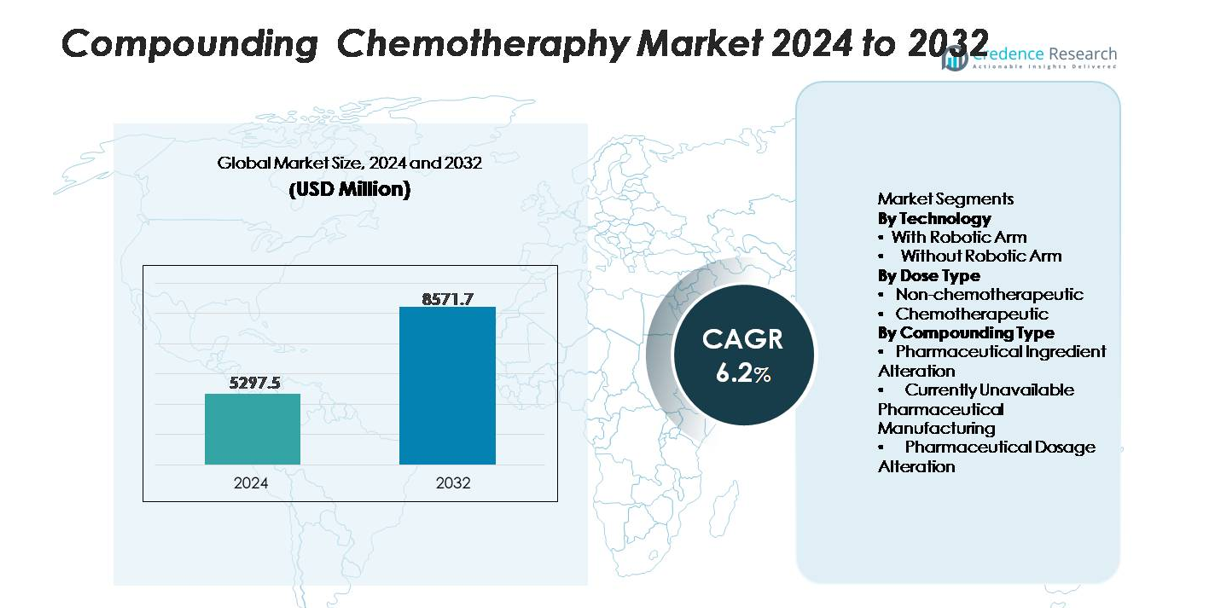
Home » Healthcare » Compounding Chemotherapy Market

Compounding Chemotherapy Market By Dose Type (Chemotherapeutic, Non-chemotherapeutic) By Compounding Type (Pharmaceutical Ingredient Alteration (PIA), Pharmaceutical Dosage Alteration (PDA), Others)-Growth, Future Prospects & Competitive Analysis, 2016 – 2030

Price: $4999

Published: | Report ID: 18951 | Report Format : PDF

Key Highlights of the Report

The global compounding chemotherapy market is segmented by dose type, compounding type, delivery method, technology, and region. Chemotherapeutic drugs dominate the market in terms of dose type, while non-chemotherapeutic drugs show promising growth potential. Pharmaceutical dosage alteration (PDA) is the dominant compounding type, and the gravimetric automated compounding device is the leading delivery method. Robotic arm technology holds a significant market share. North America leads the global market, followed by Europe, with the Asia-Pacific region showing rapid growth.

Increasing incidences of cancer, advancements in pharmaceutical compounding technologies, and rising demand for personalized treatment options are key factors contributing to market expansion. Besides, the rising geriatric population, which is more susceptible to cancer, and the increasing adoption of precision medicine approaches further propel market growth. However, the market also faces certain restraints, including stringent regulatory requirements and safety concerns associated with compounding chemotherapy. On the other hand, there are promising opportunities in the global compounding chemotherapy market, such as the development of innovative compounding technologies and the increasing adoption of precision medicine approaches.

Market Overview

The global compounding chemotherapy market has witnessed rapid growth in recent years and is estimated to grow at a CAGR of 6.3% between 2023 and 2030. The market was valued at USD 0.6 billion in 2022 and is anticipated to reach USD 0.92 billion in 2030.

Design Element 2

Access crucial information at unmatched prices!

Request your free sample report today & start making informed decisions powered by Credence Research!

Download Free Sample
CTA Design Element 3

What Are The Main Drivers Of The Global Compounding Chemotherapy Market?

The global compounding chemotherapy market growth is primarily driven by the increasing prevalence of cancer worldwide and the consequent rising demand for chemotherapy treatments. Advancements in drug development, including targeted therapies and immunotherapies, have fuelled the need for customized compounded chemotherapy drugs. Technological advances in drug delivery systems and the shift towards personalized medicine have further boosted the market, improving treatment efficacy and patient outcomes.

What Are The Major Challenges The Global Compounding Chemotherapy Market Faces?

The global compounding chemotherapy market faces significant challenges, including stringent regulatory compliance, medication errors, cost and reimbursement issues, logistical complexities, and competition from alternative treatment options. The need to adhere to strict quality standards and regulatory guidelines increases operational costs for compounding pharmacies. The rising cost of cancer treatments and limited reimbursement policies create financial challenges for patients.

What Are The Growth Opportunities In The Global Compounding Chemotherapy Market?

The global compounding chemotherapy market presents growth opportunities driven by the adoption of compounding techniques, targeted therapies, and customized formulations. Integration of advanced technologies like 3D printing and automation enhances accuracy and efficiency. Rising cancer prevalence and the need for personalized treatment drive demand, while expansion into untapped markets and collaborative partnerships promote innovation and market expansion.

Executive Summary

Overview of the Global Compounding Chemotherapy Market

The global compounding chemotherapy market is witnessing substantial growth due to the increasing cancer incidence and the need for personalized treatment approaches. Compounding chemotherapy involves the customized preparation of medications to meet the unique needs of individual patients. This approach allows for precise dosing, formulation modifications, and combination therapies, ultimately enhancing treatment outcomes. The market is driven by advancements in compounding techniques, the development of targeted therapies, and the integration of advanced technologies like 3D printing and automation.

Compounding Chemotherapy Market

Market Definition

The compounding chemotherapy market refers to the segment of the healthcare industry that focuses on the customized preparation of chemotherapy medications for individual patients. It involves compounding chemotherapy drugs according to specific dosage requirements, formulation modifications, and combination therapies prescribed by healthcare professionals. Chemotherapy treatment includes the eradication of rapidly dividing aberrant cells. It entails the use of chemicals and lasers to remove all diseased cells. Depending on the current stage of cancer and the impacted body part, chemotherapy may be combined with additional therapies like radiation therapy or surgery to remove the damaged tissue or cells.

 Market Insights

  • The global demand for compounding chemotherapy was valued at USD 0.6 Billion in 2022 and is expected to reach USD 0.92 Billion in 2030, growing at a CAGR of 6.3% between 2023 and 2030.
  • Chemotherapeutic is the leading dose type segment, holding over 62% market share in 2022, while non-chemotherapeutic is expected to experience the fastest market growth.
  • Pharmaceutical dosage alteration (PDA) is the most prevalent compounding type, capturing a significant market share of over 68% in 2022, and is anticipated to grow at a higher CAGR.
  • The gravimetric automated compounding device accounted for the largest share of 54% in the global compounding chemotherapy market in 2022 by delivery method segment.
  • With robotic arm remains the superior technology segment, accounting for over 72% of the global market revenue share in 2022.
  • North America leads the global market, accounting for over 44% of the market share in 2022, while the Asia-Pacific region is emerging as a lucrative market for compounding chemotherapy.
  • Chemotherapy compounding involves the mixing, diluting, and packaging of chemotherapy drugs in precise dosages and formulations as oncologists prescribe.

Segmentation by Dose Type

  • The chemotherapeutic segment held over 62% market share in 2022, owing to the widespread use of cytotoxic agents and antimetabolites in cancer treatments.
  • The non-chemotherapeutic segment is experiencing rapid growth and is expected to gain significant market traction in the coming years, fueled by the incorporation of supportive therapies and personalized medicine.

Segmentation by Compounding Type

  • The pharmaceutical dosage alteration (PDA) segment dominated the market in 2022, capturing over 68% of revenue and offering flexibility in treatment options.
  • The pharmaceutical ingredient alteration (PIA) segment is projected for high growth, providing customized formulations for targeted therapies.

Segmentation by Delivery Method

  • The volumetric automated compounding device segment is projected to have the highest CAGR in the forecast period.
  • In 2022, the gravimetric automated compounding device segment held the largest market share, accounting for over 54% of the global revenue.

Segmentation by Technology

  • The segment with robotic arm technology dominated in 2022, contributing over 72% of revenue, ensuring automation, efficiency, and quality.
  • The segment without robotic arm technology is expected to grow substantially, offering cost-effective alternatives for specific compounding requirements.

Segmentation by Region

  • North America held the largest market share in 2022, capturing 44% of the total revenue.
  • Europe is a significant market for compounding chemotherapy, contributing significantly to the overall market share.
  • The Asia-Pacific region is witnessing rapid adoption of compounding chemotherapy.
  • The rest of the world, including the Middle East, Latin America, and Africa, is swiftly adopting compounding chemotherapy solutions, driven by improving healthcare facilities and a growing focus on reducing the cancer burden.

The global compounding chemotherapy market growth is fueled by increasing cancer incidence, growing demand for personalized therapies, and technological advancements. However, market growth is restrained by regulatory complexities, safety concerns, high treatment costs, and limited accessibility, especially in developing regions.

The United States is a leading compounding chemotherapy market driven by its advanced healthcare infrastructure, strong pharmaceutical industry, and extensive R&D activities. The country’s large patient population, high healthcare expenditure, and stringent regulatory framework contribute to the market’s growth. The U.S. offers a favorable environment for introducing innovative compounding chemotherapy treatments supported by collaborations between academia and industry.

Germany is also dominant in the compounded chemotherapy industry, owing to its well-established healthcare system, superior medical technologies, and emphasis on research and development. The country’s pharmaceutical industry is known for producing high-quality products, and the presence of prestigious medical institutions encourages the development of novel compounded chemotherapeutic treatments. The supportive regulatory environment in Germany and government initiatives in the healthcare sector contribute to the market’s growth and expansion.

Increasing Cancer Incidences Across the Globe

The growing global prevalence of cancer is driving the compounded chemotherapy industry. According to the WHO, cancer is the leading cause of death worldwide, accounting for around 10 million fatalities in 2021, or nearly one in every six deaths. The increased incidence of cancer types such as lung, breast, colorectal, and prostate is driving up demand for chemotherapy medications and compounding services. The expanding patient population and the need for efficient treatment alternatives both contribute to market growth.

Advancements in Personalized Therapies

The industry is expanding due to improvements in personalized medicine and targeted medicines. The development of genomic profiling, molecular diagnostics, and biomarker testing has paved the path for customized therapy regimens. This shift towards personalized treatments has increased the demand for compounding chemotherapy as it enables the production of tailored medication combinations and formulations. The growing need for customized treatment and the expansion of unmet medical demands are major drivers of compounded chemotherapy market revenue expansion.

High Treatment Costs and Limited Accessibility

The high cost of chemotherapy drugs and limited accessibility to compounding services pose restraints to market growth. Affordability and availability of compounding chemotherapy services influence patient access to essential cancer treatments. Particularly in developing regions, the high treatment costs and lack of accessible compounding facilities hinder market expansion.

Rising Adoption and Investments in New Chemotherapies Procedures

Continued investments in research and development develop substantial opportunities for the compounded chemotherapy market. Ongoing attempts to identify new chemotherapeutic medications, optimize drug combinations, and improve drug delivery methods can lead to creative solutions that increase treatment efficacy and patient outcomes. Market players can use these improvements to launch new products and acquire a competitive advantage.

Competitive Landscape

Key Players

The competitive landscape of the global compounding chemotherapy market is highly competitive and characterized by the presence of several key players. Some of the leading players in the global market and their market share are as follows:

  • Pfizer Inc
  • B. Braun Melsungen AG
  • Omnicell Inc
  • Metrix Company S.A.
  • Dedalus S.P.A.
  • Icon Group
  • Arxium Inc
  • Baxter International Inc
  • Loccioni Group
  • Miller Pharmacy Inc
  • Steriline S.R.L.
  • Grifols S.A.
  • Comecer S.P.A.
  • Equashield LLC

These players actively use strategies like product development, partnerships, collaborations, and acquisitions to strengthen their market position. They also invest in research and development activities to introduce innovative products and gain a competitive edge. Leading players in the global market focus on expanding their distribution networks and improving their supply chain management to cater to the growing demand.

For instance, in March 2021, the USFDA approved Pfizer Inc’s sNDA for its LORBRENA, thereby boosting the indication to comprise the first-line treatment for patients with anaplastic lymphoma kinase-positive non-small cell lung cancer. LORBRENA is a third-generation ALK inhibitor developed for inhibiting tumor mutations that accelerate medication resistance while addressing brain metastases.

In May 2019, Fagron agreed to buy Central de Drogas, S.A. de C.V., a Mexican supplier of raw materials to the pharmaceutical sector and compounding pharmacies.

Summary of Key Findings

  • The rising prevalence of cancer and the need for effective chemotherapy regimens contribute to market growth, as compounding chemotherapy allows for precise dosing and formulation tailored to specific cancer types and patient profiles.
  • Market segmented by dose type, compounding type, delivery method, technology, and region.
  • The pharmaceutical dosage alteration (PDA) segment dominates the compounding type, while the pharmaceutical ingredient alteration (PIA) segment shows growth potential.
  • The gravimetric automated compounding device is the largest delivery method segment, and robotic arm technology is leading in the global market.
  • North America holds the largest market share, with Europe and the Asia-Pacific region expected to witness substantial growth in the compounding chemotherapy market.
  • Key market players include pharmaceutical companies, healthcare providers, and research institutions focusing on developing innovative solutions and expanding access to compounding chemotherapy treatments.

Shape Your Report to Specific Countries or Regions & Enjoy 30% Off!

Future Outlook

  • The development and adoption of innovative compounding techniques and technologies, such as robotic compounding systems and automation, are expected to enhance efficiency, accuracy, and safety in compounding chemotherapy processes.
  • Industry players are focusing on R&D activities to introduce novel drug formulations and delivery systems, catering to the specific needs of patients and improving treatment outcomes.
  • The Asia-Pacific is predicted to have significant growth potential in the compounded chemotherapy market, owing to rising cancer prevalence, improved healthcare infrastructure, and increased awareness of advanced treatment options.
  • Increasing focus on patient-centric care and value-based healthcare models, driving the demand for tailored compounding chemotherapy solutions.

Segmentation

  • By Dose Type
    • Chemotherapeutic
    • Non-chemotherapeutic
  • By Compounding Type
    • Pharmaceutical Ingredient Alteration (PIA)
    • Pharmaceutical Dosage Alteration (PDA)
    • Others
  • By Delivery Method
    • Gravimetric Automated Compounding Device
    • Volumetric Automated Compounding Device
  • By Technology
    • With Robotic Arm
    • Without Robotic Arm
  • By Region
    • North America
      • The U.S.
      • Canada
      • Mexico
    • Europe
      • Germany
      • France
      • The U.K.
      • Italy
      • Spain
      • Rest of Europe
    • Asia Pacific
      • China
      • Japan
      • India
      • South Korea
      • South-east Asia
      • Rest of Asia Pacific
    • Latin America
      • Brazil
      • Argentina
      • Rest of Latin America
    • Middle East & Africa
      • GCC Countries
      • South Africa
      • Rest of the Middle East and Africa

1. Preface
1.1. Report Description
1.1.1. Purpose of the Report
1.1.2. Target Audience
1.1.3. USP and Key Offerings
1.2. Research Scope
1.3. Research Methodology
1.3.1. Phase I – Secondary Research
1.3.2. Phase II – Data Modelling
1.3.2.1. Company Share Analysis Model
1.3.2.2. Revenue-Based Modelling
1.3.3. Phase III – Primary Research
1.3.4. Research Limitations
1.3.5. Assumptions
1.4. Market Introduction
1.5. Market Research Scope

2. Executive Summary
2.1. Market Snapshot: Global Compounding Chemotherapy Market
2.2. Global Compounding Chemotherapy Market, By Dose Type
2.3. Global Compounding Chemotherapy Market, By Compounding Type
2.4. Global Compounding Chemotherapy Market, By Delivery Method
2.5. Global Compounding Chemotherapy Market, By Technology
2.6. Global Compounding Chemotherapy Market, By Region

3. Market Dynamics & Factors Analysis
3.1. Introduction
3.1.1. Global Compounding Chemotherapy Market Value, 2017-2030, (US$ Bn)
3.1.2. Y-o-Y Growth Trend Analysis
3.2. Market Dynamics
3.2.1. Market Drivers
3.2.2. Market Restraints
3.2.3. Market Opportunities
3.2.4. Major Industry Challenges
3.3. Growth and Development Patterns
3.4. Investment Feasibility Analysis
3.5. Market Opportunity Analysis
3.5.1. Dose Type
3.5.2. Compounding Type
3.5.3. Delivery Method
3.5.4. Technology
3.5.5. Geography

4. Premium Insights
4.1. STAR (Situation, Task, Action, Results) Analysis
4.2. Porter’s Five Forces Analysis
4.2.1. Threat of New Entrants
4.2.2. Bargaining Power of Buyers/Consumers
4.2.3. Bargaining Power of Suppliers
4.2.4. Threat of Substitute Types
4.2.5. Intensity of Competitive Rivalry
4.3. Key Market Trends
4.3.1. Demand Side Trends
4.3.2. Supply Side Trends
4.4. Value Chain Analysis
4.5. Technology Analysis
4.6. Analysis and Recommendations
4.7. Marketing Strategy Analysis
4.7.1. Direct Marketing
4.7.2. Indirect Marketing
4.7.3. Marketing Channel Development Trend

5. Market Positioning of Key Players, 2022
5.1. Company Market Share of Key Players, 2022
5.2. Competitive Benchmarking
5.3. Market Positioning of Key Vendors
5.4. Geographical Presence Analysis
5.5. Major Strategies Adopted by Key Players
5.5.1. Key Strategies Analysis
5.5.2. Mergers and Acquisitions
5.5.3. Partnerships
5.5.4. Product Launch
5.5.5. Geographical Expansion
5.5.6. Others

6. Economic Impact Analysis
6.1. Recession Impact
6.1.1. North America
6.1.2. Europe
6.1.3. Asia Pacific
6.1.4. Latin America
6.1.5. Middle East and Africa
6.2. Ukraine-Russia War Impact
6.2.1. North America
6.2.2. Europe
6.2.3. Asia Pacific
6.2.4. Latin America
6.2.5. Middle East and Africa
6.3. COVID-19 Impact Analysis
6.3.1. North America
6.3.2. Europe
6.3.3. Asia Pacific
6.3.4. Latin America
6.3.5. Middle East and Africa

7. Global Compounding Chemotherapy Market, By Dose Type
7.1. Global Compounding Chemotherapy Market Overview, by Dose Type
7.1.1. Global Compounding Chemotherapy Market Revenue Share, By Dose Type, 2022 Vs 2030 (in %)
7.2. Chemotherapeutic
7.2.1. Global Compounding Chemotherapy Market, By Region, 2017-2030 (US$ Bn)
7.3. Non-chemotherapeutic
7.3.1. Global Compounding Chemotherapy Market, By Region, 2017-2030 (US$ Bn)

8. Global Compounding Chemotherapy Market, By Compounding Type
8.1. Global Compounding Chemotherapy Market Overview, by Compounding Type
8.1.1. Global Compounding Chemotherapy Market, By Compounding Type, 2022 vs 2030 (in %)
8.2. Pharmaceutical Ingredient Alteration
8.2.1. Global Compounding Chemotherapy Market, By Region, 2017-2030 (US$ Bn)
8.3. Pharmaceutical Dosage Alteration
8.3.1. Global Compounding Chemotherapy Market, By Region, 2017-2030 (US$ Bn)
8.4. Others
8.4.1. Global Compounding Chemotherapy Market, By Region, 2017-2030 (US$ Bn)

9. Global Compounding Chemotherapy Market, by Delivery Method, 2017-2030 (US$ Bn)
9.1. Global Compounding Chemotherapy Market Overview, by Delivery Method
9.1.1. Global Compounding Chemotherapy Market, By Delivery Method, 2022 vs 2030 (in%)
9.2. Gravimetric Automated Compounding Device
9.2.1. Global Compounding Chemotherapy Market, By Region, 2017-2030 (US$ Bn)
9.3. Volumetric Automated Compounding Device
9.3.1. Global Compounding Chemotherapy Market, By Region, 2017-2030 (US$ Bn)

10. Global Compounding Chemotherapy Market, by Technology, 2017-2030 (US$ Bn)
10.1. Global Compounding Chemotherapy Market Overview, by Technology
10.1.1. Global Compounding Chemotherapy Market, By Technology, 2022 vs 2030 (in%)
10.2. With Robotic Arm
10.2.1. Global Compounding Chemotherapy Market, By Region, 2017-2030 (US$ Bn)
10.3. Without Robotic Arm
10.3.1. Global Compounding Chemotherapy Market, By Region, 2017-2030 (US$ Bn)

11. Global Compounding Chemotherapy Market, By Region
11.1. Global Compounding Chemotherapy Market Overview, by Region
11.1.1. Global Compounding Chemotherapy Market, By Region, 2022 vs 2030 (in%)
11.2. Dose Type
11.2.1. Global Compounding Chemotherapy Market, By Dose Type, 2017-2030 (US$ Bn)
11.3. Compounding Type
11.3.1. Global Compounding Chemotherapy Market, By Compounding Type, 2017-2030 (US$ Bn)
11.4. Delivery Method
11.4.1. Global Compounding Chemotherapy Market, By Delivery Method, 2017-2030 (US$ Bn)
11.5. Technology
11.5.1. Global Compounding Chemotherapy Market, By Technology, 2017-2030 (US$ Bn)

12. North America Compounding Chemotherapy Market Analysis
12.1. North America Compounding Chemotherapy Market, by Dose Type, 2017-2030(US$ Bn)
12.1.1. Overview
12.1.2. SRC Analysis
12.2. North America Compounding Chemotherapy Market, by Compounding Type, 2017-2030(US$ Bn)
12.2.1. Overview
12.2.2. SRC Analysis
12.3. North America Compounding Chemotherapy Market, by Delivery Method, 2017-2030(US$ Bn)
12.3.1. Overview
12.3.2. SRC Analysis
12.4. North America Compounding Chemotherapy Market, by Technology, 2017-2030(US$ Bn)
12.4.1. Overview
12.4.2. SRC Analysis
12.5. North America Compounding Chemotherapy Market, by Country, 2017-2030 (US$ Bn)
12.5.1. North America Compounding Chemotherapy Market, by Country, 2022 Vs 2030 (in%)
12.5.2. U.S.
12.5.2.1. U.S. Compounding Chemotherapy Market Estimates and Forecast, 2017-2030 (US$ Bn)
12.5.2.2. U.S. Compounding Chemotherapy, By Dose Type, 2017-2030 (US$ Bn)
12.5.2.3. U.S. Compounding Chemotherapy, By Compounding Type, 2017-2030 (US$ Bn)
12.5.2.4. U.S. Compounding Chemotherapy, By Delivery Method, 2017-2030 (US$ Bn)
12.5.2.5. U.S. Compounding Chemotherapy, By Technology, 2017-2030 (US$ Bn)
12.5.3. Canada
12.5.3.1. Canada Compounding Chemotherapy Market Estimates and Forecast, 2017-2030 (US$ Bn)
12.5.3.2. Canada Compounding Chemotherapy, By Dose Type, 2017-2030 (US$ Bn)
12.5.3.3. Canada Compounding Chemotherapy, By Compounding Type, 2017-2030 (US$ Bn)
12.5.3.4. Canada Compounding Chemotherapy, By Delivery Method, 2017-2030 (US$ Bn)
12.5.3.5. Canada Compounding Chemotherapy, By Technology, 2017-2030 (US$ Bn)
12.5.4. Mexico
12.5.4.1. Mexico Compounding Chemotherapy Market Estimates and Forecast, 2017-2030 (US$ Bn)
12.5.4.2. Mexico Compounding Chemotherapy, By Dose Type, 2017-2030 (US$ Bn)
12.5.4.3. Mexico Compounding Chemotherapy, By Compounding Type, 2017-2030 (US$ Bn)
12.5.4.4. Mexico Compounding Chemotherapy, By Delivery Method, 2017-2030 (US$ Bn)
12.5.4.5. Mexico Compounding Chemotherapy, By Technology, 2017-2030 (US$ Bn)

13. Europe Compounding Chemotherapy Market Analysis
13.1. Europe Compounding Chemotherapy Market, by Dose Type, 2017-2030(US$ Bn)
13.1.1. Overview
13.1.2. SRC Analysis
13.2. Europe Compounding Chemotherapy Market, by Compounding Type, 2017-2030(US$ Bn)
13.2.1. Overview
13.2.2. SRC Analysis
13.3. Europe Compounding Chemotherapy Market, by Delivery Method, 2017-2030(US$ Bn)
13.3.1. Overview
13.3.2. SRC Analysis
13.4. Europe Compounding Chemotherapy Market, by Technology, 2017-2030(US$ Bn)
13.4.1. Overview
13.4.2. SRC Analysis
13.5. Europe Compounding Chemotherapy Market, by Country, 2017-2030 (US$ Bn)
13.5.1. Europe Compounding Chemotherapy Market, by Country, 2022 Vs 2030 (in%)
13.5.2. Germany
13.5.2.1. Germany Compounding Chemotherapy Market Estimates and Forecast, 2017-2030 (US$ Bn)
13.5.2.2. Germany Compounding Chemotherapy, By Dose Type, 2017-2030 (US$ Bn)
13.5.2.3. Germany Compounding Chemotherapy, By Compounding Type, 2017-2030 (US$ Bn)
13.5.2.4. Germany Compounding Chemotherapy, By Delivery Method, 2017-2030 (US$ Bn)
13.5.2.5. Germany Compounding Chemotherapy, By Technology, 2017-2030 (US$ Bn)
13.5.3. France
13.5.3.1. France Compounding Chemotherapy Market Estimates and Forecast, 2017-2030 (US$ Bn)
13.5.3.2. France Compounding Chemotherapy, By Dose Type, 2017-2030 (US$ Bn)
13.5.3.3. France Compounding Chemotherapy, By Compounding Type, 2017-2030 (US$ Bn)
13.5.3.4. France Compounding Chemotherapy, By Delivery Method, 2017-2030 (US$ Bn)
13.5.3.5. France Compounding Chemotherapy, By Technology, 2017-2030 (US$ Bn)
13.5.4. UK
13.5.4.1. UK Compounding Chemotherapy Market Estimates and Forecast, 2017-2030 (US$ Bn)
13.5.4.2. UK Compounding Chemotherapy, By Dose Type, 2017-2030 (US$ Bn)
13.5.4.3. UK Compounding Chemotherapy, By Compounding Type, 2017-2030 (US$ Bn)
13.5.4.4. UK Compounding Chemotherapy, By Delivery Method, 2017-2030 (US$ Bn)
13.5.4.5. UK Compounding Chemotherapy, By Technology, 2017-2030 (US$ Bn)
13.5.5. Italy
13.5.5.1. Italy Compounding Chemotherapy Market Estimates and Forecast, 2017-2030 (US$ Bn)
13.5.5.2. Italy Compounding Chemotherapy, By Dose Type, 2017-2030 (US$ Bn)
13.5.5.3. Italy Compounding Chemotherapy, By Compounding Type, 2017-2030 (US$ Bn)
13.5.5.4. Italy Compounding Chemotherapy, By Delivery Method, 2017-2030 (US$ Bn)
13.5.5.5. Italy Compounding Chemotherapy, By Technology, 2017-2030 (US$ Bn)
13.5.6. Spain
13.5.6.1. Spain Compounding Chemotherapy Market Estimates and Forecast, 2017-2030 (US$ Bn)
13.5.6.2. Spain Compounding Chemotherapy, By Dose Type, 2017-2030 (US$ Bn)
13.5.6.3. Spain Compounding Chemotherapy, By Compounding Type, 2017-2030 (US$ Bn)
13.5.6.4. Spain Compounding Chemotherapy, By Delivery Method, 2017-2030 (US$ Bn)
13.5.6.5. Spain Compounding Chemotherapy, By Technology, 2017-2030 (US$ Bn)
13.5.7. Rest of Europe
13.5.7.1. Rest of Europe Compounding Chemotherapy Market Estimates and Forecast, 2017-2030 (US$ Bn)
13.5.7.2. Rest of Europe Compounding Chemotherapy, By Dose Type, 2017-2030 (US$ Bn)
13.5.7.3. Rest of Europe Compounding Chemotherapy, By Compounding Type, 2017-2030 (US$ Bn)
13.5.7.4. Rest of Europe Compounding Chemotherapy, By Delivery Method, 2017-2030 (US$ Bn)
13.5.7.5. Rest of Europe Compounding Chemotherapy, By Technology, 2017-2030 (US$ Bn)

14. Asia Pacific Compounding Chemotherapy Market Analysis
14.1. Asia Pacific Compounding Chemotherapy Market, by Dose Type, 2017-2030(US$ Bn)
14.1.1. Overview
14.1.2. SRC Analysis
14.2. Asia Pacific Compounding Chemotherapy Market, by Compounding Type, 2017-2030(US$ Bn)
14.2.1. Overview
14.2.2. SRC Analysis
14.3. Asia Pacific Compounding Chemotherapy Market, by Delivery Method, 2017-2030(US$ Bn)
14.3.1. Overview
14.3.2. SRC Analysis
14.4. Asia Pacific Compounding Chemotherapy Market, by Technology, 2017-2030(US$ Bn)
14.4.1. Overview
14.4.2. SRC Analysis
14.5. Asia Pacific Compounding Chemotherapy Market, by Country, 2017-2030 (US$ Bn)
14.5.1. Asia Pacific Compounding Chemotherapy Market, by Country, 2022 Vs 2030 (in%)
14.5.2. China
14.5.2.1. China Compounding Chemotherapy Market Estimates and Forecast, 2017-2030 (US$ Bn)
14.5.2.2. China Compounding Chemotherapy, By Dose Type, 2017-2030 (US$ Bn)
14.5.2.3. China Compounding Chemotherapy, By Compounding Type, 2017-2030 (US$ Bn)
14.5.2.4. China Compounding Chemotherapy, By Delivery Method, 2017-2030 (US$ Bn)
14.5.2.5. China Compounding Chemotherapy, By Technology, 2017-2030 (US$ Bn)
14.5.3. Japan
14.5.3.1. Japan Compounding Chemotherapy Market Estimates and Forecast, 2017-2030 (US$ Bn)
14.5.3.2. Japan Compounding Chemotherapy, By Dose Type, 2017-2030 (US$ Bn)
14.5.3.3. Japan Compounding Chemotherapy, By Compounding Type, 2017-2030 (US$ Bn)
14.5.3.4. Japan Compounding Chemotherapy, By Delivery Method, 2017-2030 (US$ Bn)
14.5.3.5. Japan Compounding Chemotherapy, By Technology, 2017-2030 (US$ Bn)
14.5.4. India
14.5.4.1. India Compounding Chemotherapy Market Estimates and Forecast, 2017-2030 (US$ Bn)
14.5.4.2. India Compounding Chemotherapy, By Dose Type, 2017-2030 (US$ Bn)
14.5.4.3. India Compounding Chemotherapy, By Compounding Type, 2017-2030 (US$ Bn)
14.5.4.4. India Compounding Chemotherapy, By Delivery Method, 2017-2030 (US$ Bn)
14.5.4.5. India Compounding Chemotherapy, By Technology, 2017-2030 (US$ Bn)
14.5.5. South Korea
14.5.5.1. South Korea Compounding Chemotherapy Market Estimates and Forecast, 2017-2030 (US$ Bn)
14.5.5.2. South Korea Compounding Chemotherapy, By Dose Type, 2017-2030 (US$ Bn)
14.5.5.3. South Korea Compounding Chemotherapy, By Compounding Type, 2017-2030 (US$ Bn)
14.5.5.4. South Korea Compounding Chemotherapy, By Delivery Method, 2017-2030 (US$ Bn)
14.5.5.5. South Korea Compounding Chemotherapy, By Technology, 2017-2030 (US$ Bn)
14.5.6. South-East Asia
14.5.6.1. South-East Asia Compounding Chemotherapy Market Estimates and Forecast, 2017-2030 (US$ Bn)
14.5.6.2. South-East Asia Compounding Chemotherapy, By Dose Type, 2017-2030 (US$ Bn)
14.5.6.3. South-East Asia Compounding Chemotherapy, By Compounding Type, 2017-2030 (US$ Bn)
14.5.6.4. South-East Asia Compounding Chemotherapy, By Delivery Method, 2017-2030 (US$ Bn)
14.5.6.5. South-East Asia Compounding Chemotherapy, By Technology, 2017-2030 (US$ Bn)
14.5.7. Rest of Asia Pacific
14.5.7.1. Rest of Asia Pacific Compounding Chemotherapy Market Estimates and Forecast, 2017-2030 (US$ Bn)
14.5.7.2. Rest of Asia Pacific Compounding Chemotherapy, By Dose Type, 2017-2030 (US$ Bn)
14.5.7.3. Rest of Asia Pacific Compounding Chemotherapy, By Compounding Type, 2017-2030 (US$ Bn)
14.5.7.4. Rest of Asia Pacific Compounding Chemotherapy, By Delivery Method, 2017-2030 (US$ Bn)
14.5.7.5. Rest of Asia Pacific Compounding Chemotherapy, By Technology, 2017-2030 (US$ Bn)

15. Latin America Compounding Chemotherapy Market Analysis
15.1. Latin America Compounding Chemotherapy Market, by Dose Type, 2017-2030(US$ Bn)
15.1.1. Overview
15.1.2. SRC Analysis
15.2. Latin America Compounding Chemotherapy Market, by Compounding Type, 2017-2030(US$ Bn)
15.2.1. Overview
15.2.2. SRC Analysis
15.3. Latin America Compounding Chemotherapy Market, by Delivery Method, 2017-2030(US$ Bn)
15.3.1. Overview
15.3.2. SRC Analysis
15.4. Latin America Compounding Chemotherapy Market, by Technology, 2017-2030(US$ Bn)
15.4.1. Overview
15.4.2. SRC Analysis
15.5. Latin America Compounding Chemotherapy Market, by Country, 2017-2030 (US$ Bn)
15.5.1. Latin America Compounding Chemotherapy Market, by Country, 2022 Vs 2030 (in%)
15.5.2. Brazil
15.5.2.1. Brazil Compounding Chemotherapy Market Estimates and Forecast, 2017-2030 (US$ Bn)
15.5.2.2. Brazil Compounding Chemotherapy, By Dose Type, 2017-2030 (US$ Bn)
15.5.2.3. Brazil Compounding Chemotherapy, By Compounding Type, 2017-2030 (US$ Bn)
15.5.2.4. Brazil Compounding Chemotherapy, By Delivery Method, 2017-2030 (US$ Bn)
15.5.2.5. Brazil Compounding Chemotherapy, By Technology, 2017-2030 (US$ Bn)
15.5.3. Argentina
15.5.3.1. Argentina Compounding Chemotherapy Market Estimates and Forecast, 2017-2030 (US$ Bn)
15.5.3.2. Argentina Compounding Chemotherapy, By Dose Type, 2017-2030 (US$ Bn)
15.5.3.3. Argentina Compounding Chemotherapy, By Compounding Type, 2017-2030 (US$ Bn)
15.5.3.4. Argentina Compounding Chemotherapy, By Delivery Method, 2017-2030 (US$ Bn)
15.5.3.5. Argentina Compounding Chemotherapy, By Technology, 2017-2030 (US$ Bn)
15.5.4. Rest of Latin America
15.5.4.1. Rest of Latin America Compounding Chemotherapy Market Estimates and Forecast, 2017-2030 (US$ Bn)
15.5.4.2. Rest of Latin America Compounding Chemotherapy, By Dose Type, 2017-2030 (US$ Bn)
15.5.4.3. Rest of Latin America Compounding Chemotherapy, By Compounding Type, 2017-2030 (US$ Bn)
15.5.4.4. Rest of Latin America Compounding Chemotherapy, By Delivery Method, 2017-2030 (US$ Bn)
15.5.4.5. Rest of Latin America Compounding Chemotherapy, By Technology, 2017-2030 (US$ Bn)

16. Middle East and Africa Compounding Chemotherapy Market Analysis
16.1. Middle East and Africa Compounding Chemotherapy Market, by Dose Type, 2017-2030(US$ Bn)
16.1.1. Overview
16.1.2. SRC Analysis
16.2. Middle East and Africa Compounding Chemotherapy Market, by Compounding Type, 2017-2030(US$ Bn)
16.2.1. Overview
16.2.2. SRC Analysis
16.3. Middle East and Africa Compounding Chemotherapy Market, by Delivery Method, 2017-2030(US$ Bn)
16.3.1. Overview
16.3.2. SRC Analysis
16.4. Middle East and Africa Compounding Chemotherapy Market, by Technology, 2017-2030(US$ Bn)
16.4.1. Overview
16.4.2. SRC Analysis
16.5. Middle East and Africa Compounding Chemotherapy Market, by Country, 2017-2030 (US$ Bn)
16.5.1. Middle East and Africa Compounding Chemotherapy Market, by Country, 2022 Vs 2030 (in%)
16.5.2. GCC Countries
16.5.2.1. GCC Countries Compounding Chemotherapy Market Estimates and Forecast, 2017-2030 (US$ Bn)
16.5.2.2. GCC Countries Compounding Chemotherapy, By Dose Type, 2017-2030 (US$ Bn)
16.5.2.3. GCC Countries Compounding Chemotherapy, By Compounding Type, 2017-2030 (US$ Bn)
16.5.2.4. GCC Countries Compounding Chemotherapy, By Delivery Method, 2017-2030 (US$ Bn)
16.5.2.5. GCC Countries Compounding Chemotherapy, By Technology, 2017-2030 (US$ Bn)
16.5.3. South Africa
16.5.3.1. South Africa Compounding Chemotherapy Market Estimates and Forecast, 2017-2030 (US$ Bn)
16.5.3.2. South Africa Compounding Chemotherapy, By Dose Type, 2017-2030 (US$ Bn)
16.5.3.3. South Africa Compounding Chemotherapy, By Compounding Type, 2017-2030 (US$ Bn)
16.5.3.4. South Africa Compounding Chemotherapy, By Delivery Method, 2017-2030 (US$ Bn)
16.5.3.5. South Africa Compounding Chemotherapy, By Technology, 2017-2030 (US$ Bn)
16.5.4. Rest of Middle East and Africa
16.5.4.1. Rest of Middle East and Africa Compounding Chemotherapy Market Estimates and Forecast, 2017-2030 (US$ Bn)
16.5.4.2. Rest of Middle East and Africa Compounding Chemotherapy, By Dose Type, 2017-2030 (US$ Bn)
16.5.4.3. Rest of Middle East and Africa Compounding Chemotherapy, By Compounding Type, 2017-2030 (US$ Bn)
16.5.4.4. Rest of Middle East and Africa Compounding Chemotherapy, By Delivery Method, 2017-2030 (US$ Bn)
16.5.4.5. Rest of Middle East and Africa Compounding Chemotherapy, By Technology, 2017-2030 (US$ Bn)

17. Company Profiles
17.1. Pfizer Inc
17.1.1. Company Overview
17.1.2. Products/Services Portfolio
17.1.3. Geographical Presence
17.1.4. Financial Summary
17.1.4.1. Market Revenue and Net Profit (2019-2022)
17.1.4.2. Business Segment Revenue Analysis
17.1.4.3. Geographical Revenue Analysis
17.2. B. Braun Melsungen AG
17.3. Omnicell Inc
17.4. Metrix Company S.A.
17.5. Dedalus S.P.A.
17.6. Icon Group
17.7. Arxium Inc
17.8. Baxter International Inc
17.9. Loccioni Group
17.10. Miller Pharmacy Inc
17.11. Steriline S.R.L.
17.12. Grifols S.A.
17.13. Comecer S.P.A.
17.14. Equashield LLC

List of Figures
FIG. 1 Global Compounding Chemotherapy Market: Research Methodology
FIG. 2 Market Size Estimation – Top Down & Bottom Up Approach
FIG. 3 Global Compounding Chemotherapy Market Segmentation
FIG. 4 Global Compounding Chemotherapy Market, by Dose Type, 2022 (US$ Bn)
FIG. 5 Global Compounding Chemotherapy Market, by Compounding Type, 2022 (US$ Bn)
FIG. 6 Global Compounding Chemotherapy Market, by Delivery Method, 2022 (US$ Bn)
FIG. 7 Global Compounding Chemotherapy Market, by Technology, 2022 (US$ Bn)
FIG. 8 Global Compounding Chemotherapy Market, by Geography, 2022 (US$ Bn)
FIG. 9 Attractive Investment Proposition, by Dose Type, 2022
FIG. 10 Attractive Investment Proposition, by Compounding Type, 2022
FIG. 11 Attractive Investment Proposition, by Delivery Method, 2022
FIG. 12 Attractive Investment Proposition, by Technology, 2022
FIG. 13 Attractive Investment Proposition, by Geography, 2022
FIG. 14 Global Market Share Analysis of Key Compounding Chemotherapy Market Manufacturers, 2022
FIG. 15 Global Market Positioning of Key Compounding Chemotherapy Market Manufacturers, 2022
FIG. 16 Global Compounding Chemotherapy Market Value Contribution, By Dose Type, 2022 & 2030 (Value %)
FIG. 17 Global Compounding Chemotherapy Market, by Chemotherapeutic, Value, 2017-2030 (US$ Bn)
FIG. 18 Global Compounding Chemotherapy Market, by Non-chemotherapeutic, Value, 2017-2030 (US$ Bn)
FIG. 19 Global Compounding Chemotherapy Market Value Contribution, By Compounding Type, 2022 & 2030 (Value %)
FIG. 20 Global Compounding Chemotherapy Market, by Pharmaceutical Ingredient Alteration, 2017-2030 (US$ Bn)
FIG. 21 Global Compounding Chemotherapy Market, by Pharmaceutical Dosage Alteration, Value, 2017-2030 (US$ Bn)
FIG. 22 Global Compounding Chemotherapy Market, by Others, 2017-2030 (US$ Bn)
FIG. 23 Global Compounding Chemotherapy Market Value Contribution, By Delivery Method, 2022 & 2030 (Value %)
FIG. 24 Global Compounding Chemotherapy Market, by Gravimetric Automated Compounding Device, Value, 2017-2030 (US$ Bn)
FIG. 25 Global Compounding Chemotherapy Market, by Volumetric Automated Compounding Device, 2017-2030 (US$ Bn)
FIG. 26 Global Compounding Chemotherapy Market Value Contribution, By Technology, 2022 & 2030 (Value %)
FIG. 27 Global Compounding Chemotherapy Market, by With Robotic Arm, Value, 2017-2030 (US$ Bn)
FIG. 28 Global Compounding Chemotherapy Market, by Without Robotic Arm, 2017-2030 (US$ Bn)
FIG. 29 North America Compounding Chemotherapy Market, 2017-2030 (US$ Bn)
FIG. 30 U.S. Compounding Chemotherapy Market, 2017-2030 (US$ Bn)
FIG. 31 Canada Compounding Chemotherapy Market, 2017-2030 (US$ Bn)
FIG. 32 Europe Compounding Chemotherapy Market, 2017-2030 (US$ Bn)
FIG. 33 Germany Compounding Chemotherapy Market, 2017-2030 (US$ Bn)
FIG. 34 France Compounding Chemotherapy Market, 2017-2030 (US$ Bn)
FIG. 35 U.K. Compounding Chemotherapy Market, 2017-2030 (US$ Bn)
FIG. 36 Italy Compounding Chemotherapy Market, 2017-2030 (US$ Bn)
FIG. 37 Spain Compounding Chemotherapy Market, 2017-2030 (US$ Bn)
FIG. 38 Rest of Europe Compounding Chemotherapy Market, 2017-2030 (US$ Bn)
FIG. 39 Asia Pacific Compounding Chemotherapy Market, 2017-2030 (US$ Bn)
FIG. 40 China Compounding Chemotherapy Market, 2017-2030 (US$ Bn)
FIG. 41 Japan Compounding Chemotherapy Market, 2017-2030 (US$ Bn)
FIG. 42 India Compounding Chemotherapy Market, 2017-2030 (US$ Bn)
FIG. 43 South Korea Compounding Chemotherapy Market, 2017-2030 (US$ Bn)
FIG. 44 South-East Asia Compounding Chemotherapy Market, 2017-2030 (US$ Bn)
FIG. 45 Rest of Asia Pacific Compounding Chemotherapy Market, 2017-2030 (US$ Bn)
FIG. 46 Latin America Compounding Chemotherapy Market, 2017-2030 (US$ Bn)
FIG. 47 Brazil Compounding Chemotherapy Market, 2017-2030 (US$ Bn)
FIG. 48 Mexico Compounding Chemotherapy Market, 2017-2030 (US$ Bn)
FIG. 49 Rest of Latin America Compounding Chemotherapy Market, 2017-2030 (US$ Bn)
FIG. 50 Middle East & Africa Compounding Chemotherapy Market, 2017-2030 (US$ Bn)
FIG. 51 GCC Countries Compounding Chemotherapy Market, 2017-2030 (US$ Bn)
FIG. 52 South Africa Compounding Chemotherapy Market, 2017-2030 (US$ Bn)
FIG. 53 Rest of Middle East and Africa Compounding Chemotherapy Market, 2017-2030 (US$ Bn)

List of Tables
TABLE 1 Market Snapshot: Global Compounding Chemotherapy Market
TABLE 2 Global Compounding Chemotherapy Market: Market Drivers Impact Analysis
TABLE 3 Global Compounding Chemotherapy Market: Market Restraints Impact Analysis
TABLE 4 Global Compounding Chemotherapy Market, by Competitive Benchmarking, 2022
TABLE 5 Global Compounding Chemotherapy Market, by Geographical Presence Analysis, 2022
TABLE 6 Global Compounding Chemotherapy Market, by Key Strategies Analysis, 2022
TABLE 7 Global Compounding Chemotherapy Market, by Chemotherapeutic, By Region, 2017-2022 (US$ Bn)
TABLE 8 Global Compounding Chemotherapy Market, by Chemotherapeutic, By Region, 2023-2030 (US$ Bn)
TABLE 9 Global Compounding Chemotherapy Market, by Non-chemotherapeutic, By Region, 2017-2022 (US$ Bn)
TABLE 10 Global Compounding Chemotherapy Market, by Non-chemotherapeutic, By Region, 2023-2030 (US$ Bn)
TABLE 11 Global Compounding Chemotherapy Market, by Pharmaceutical Ingredient Alteration, By Region, 2017-2022 (US$ Bn)
TABLE 12 Global Compounding Chemotherapy Market, by Pharmaceutical Ingredient Alteration, By Region, 2023-2030 (US$ Bn)
TABLE 13 Global Compounding Chemotherapy Market, by Pharmaceutical Dosage Alteration, By Region, 2017-2022 (US$ Bn)
TABLE 14 Global Compounding Chemotherapy Market, by Pharmaceutical Dosage Alteration, By Region, 2023-2030 (US$ Bn)
TABLE 15 Global Compounding Chemotherapy Market, by Others, By Region, 2017-2022 (US$ Bn)
TABLE 16 Global Compounding Chemotherapy Market, by Others, By Region, 2023-2030 (US$ Bn)
TABLE 17 Global Compounding Chemotherapy Market, by Gravimetric Automated Compounding Device, By Region, 2017-2022 (US$ Bn)
TABLE 18 Global Compounding Chemotherapy Market, by Gravimetric Automated Compounding Device, By Region, 2023-2030 (US$ Bn)
TABLE 19 Global Compounding Chemotherapy Market, by Volumetric Automated Compounding Device, By Region, 2017-2022 (US$ Bn)
TABLE 20 Global Compounding Chemotherapy Market, by Volumetric Automated Compounding Device, By Region, 2023-2030 (US$ Bn)
TABLE 21 Global Compounding Chemotherapy Market, by With Robotic Arm, By Region, 2017-2022 (US$ Bn)
TABLE 22 Global Compounding Chemotherapy Market, by With Robotic Arm, By Region, 2023-2030 (US$ Bn)
TABLE 23 Global Compounding Chemotherapy Market, by Without Robotic Arm, By Region, 2017-2022 (US$ Bn)
TABLE 24 Global Compounding Chemotherapy Market, by Without Robotic Arm, By Region, 2023-2030 (US$ Bn)
TABLE 25 Global Compounding Chemotherapy Market, by Dose Type, 2017-2022 (US$ Bn)
TABLE 26 Global Compounding Chemotherapy Market, by Dose Type, 2023-2030 (US$ Bn)
TABLE 27 Global Compounding Chemotherapy Market, by Compounding Type, 2017-2022 (US$ Bn)
TABLE 28 Global Compounding Chemotherapy Market, by Compounding Type, 2023-2030 (US$ Bn)
TABLE 29 Global Compounding Chemotherapy Market, by Delivery Method, 2017-2022 (US$ Bn)
TABLE 30 Global Compounding Chemotherapy Market, by Delivery Method, 2023-2030 (US$ Bn)
TABLE 31 Global Compounding Chemotherapy Market, by Technology, 2017-2022 (US$ Bn)
TABLE 32 Global Compounding Chemotherapy Market, by Technology, 2023-2030 (US$ Bn)
TABLE 33 Global Compounding Chemotherapy Market, by Region, 2017-2022 (US$ Bn)
TABLE 34 Global Compounding Chemotherapy Market, by Region, 2023-2030 (US$ Bn)
TABLE 35 North America Compounding Chemotherapy Market, by Dose Type, 2017-2022 (US$ Bn)
TABLE 36 North America Compounding Chemotherapy Market, by Dose Type, 2023-2030 (US$ Bn)
TABLE 37 North America Compounding Chemotherapy Market, by Compounding Type, 2017-2022 (US$ Bn)
TABLE 38 North America Compounding Chemotherapy Market, by Compounding Type, 2023-2030 (US$ Bn)
TABLE 39 North America Compounding Chemotherapy Market, by Delivery Method, 2017-2022 (US$ Bn)
TABLE 40 North America Compounding Chemotherapy Market, by Delivery Method, 2023-2030 (US$ Bn)
TABLE 41 North America Compounding Chemotherapy Market, by Technology, 2017-2022 (US$ Bn)
TABLE 42 North America Compounding Chemotherapy Market, by Technology, 2023-2030 (US$ Bn)
TABLE 43 North America Compounding Chemotherapy Market, by Country, 2017-2022 (US$ Bn)
TABLE 44 North America Compounding Chemotherapy Market, by Country, 2023-2030 (US$ Bn)
TABLE 45 United States Compounding Chemotherapy Market, by Dose Type, 2017-2022 (US$ Bn)
TABLE 46 United States Compounding Chemotherapy Market, by Dose Type, 2023-2030 (US$ Bn)
TABLE 47 United States Compounding Chemotherapy Market, by Compounding Type, 2017-2022 (US$ Bn)
TABLE 48 United States Compounding Chemotherapy Market, by Compounding Type, 2023-2030 (US$ Bn)
TABLE 49 United States Compounding Chemotherapy Market, by Delivery Method, 2017-2022 (US$ Bn)
TABLE 50 United States Compounding Chemotherapy Market, by Delivery Method, 2023-2030 (US$ Bn)
TABLE 51 United States Compounding Chemotherapy Market, by Technology, 2017-2022 (US$ Bn)
TABLE 52 United States Compounding Chemotherapy Market, by Technology, 2023-2030 (US$ Bn)
TABLE 53 Canada Compounding Chemotherapy Market, by Dose Type, 2017-2022 (US$ Bn)
TABLE 54 Canada Compounding Chemotherapy Market, by Dose Type, 2023-2030 (US$ Bn)
TABLE 55 Canada Compounding Chemotherapy Market, by Compounding Type, 2017-2022 (US$ Bn)
TABLE 56 Canada Compounding Chemotherapy Market, by Compounding Type, 2023-2030 (US$ Bn)
TABLE 57 Canada Compounding Chemotherapy Market, by Delivery Method, 2017-2022 (US$ Bn)
TABLE 58 Canada Compounding Chemotherapy Market, by Delivery Method, 2023-2030 (US$ Bn)
TABLE 59 Canada Compounding Chemotherapy Market, by Technology, 2017-2022 (US$ Bn)
TABLE 60 Canada Compounding Chemotherapy Market, by Technology, 2023-2030 (US$ Bn)
TABLE 61 Mexico Compounding Chemotherapy Market, by Dose Type, 2017-2022 (US$ Bn)
TABLE 62 Mexico Compounding Chemotherapy Market, by Dose Type, 2023-2030 (US$ Bn)
TABLE 63 Mexico Compounding Chemotherapy Market, by Compounding Type, 2017-2022 (US$ Bn)
TABLE 64 Mexico Compounding Chemotherapy Market, by Compounding Type, 2023-2030 (US$ Bn)
TABLE 65 Mexico Compounding Chemotherapy Market, by Delivery Method, 2017-2022 (US$ Bn)
TABLE 66 Mexico Compounding Chemotherapy Market, by Delivery Method, 2023-2030 (US$ Bn)
TABLE 67 Mexico Compounding Chemotherapy Market, by Technology, 2017-2022 (US$ Bn)
TABLE 68 Mexico Compounding Chemotherapy Market, by Technology, 2023-2030 (US$ Bn)
TABLE 69 Europe Compounding Chemotherapy Market, by Dose Type, 2017-2022 (US$ Bn)
TABLE 70 Europe Compounding Chemotherapy Market, by Dose Type, 2023-2030 (US$ Bn)
TABLE 71 Europe Compounding Chemotherapy Market, by Compounding Type, 2017-2022 (US$ Bn)
TABLE 72 Europe Compounding Chemotherapy Market, by Compounding Type, 2023-2030 (US$ Bn)
TABLE 73 Europe Compounding Chemotherapy Market, by Delivery Method, 2017-2022 (US$ Bn)
TABLE 74 Europe Compounding Chemotherapy Market, by Delivery Method, 2023-2030 (US$ Bn)
TABLE 75 Europe Compounding Chemotherapy Market, by Technology, 2017-2022 (US$ Bn)
TABLE 76 Europe Compounding Chemotherapy Market, by Technology, 2023-2030 (US$ Bn)
TABLE 77 Europe Compounding Chemotherapy Market, by Country, 2017-2022 (US$ Bn)
TABLE 78 Europe Compounding Chemotherapy Market, by Country, 2023-2030 (US$ Bn)
TABLE 79 Germany Compounding Chemotherapy Market, by Dose Type, 2017-2022 (US$ Bn)
TABLE 80 Germany Compounding Chemotherapy Market, by Dose Type, 2023-2030 (US$ Bn)
TABLE 81 Germany Compounding Chemotherapy Market, by Compounding Type, 2017-2022 (US$ Bn)
TABLE 82 Germany Compounding Chemotherapy Market, by Compounding Type, 2023-2030 (US$ Bn)
TABLE 83 Germany Compounding Chemotherapy Market, by Delivery Method, 2017-2022 (US$ Bn)
TABLE 84 Germany Compounding Chemotherapy Market, by Delivery Method, 2023-2030 (US$ Bn)
TABLE 85 Germany Compounding Chemotherapy Market, by Technology, 2017-2022 (US$ Bn)
TABLE 86 Germany Compounding Chemotherapy Market, by Technology, 2023-2030 (US$ Bn)
TABLE 87 France Compounding Chemotherapy Market, by Dose Type, 2017-2022 (US$ Bn)
TABLE 88 France Compounding Chemotherapy Market, by Dose Type, 2023-2030 (US$ Bn)
TABLE 89 France Compounding Chemotherapy Market, by Compounding Type, 2017-2022 (US$ Bn)
TABLE 90 France Compounding Chemotherapy Market, by Compounding Type, 2023-2030 (US$ Bn)
TABLE 91 France Compounding Chemotherapy Market, by Delivery Method, 2017-2022 (US$ Bn)
TABLE 92 France Compounding Chemotherapy Market, by Delivery Method, 2023-2030 (US$ Bn)
TABLE 93 France Compounding Chemotherapy Market, by Technology, 2017-2022 (US$ Bn)
TABLE 94 France Compounding Chemotherapy Market, by Technology, 2023-2030 (US$ Bn)
TABLE 95 United Kingdom Compounding Chemotherapy Market, by Dose Type, 2017-2022 (US$ Bn)
TABLE 96 United Kingdom Compounding Chemotherapy Market, by Dose Type, 2023-2030 (US$ Bn)
TABLE 97 United Kingdom Compounding Chemotherapy Market, by Compounding Type, 2017-2022 (US$ Bn)
TABLE 98 United Kingdom Compounding Chemotherapy Market, by Compounding Type, 2023-2030 (US$ Bn)
TABLE 99 United Kingdom Compounding Chemotherapy Market, by Delivery Method, 2017-2022 (US$ Bn)
TABLE 100 United Kingdom Compounding Chemotherapy Market, by Delivery Method, 2023-2030 (US$ Bn)
TABLE 101 United Kingdom Compounding Chemotherapy Market, by Technology, 2017-2022 (US$ Bn)
TABLE 102 United Kingdom Compounding Chemotherapy Market, by Technology, 2023-2030 (US$ Bn)
TABLE 103 Italy Compounding Chemotherapy Market, by Dose Type, 2017-2022 (US$ Bn)
TABLE 104 Italy Compounding Chemotherapy Market, by Dose Type, 2023-2030 (US$ Bn)
TABLE 105 Italy Compounding Chemotherapy Market, by Compounding Type, 2017-2022 (US$ Bn)
TABLE 106 Italy Compounding Chemotherapy Market, by Compounding Type, 2023-2030 (US$ Bn)
TABLE 107 Italy Compounding Chemotherapy Market, by Delivery Method, 2017-2022 (US$ Bn)
TABLE 108 Italy Compounding Chemotherapy Market, by Delivery Method, 2023-2030 (US$ Bn)
TABLE 109 Italy Compounding Chemotherapy Market, by Technology, 2017-2022 (US$ Bn)
TABLE 110 Italy Compounding Chemotherapy Market, by Technology, 2023-2030 (US$ Bn)
TABLE 111 Spain Compounding Chemotherapy Market, by Dose Type, 2017-2022 (US$ Bn)
TABLE 112 Spain Compounding Chemotherapy Market, by Dose Type, 2023-2030 (US$ Bn)
TABLE 113 Spain Compounding Chemotherapy Market, by Compounding Type, 2017-2022 (US$ Bn)
TABLE 114 Spain Compounding Chemotherapy Market, by Compounding Type, 2023-2030 (US$ Bn)
TABLE 115 Spain Compounding Chemotherapy Market, by Delivery Method, 2017-2022 (US$ Bn)
TABLE 116 Spain Compounding Chemotherapy Market, by Delivery Method, 2023-2030 (US$ Bn)
TABLE 117 Spain Compounding Chemotherapy Market, by Technology, 2017-2022 (US$ Bn)
TABLE 118 Spain Compounding Chemotherapy Market, by Technology, 2023-2030 (US$ Bn)
TABLE 119 Rest of Europe Compounding Chemotherapy Market, by Dose Type, 2017-2022 (US$ Bn)
TABLE 120 Rest of Europe Compounding Chemotherapy Market, by Dose Type, 2023-2030 (US$ Bn)
TABLE 121 Rest of Europe Compounding Chemotherapy Market, by Compounding Type, 2017-2022 (US$ Bn)
TABLE 122 Rest of Europe Compounding Chemotherapy Market, by Compounding Type, 2023-2030 (US$ Bn)
TABLE 123 Rest of Europe Compounding Chemotherapy Market, by Delivery Method, 2017-2022 (US$ Bn)
TABLE 124 Rest of Europe Compounding Chemotherapy Market, by Delivery Method, 2023-2030 (US$ Bn)
TABLE 125 Rest of Europe Compounding Chemotherapy Market, by Technology, 2017-2022 (US$ Bn)
TABLE 126 Rest of Europe Compounding Chemotherapy Market, by Technology, 2023-2030 (US$ Bn)
TABLE 127 Asia Pacific Compounding Chemotherapy Market, by Dose Type, 2017-2022 (US$ Bn)
TABLE 128 Asia Pacific Compounding Chemotherapy Market, by Dose Type, 2023-2030 (US$ Bn)
TABLE 129 Asia Pacific Compounding Chemotherapy Market, by Compounding Type, 2017-2022 (US$ Bn)
TABLE 130 Asia Pacific Compounding Chemotherapy Market, by Compounding Type, 2023-2030 (US$ Bn)
TABLE 131 Asia Pacific Compounding Chemotherapy Market, by Delivery Method, 2017-2022 (US$ Bn)
TABLE 132 Asia Pacific Compounding Chemotherapy Market, by Delivery Method, 2023-2030 (US$ Bn)
TABLE 133 Asia Pacific Compounding Chemotherapy Market, by Technology, 2017-2022 (US$ Bn)
TABLE 134 Asia Pacific Compounding Chemotherapy Market, by Technology, 2023-2030 (US$ Bn)
TABLE 135 China Compounding Chemotherapy Market, by Dose Type, 2017-2022 (US$ Bn)
TABLE 136 China Compounding Chemotherapy Market, by Dose Type, 2023-2030 (US$ Bn)
TABLE 137 China Compounding Chemotherapy Market, by Compounding Type, 2017-2022 (US$ Bn)
TABLE 138 China Compounding Chemotherapy Market, by Compounding Type, 2023-2030 (US$ Bn)
TABLE 139 China Compounding Chemotherapy Market, by Delivery Method, 2017-2022 (US$ Bn)
TABLE 140 China Compounding Chemotherapy Market, by Delivery Method, 2023-2030 (US$ Bn)
TABLE 141 China Compounding Chemotherapy Market, by Technology, 2017-2022 (US$ Bn)
TABLE 142 China Compounding Chemotherapy Market, by Technology, 2023-2030 (US$ Bn)
TABLE 143 Japan Compounding Chemotherapy Market, by Dose Type, 2017-2022 (US$ Bn)
TABLE 144 Japan Compounding Chemotherapy Market, by Dose Type, 2023-2030 (US$ Bn)
TABLE 145 Japan Compounding Chemotherapy Market, by Compounding Type, 2017-2022 (US$ Bn)
TABLE 146 Japan Compounding Chemotherapy Market, by Compounding Type, 2023-2030 (US$ Bn)
TABLE 147 Japan Compounding Chemotherapy Market, by Delivery Method, 2017-2022 (US$ Bn)
TABLE 148 Japan Compounding Chemotherapy Market, by Delivery Method, 2023-2030 (US$ Bn)
TABLE 149 Japan Compounding Chemotherapy Market, by Technology, 2017-2022 (US$ Bn)
TABLE 150 Japan Compounding Chemotherapy Market, by Technology, 2023-2030 (US$ Bn)
TABLE 151 India Compounding Chemotherapy Market, by Dose Type, 2017-2022 (US$ Bn)
TABLE 152 India Compounding Chemotherapy Market, by Dose Type, 2023-2030 (US$ Bn)
TABLE 153 India Compounding Chemotherapy Market, by Compounding Type, 2017-2022 (US$ Bn)
TABLE 154 India Compounding Chemotherapy Market, by Compounding Type, 2023-2030 (US$ Bn)
TABLE 155 India Compounding Chemotherapy Market, by Delivery Method, 2017-2022 (US$ Bn)
TABLE 156 India Compounding Chemotherapy Market, by Delivery Method, 2023-2030 (US$ Bn)
TABLE 157 India Compounding Chemotherapy Market, by Technology, 2017-2022 (US$ Bn)
TABLE 158 India Compounding Chemotherapy Market, by Technology, 2023-2030 (US$ Bn)
TABLE 159 South Korea Compounding Chemotherapy Market, by Dose Type, 2017-2022 (US$ Bn)
TABLE 160 South Korea Compounding Chemotherapy Market, by Dose Type, 2023-2030 (US$ Bn)
TABLE 161 South Korea Compounding Chemotherapy Market, by Compounding Type, 2017-2022 (US$ Bn)
TABLE 162 South Korea Compounding Chemotherapy Market, by Compounding Type, 2023-2030 (US$ Bn)
TABLE 163 South Korea Compounding Chemotherapy Market, by Delivery Method, 2017-2022 (US$ Bn)
TABLE 164 South Korea Compounding Chemotherapy Market, by Delivery Method, 2023-2030 (US$ Bn)
TABLE 165 South Korea Compounding Chemotherapy Market, by Technology, 2017-2022 (US$ Bn)
TABLE 166 South Korea Compounding Chemotherapy Market, by Technology, 2023-2030 (US$ Bn)
TABLE 167 South-East Asia Compounding Chemotherapy Market, by Dose Type, 2017-2022 (US$ Bn)
TABLE 168 South-East Asia Compounding Chemotherapy Market, by Dose Type, 2023-2030 (US$ Bn)
TABLE 169 South-East Asia Compounding Chemotherapy Market, by Compounding Type, 2017-2022 (US$ Bn)
TABLE 170 South-East Asia Compounding Chemotherapy Market, by Compounding Type, 2023-2030 (US$ Bn)
TABLE 171 South-East Asia Compounding Chemotherapy Market, by Delivery Method, 2017-2022 (US$ Bn)
TABLE 172 South-East Asia Compounding Chemotherapy Market, by Delivery Method, 2023-2030 (US$ Bn)
TABLE 173 South-East Asia Compounding Chemotherapy Market, by Technology, 2017-2022 (US$ Bn)
TABLE 174 South-East Asia Compounding Chemotherapy Market, by Technology, 2023-2030 (US$ Bn)
TABLE 175 Rest of Asia Pacific Compounding Chemotherapy Market, by Dose Type, 2017-2022 (US$ Bn)
TABLE 176 Rest of Asia Pacific Compounding Chemotherapy Market, by Dose Type, 2023-2030 (US$ Bn)
TABLE 177 Rest of Asia Pacific Compounding Chemotherapy Market, by Compounding Type, 2017-2022 (US$ Bn)
TABLE 178 Rest of Asia Pacific Compounding Chemotherapy Market, by Compounding Type, 2023-2030 (US$ Bn)
TABLE 179 Rest of Asia Pacific Compounding Chemotherapy Market, by Delivery Method, 2017-2022 (US$ Bn)
TABLE 180 Rest of Asia Pacific Compounding Chemotherapy Market, by Delivery Method, 2023-2030 (US$ Bn)
TABLE 181 Rest of Asia Pacific Compounding Chemotherapy Market, by Technology, 2017-2022 (US$ Bn)
TABLE 182 Rest of Asia Pacific Compounding Chemotherapy Market, by Technology, 2023-2030 (US$ Bn)
TABLE 183 Latin America Compounding Chemotherapy Market, by Dose Type, 2017-2022 (US$ Bn)
TABLE 184 Latin America Compounding Chemotherapy Market, by Dose Type, 2023-2030 (US$ Bn)
TABLE 185 Latin America Compounding Chemotherapy Market, by Compounding Type, 2017-2022 (US$ Bn)
TABLE 186 Latin America Compounding Chemotherapy Market, by Compounding Type, 2023-2030 (US$ Bn)
TABLE 187 Latin America Compounding Chemotherapy Market, by Delivery Method, 2017-2022 (US$ Bn)
TABLE 188 Latin America Compounding Chemotherapy Market, by Delivery Method, 2023-2030 (US$ Bn)
TABLE 189 Latin America Compounding Chemotherapy Market, by Technology, 2017-2022 (US$ Bn)
TABLE 190 Latin America Compounding Chemotherapy Market, by Technology, 2023-2030 (US$ Bn)
TABLE 191 Brazil Compounding Chemotherapy Market, by Dose Type, 2017-2022 (US$ Bn)
TABLE 192 Brazil Compounding Chemotherapy Market, by Dose Type, 2023-2030 (US$ Bn)
TABLE 193 Brazil Compounding Chemotherapy Market, by Compounding Type, 2017-2022 (US$ Bn)
TABLE 194 Brazil Compounding Chemotherapy Market, by Compounding Type, 2023-2030 (US$ Bn)
TABLE 195 Brazil Compounding Chemotherapy Market, by Delivery Method, 2017-2022 (US$ Bn)
TABLE 196 Brazil Compounding Chemotherapy Market, by Delivery Method, 2023-2030 (US$ Bn)
TABLE 197 Brazil Compounding Chemotherapy Market, by Technology, 2017-2022 (US$ Bn)
TABLE 198 Brazil Compounding Chemotherapy Market, by Technology, 2023-2030 (US$ Bn)
TABLE 199 Argentina Compounding Chemotherapy Market, by Dose Type, 2017-2022 (US$ Bn)
TABLE 200 Argentina Compounding Chemotherapy Market, by Dose Type, 2023-2030 (US$ Bn)
TABLE 201 Argentina Compounding Chemotherapy Market, by Compounding Type, 2017-2022 (US$ Bn)
TABLE 202 Argentina Compounding Chemotherapy Market, by Compounding Type, 2023-2030 (US$ Bn)
TABLE 203 Argentina Compounding Chemotherapy Market, by Delivery Method, 2017-2022 (US$ Bn)
TABLE 204 Argentina Compounding Chemotherapy Market, by Delivery Method, 2023-2030 (US$ Bn)
TABLE 205 Argentina Compounding Chemotherapy Market, by Technology, 2017-2022 (US$ Bn)
TABLE 206 Argentina Compounding Chemotherapy Market, by Technology, 2023-2030 (US$ Bn)
TABLE 207 Rest of Latin America Compounding Chemotherapy Market, by Dose Type, 2017-2022 (US$ Bn)
TABLE 208 Rest of Latin America Compounding Chemotherapy Market, by Dose Type, 2023-2030 (US$ Bn)
TABLE 209 Rest of Latin America Compounding Chemotherapy Market, by Compounding Type, 2017-2022 (US$ Bn)
TABLE 210 Rest of Latin America Compounding Chemotherapy Market, by Compounding Type, 2023-2030 (US$ Bn)
TABLE 211 Rest of Latin America Compounding Chemotherapy Market, by Delivery Method, 2017-2022 (US$ Bn)
TABLE 212 Rest of Latin America Compounding Chemotherapy Market, by Delivery Method, 2023-2030 (US$ Bn)
TABLE 213 Rest of Latin America Compounding Chemotherapy Market, by Technology, 2017-2022 (US$ Bn)
TABLE 214 Rest of Latin America Compounding Chemotherapy Market, by Technology, 2023-2030 (US$ Bn)
TABLE 215 Middle East and Africa Compounding Chemotherapy Market, by Dose Type, 2017-2022 (US$ Bn)
TABLE 216 Middle East and Africa Compounding Chemotherapy Market, by Dose Type, 2023-2030 (US$ Bn)
TABLE 217 Middle East and Africa Compounding Chemotherapy Market, by Compounding Type, 2017-2022 (US$ Bn)
TABLE 218 Middle East and Africa Compounding Chemotherapy Market, by Compounding Type, 2023-2030 (US$ Bn)
TABLE 219 Middle East and Africa Compounding Chemotherapy Market, by Delivery Method, 2017-2022 (US$ Bn)
TABLE 220 Middle East and Africa Compounding Chemotherapy Market, by Delivery Method, 2023-2030 (US$ Bn)
TABLE 221 Middle East and Africa Compounding Chemotherapy Market, by Technology, 2017-2022 (US$ Bn)
TABLE 222 Middle East and Africa Compounding Chemotherapy Market, by Technology, 2023-2030 (US$ Bn)
TABLE 223 GCC Countries Compounding Chemotherapy Market, by Dose Type, 2017-2022 (US$ Bn)
TABLE 224 GCC Countries Compounding Chemotherapy Market, by Dose Type, 2023-2030 (US$ Bn)
TABLE 225 GCC Countries Compounding Chemotherapy Market, by Compounding Type, 2017-2022 (US$ Bn)
TABLE 226 GCC Countries Compounding Chemotherapy Market, by Compounding Type, 2023-2030 (US$ Bn)
TABLE 227 GCC Countries Compounding Chemotherapy Market, by Delivery Method, 2017-2022 (US$ Bn)
TABLE 228 GCC Countries Compounding Chemotherapy Market, by Delivery Method, 2023-2030 (US$ Bn)
TABLE 229 GCC Countries Compounding Chemotherapy Market, by Technology, 2017-2022 (US$ Bn)
TABLE 230 GCC Countries Compounding Chemotherapy Market, by Technology, 2023-2030 (US$ Bn)
TABLE 231 South Africa Compounding Chemotherapy Market, by Dose Type, 2017-2022 (US$ Bn)
TABLE 232 South Africa Compounding Chemotherapy Market, by Dose Type, 2023-2030 (US$ Bn)
TABLE 233 South Africa Compounding Chemotherapy Market, by Compounding Type, 2017-2022 (US$ Bn)
TABLE 234 South Africa Compounding Chemotherapy Market, by Compounding Type, 2023-2030 (US$ Bn)
TABLE 235 South Africa Compounding Chemotherapy Market, by Delivery Method, 2017-2022 (US$ Bn)
TABLE 236 South Africa Compounding Chemotherapy Market, by Delivery Method, 2023-2030 (US$ Bn)
TABLE 237 South Africa Compounding Chemotherapy Market, by Technology, 2017-2022 (US$ Bn)
TABLE 238 South Africa Compounding Chemotherapy Market, by Technology, 2023-2030 (US$ Bn)
TABLE 239 Rest of Middle East and Africa Compounding Chemotherapy Market, by Dose Type, 2017-2022 (US$ Bn)
TABLE 240 Rest of Middle East and Africa Compounding Chemotherapy Market, by Dose Type, 2023-2030 (US$ Bn)
TABLE 241 Rest of Middle East and Africa Compounding Chemotherapy Market, by Compounding Type, 2017-2022 (US$ Bn)
TABLE 242 Rest of Middle East and Africa Compounding Chemotherapy Market, by Compounding Type, 2023-2030 (US$ Bn)
TABLE 243 Rest of Middle East and Africa Compounding Chemotherapy Market, by Delivery Method, 2017-2022 (US$ Bn)
TABLE 244 Rest of Middle East and Africa Compounding Chemotherapy Market, by Delivery Method, 2023-2030 (US$ Bn)
TABLE 245 Rest of Middle East and Africa Compounding Chemotherapy Market, by Technology, 2017-2022 (US$ Bn)
TABLE 246 Rest of Middle East and Africa Compounding Chemotherapy Market, by Technology, 2023-2030 (US$ Bn)

Frequently Asked Questions

What is the current size of the global compounding chemotherapy market?

The global compounding chemotherapy market was valued at USD 0.6 Billion in 2022.

What is the anticipated growth rate of the compounding chemotherapy market between 2023 and 2030?

The compounding chemotherapy market is anticipated to grow at a CAGR of 6.3% between 2023 and 2030, reaching USD 0.92 Billion in 2030.

Which segment is leading the market share in terms of dose type?

Chemotherapeutic is the leading segment by dose type, holding over 62% share in terms of value in 2022.

Which compounding type segment governs the global demand for compounding chemotherapy?

The pharmaceutical dosage alteration (PDA) segment governs the demand for compounding chemotherapy worldwide, holding a massive share of over 68% in 2022.

Which delivery method segment is estimated to post the highest CAGR during the forecast period?

The gravimetric automated compounding device segment will post the highest CAGR in the projected period.

Which region is fuelling the growth of the compounding chemotherapy industry?

Asia Pacific is fuelling the rapid growth of the compounding chemotherapy industry, with an over one-third share in 2022.

Who are the major global compounding chemotherapy market players?

The top players include Omnicell Inc, Dedalus S.P.A., Baxter International Inc, and Equashield LLC. Other major players include Pfizer Inc, Metrix Company S.A., Icon Group, and Loccioni Group.

What are the major market drivers of the compounding chemotherapy industry?

The increasing prevalence of cancer, developments in chemotherapy medications and technologies, and the growing demands for personalized and targeted cancer therapies are the primary market drivers of the compounding chemotherapy industry.

What are the major market restraints of the compounding chemotherapy industry?

The major market restraints of the compounding chemotherapy industry include stringent regulatory requirements, the high cost of chemotherapy treatments, and the potential side effects and toxicity of chemotherapy drugs.

What are the major market opportunities of the compounding chemotherapy industry?

The major market opportunities in the compounding chemotherapy industry include the development of novel chemotherapy formulations and delivery methods, the integration of precision medicine approaches, and the expanding healthcare infrastructure in emerging markets.

Mammography Market

Published:
Report ID: 37075

Temperature Controlled Pharma Packaging Solutions Market

Published:
Report ID: 20599

Vietnam Pneumococcal Vaccine Market

Published:
Report ID: 37015

Head and Neck Cancer Market

Published:
Report ID: 36992

Disposable Surgical Devices Market

Published:
Report ID: 36989

Ophthalmoscopes Market

Published:
Report ID: 36972

Japan Restorative Dentistry Market

Published:
Report ID: 36960

India Traditional Medicine Market

Published:
Report ID: 36954

India Restorative Dentistry Market

Published:
Report ID: 36951

Wearable Injectors Market

Published:
Report ID: 36911

Maternity and Nursing Bras Market

Published:
Report ID: 36899

India Cancer Immunotherapy Market

Published:
Report ID: 36893

Purchase Options

$2999
Delivery Format: Excel.
$4999
Designed for the individual purchaser.
$6999
Users located at a single corporate site or regional office.
$7999
Allowed for unlimited sharing globally within one company.
Smallform of Sample request

Have a question?

User Profile

Don’t settle for less – trust Mitul to help you find the best solution.

Report delivery within 24 to 48 hours

– Other Info –

What people say?-

User Review

I am very impressed with the information in this report. The author clearly did their research when they came up with this product and it has already given me a lot of ideas.

Jana Schmidt
CEDAR CX Technologies

– Connect with us –

Phone

+91 6232 49 3207


support

24/7 Research Support


sales@credenceresearch.com

– Research Methodology –

Going beyond the basics: advanced techniques in research methodology

– Trusted By –

Pepshi, LG, Nestle
Motorola, Honeywell, Johnson and johnson
LG Chem, SIEMENS, Pfizer
Unilever, Samsonite, QIAGEN