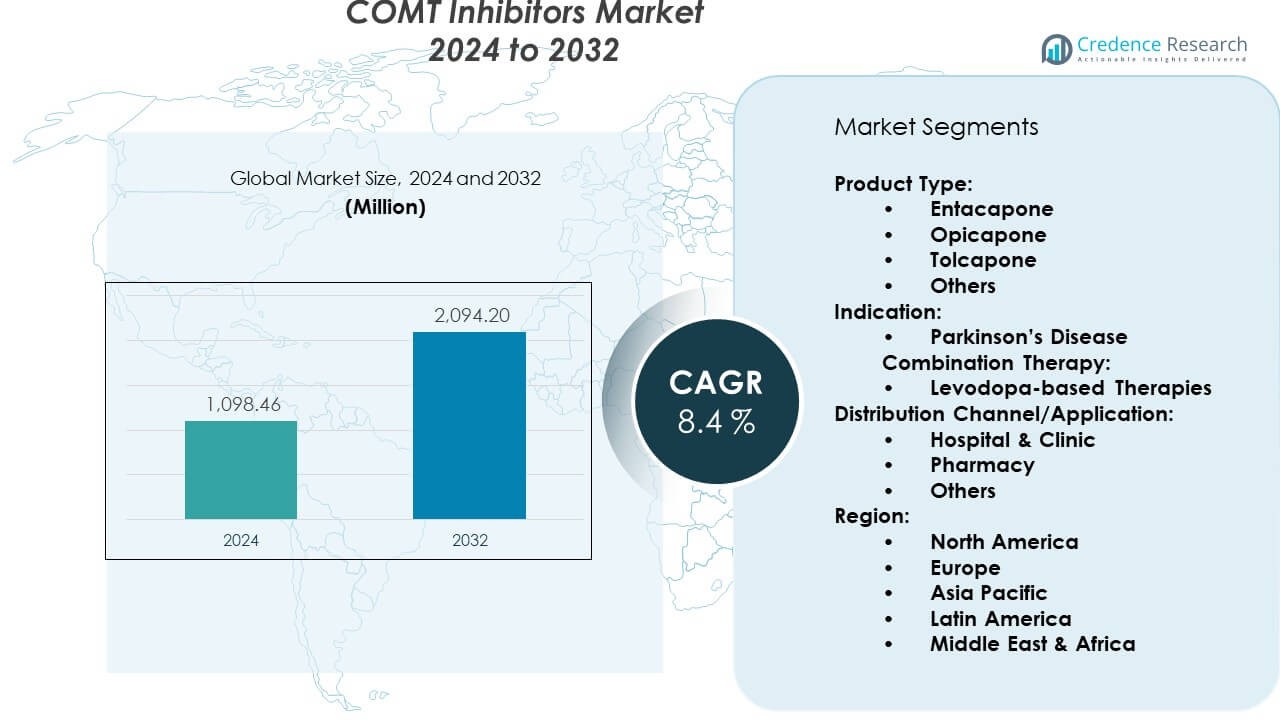
Home » Healthcare » COMT Inhibitors Market

COMT Inhibitors Market By Product Type (Tolcapone, Entacapone, Opicapone, Others) By Indication (Parkinson’s Disease, Other Conditions)-Growth, Future Prospects & Competitive Analysis, 2016 – 2030

Price: $4999

Published: | Report ID: 22392 | Report Format : PDF

Executive Summary

Market Definition

Catechol-O-methyltransferase inhibitors, often known as COMT inhibitors, are a group of pharmaceuticals used to treat a variety of medical diseases, especially those that affect the central nervous system. These inhibitors function by concentrating on and suppressing the activity of the COMT enzyme, which is essential for the metabolism and breakdown of catecholamines like dopamine, adrenaline, and norepinephrine.

Market Overview

The market for COMT inhibitors has been expanding steadily in recent years, and between 2023 and 2030, it is anticipated to rise at a CAGR of 8.60%. The market was estimated to be worth USD 948.5 million in 2022, and it is anticipated to be worth USD 1835.16 million in 2030.

The COMT Inhibitors Industry is expanding as a result of an aging population and improvements in the creation of medications. Although Parkinson’s illness is becoming more common among older people, consumer interest in medicines like COMT inhibitors is projected to rise as the world’s population increases. Tremors or shaking were a PD-related symptom that was experienced by 73% of males and 68% of women. Parkinson’s disease, a degenerative disorder, affects the brain’s nerve cells that produce dopamine. It also results in speech abnormalities, tremors, and problems with the muscles.

The global COMT inhibitors sector is growing due to the presence of major players in the market, such as Teva Pharmaceuticals. A multinational pharmaceutical corporation with operations all over the world, Teva Pharmaceutical Industries Ltd. is based in Israel.  It has developed into one of the biggest producers of generic drugs worldwide and a significant player in the global pharmaceutical sector.

Teva makes major investments in R&D to create new medications, enhance existing formulations, and broaden its product line. They have facilities for finding new drugs and conducting innovative research. The Parkinson’s disease treatment “Azilect” (generic name rasagiline) is offered by Teva Pharmaceutical Industries, a multinational pharmaceutical business. Parkinson’s disease is managed with the use of the drug azilect. It is a member of the group of medications known as monoamine oxidase inhibitors (MAO-B inhibitors), which act by raising the levels of a few neurotransmitters in the brain to aid individuals with Parkinson’s disease with their motor symptoms.

COMT inhibitors market (1)

Market Insights

  • The global demand for COMT inhibitors was valued at USD 948.5 million in 2022 and is expected to reach USD 1835.16 million in 2030, growing at a CAGR of 8.60% between 2023 and 2030.
  • Tolcapone is the leading segment by product type. The entacapone segment, on the other hand, is expected to grow at a strong CAGR.
  • The leading indication segment is Parkinson’s disease.
  • The CAGR for hospital pharmacies is expected to be the highest during the projection period.
  • During the forecast time frame, the adult category is likely to have the highest CAGR.
  • During the forecast period, levodopa is estimated to have the greatest CAGR.
  • North America dominated the COMT inhibitors market.
  • Europe is predicted to be the second-largest region in the COMT inhibitors market.
  • In the market for COMT inhibitors, Asia Pacific is anticipated to grow at the fastest rate.
  • The industry is expanding as a result of increased usage of COMT inhibitors for treating both the symptoms of schizophrenia and mood disorders as well as restless legs syndrome.
  • The biggest opportunities for market potential are integrating digital health solutions for patient interaction and data collecting, and establishing strategic collaborations with healthcare organizations and providers around the world.
Design Element 2

Access crucial information at unmatched prices!

Request your free sample report today & start making informed decisions powered by Credence Research!

Download Free Sample
CTA Design Element 3

Segmentation Analysis:

Segmentation by Product Type

  • By the product type, tolcapone is the market leader. Parkinson’s disease patients who experience changes in their response to levodopa-carbidopa therapy frequently utilize tolcapone.
  • During the projected period, the entacapone category is anticipated to exhibit a sizable CAGR. The physical symptoms of Parkinson’s disease can be effectively treated with entacapone in conjunction with levodopa and carbidopa, especially when patients’ responses to levodopa are inconsistent.
  • Other product types, such as opicapone and others, also contribute to the demand for COMT inhibitors.

Segmentation by Indication

  • The main indication category is Parkinson’s disease. A neurodegenerative condition that largely affects mobility is Parkinson’s disease. It is a chronic, progressing disorder, thus with time, the symptoms get worse.
  • Other indicators, such as other conditions, also drive the need for COMT inhibitors.

Segmentation by Distribution Channel

  • The category for hospital pharmacies is anticipated to experience the highest CAGR during the projection period. Hospital pharmacists are in charge of overseeing a broad range of pharmaceuticals utilized inside the facility. This includes obtaining, keeping, and managing a stock of medications. They also keep an eye on how old or unused drugs are disposed of properly.
  • Other distribution channels, such as retail pharmacies, online pharmacies, and specialty clinics, also contribute to the demand for COMT inhibitors.

Segmentation by Age Group

  • During the projection period, the adult category is likely to have the highest CAGR. Inhibitors of catechol-O-methyltransferase (COMT) are a class of drugs predominantly used to treat adult patients with Parkinson’s disorder.

Segmentation by Combination Therapy

  • Levodopa will be expected to have the foremost CAGR during the prediction period. Levodopa therapy’s main objective is to raise dopamine levels in the brain, which helps reduce motor symptoms and enhance motor performance.
  • Other combination therapies, such as monotherapy, also contribute to the demand for COMT inhibitors.

Segmentation by Region

  • The COMT inhibitors market was led by North America. The movement towards patient-centered care in North America emphasizes adjusting therapy regimens to meet the requirements of specific patients. COMT inhibitors give medical professionals another tool for individualized care, which might encourage their use.
  • Europe is estimated to rank second in terms of market size for COMT inhibitors.
  • Asi Pacific will witness the most rapid growth in the COMT inhibitors market.
  • The rest of the world, including Latin America, the Middle East, and Africa, meets the rest of the COMT inhibitor demand.

COMT inhibitors market regional (1)

Wider availability and uptake of cutting-edge treatments like COMT inhibitors can be attributed to increased healthcare spending in many locations, particularly emerging economies.

During the time of forecasting, North America will probably rule the COMT Inhibitors market. By 2030, it is estimated that 1.2 million Americans will have Parkinson’s disease, according to the National Institute of Health. New Parkinson’s disease therapies are being developed by a number of biopharmaceutical businesses and research institutions. For example, more than 40 medications are being developed in the US to treat Parkinson’s disease, many of which have been given fast-track status by the USFDA.

The Asia Pacific area is projected to show the fastest growth throughout the forecast time frame. In several Asia Pacific nations, the COVID-19 pandemic has pushed the use of telemedicine and remote medical consultations. This has made it easier for people with Parkinson’s disease to get specialized care and get COMT inhibitor prescriptions.

It may have become more common to monitor and manage Parkinson’s disease symptoms using digital health tools like smartphone applications and wearable technology, which may have an impact on COMT inhibitor therapy choices.

COMT inhibitor availability and awareness may have increased as a result of foreign pharmaceutical companies entering the Indonesian market and forming alliances with regional businesses.

Key Highlights of the Report

The global COMT inhibitors market is segmented by product type, indication, distribution channel, age group, combination therapy, and region. As far as the product type is concerned, tolcapone is the market spearhead. Parkinson’s disease is the top indication segment. During the forecast period, the hospital pharmacies category is expected to grow at the highest CAGR. The category for adults is anticipated to experience the highest CAGR during the forecast period. North America is driving the COMT inhibitors market growth.

The significant factors anticipated to support the expansion of the COMT inhibitors market are patient awareness, education, and patent expiration. When COMT inhibitors’ patents expire, generic versions of the drugs may enter the market, potentially boosting competition and driving down drug costs.

However, according to forecasts, North America will hold the largest share of the market for COMT inhibitors globally. The increased demand for Parkinson’s disease treatments in North America is mostly due to the region’s well-developed healthcare system and easier access to medications. Additionally, the Asia-Pacific (APAC) region is assumed to have the market’s sharpest growth. Parkinson’s disorder and its treatment-related clinical studies and trials have picked up steam in the Asia Pacific region. This has influenced the use of COMT inhibitors and other drugs in clinical practice by improving the awareness of their efficacy and safety.

Which Key Factors Are Driving The Global COMT Inhibitors Market?

Increasing lifespans and advancements in the development of drugs are contributing to growth in the COMT Inhibitors market. Despite the fact that Parkinson’s disease is becoming increasingly prevalent in older individuals, the growing global audience is expected to enhance consumer interest in medications like COMT inhibitors.

What Are The Key Challenges In The Global Market For COMT Inhibitors?

The difficulties preventing the expansion of the market for COMT inhibitors include clinical trial challenges, generic competition, and limited indications.

What Market Opportunities Exist For COMT Inhibitors Globally?

Opportunities for the COMT inhibitors market can be created by investigating possibilities for the creation and marketing of biosimilar COMT inhibitors as well as by creating rehabilitation initiatives and medical devices to supplement pharmacological therapy.

Market Drivers

Several factors influence the market for COMT inhibitors globally. The main factors influencing the market for COMT inhibitors globally are as follows:

Increasing Parkinson’s Disease Prevalence

The market for COMT inhibitors is expanding significantly as a result of the rising frequency of Parkinson’s disease.  Parkinson’s disease is more prevalent among older people, and as the world’s population ages, more people will likely be diagnosed with the condition. A growing market for medicines used in its management, particularly COMT inhibitors, is created by this expanding patient population. Parkinson’s disease must be managed over the long term because it is a chronic disorder. For patients to adequately regulate their symptoms, many different drugs are required. COMT inhibitors are an essential component of long-term therapy strategies since they are utilized as adjunct therapies in addition to other medicines.

Parkinson’s disease has been diagnosed and treated sooner due to increased public and professional knowledge of the condition. As a result, more people are being diagnosed with the disorder and receiving treatment, which raises the need for COMT inhibitors and other drugs for Parkinson’s disease.

Market Restraints

Several challenges could prevent the expansion of the global market for COMT Inhibitors. Among them are the following:

High Cost of Medications

The COMT Inhibitors market is significantly constrained by the high cost of pharmaceuticals, especially COMT (Catechol-O-methyltransferase) inhibitors. High drug costs might put patients at a financial disadvantage, especially those without sufficient insurance or those who reside in areas with a shortage of healthcare resources. By reducing the patient base for COMT inhibitors, this restricted access may hinder market expansion. Patients who struggle to pay for pricey medications may follow their treatment plans less religiously. COMT inhibitors can have a negative impact on treatment outcomes and patient well-being if they are used inconsistently or stopped altogether for financial reasons.

Opportunities

The global market for COMT inhibitors presents significant potential opportunities. The following is an example of these:

Growing Consumer Knowledge of COMT Inhibitors as a Therapy Option for Parkinson’s Disease

Early recognition and therapy of Parkinson’s disease may result from greater knowledge of its symptoms. By correctly controlling symptoms, early treatment with drugs like COMT inhibitors can help patients live better lives. Informing patients and their carers about the many treatment options, including the advantages and potential negative effects of COMT inhibitors, can enable them to make wise healthcare decisions.  There may be stigma and misunderstandings surrounding Parkinson’s illness. By promoting understanding of the problem and lowering stigma, raising awareness can motivate people to seek appropriate medical guidance and care. Organizations that support and advocate for patients can make a big difference in spreading knowledge about Parkinson’s disease and treatment options. These organizations frequently offer patients and their families useful tools and information.

Competitive Landscape

COMT inhibitors market competitive (1)

Key Players

The global market for COMT inhibitors is very competitive, with many powerful players. Some of the leading market participants and their corresponding market shares are listed below:

  • Orion Corporation
  • Roche
  • AbbVie Inc.
  • Acadia Pharmaceuticals
  • Amneal Pharmaceutical
  • UCB
  • Teva Pharmaceutical
  • Novartis AG
  • Lundbeck A/S
  • Others

These companies give mergers and acquisitions, expanding their distribution network, and developing new products a priority in order to remain competitive in the market.

The leading competitors in the global market for COMT Inhibitors are constantly looking for ways to get an advantage by releasing new items and advancements.

In July 2022, Orion and MSD announced a global partnership for the development and commercialization of ODM-208, an experimental steroid synthesis inhibitor for the treatment of metastatic castration-resistant prostate cancer.

In May 2021, The U.S. Food and Drug Administration (FDA) authorized PharmaTher’s investigational new drug (IND) for ketamine as a treatment for levodopa-induced dyskinesia in Parkinson’s disease patients. Additionally, with this permission, PharmaTher will be able to move forward with the phase II clinical research to examine low-dose ketamine.

Shape Your Report to Specific Countries or Regions & Enjoy 30% Off!

Summary of Key Findings

  • The COMT inhibitors industry will continue to grow as a result of patient knowledge, instruction, and product termination.
  • Market segmented by product type, indication, distribution channel, age group, combination therapy, and region.
  • A product type that is leading the market is tolcapone.
  • The most ubiquitous indication fragment is Parkinson’s disease.
  • In terms of CAGR, hospital pharmacies are expected to grow at the fastest rate during the forecast period.
  • The category for adults will likely see the highest CAGR during the anticipated time frame.
  • North America is leading market development; the market is highly competitive with key players including Orion Corporation, Roche, AbbVie Inc., Acadia Pharmaceuticals, Amneal Pharmaceutical, UCB, Teva Pharmaceutical, Novartis AG, Lundbeck A/S, and others.

Future Outlook

  • Optimistic viewpoint for the global COMT inhibitors market with noteworthy growth potential in the North American region.
  • One of the main factors supporting the growth of the COMT Inhibitors market is the growing Parkinson’s disease incidence.
  • A significant barrier to the market’s growth during the foreseeable period may be the expensive nature of drugs.
  • Foremost companies must concentrate on product innovation, expanding their market reach, and maintaining competitive pricing to stay ahead.

Segmentation

  • By Product Type
    • Tolcapone
    • Entacapone
    • Opicapone
    • Others
  • By Indication
    • Parkinson’s Disease
    • Other Conditions
  • By Distribution Channel
    • Hospital Pharmacies
    • Retail Pharmacies
    • Online Pharmacies
    • Specialty Clinics
  • By Age Group
    • Adult
  • By Combination Therapy
    • With Levodopa
    • Monotherapy
  • By Region
    • North America
      • The US.
      • Canada
      • Mexico
    • Europe
      • Germany
      • France
      • The U.K.
      • Italy
      • Spain
      • Rest of Europe
    • Asia Pacific
      • China
      • Japan
      • India
      • South Korea
      • South-east Asia
      • Rest of Asia Pacific
    • Latin America
      • Brazil
      • Argentina
      • Rest of Latin America
    • Middle East & Africa
      • GCC Countries
      • South Africa
      • Rest of the Middle East and Africa

Adjacent Markets

There are several related markets in the COMT inhibitors industry with significant potential for revenue growth. The major markets adjacent to the COMT inhibitors market –

COMT inhibitors market adjacent (1)

1. Preface

1.1. Report Description

1.1.1. Purpose of the Report

1.1.2. Target Audience

1.1.3. USP and Key Offerings

1.2. Research Scope

1.3. Market Introduction


2. Executive Summary

2.1. Market Snapshot: Global COMT Inhibitors Market

2.1.1. Global COMT Inhibitors Market, By Product type

2.1.2. Global COMT Inhibitors Market, By Indication

2.1.3. Global COMT Inhibitors Market, By Distribution Channel

2.1.4. Global COMT Inhibitors Market, By Age group

2.1.5. Global COMT Inhibitors Market, By Combination Therapy

2.1.6. Global COMT Inhibitors Market, By Region

2.2. Insights from Primary Respondents


3. Market Dynamics & Factors Analysis 

3.1. Introduction

3.1.1. Global COMT Inhibitors Market Value, 2022-2030, (US$ Mn)

3.1.2. Y-o-Y Growth Trend Analysis

3.2. Market Dynamics

3.2.1. COMT Inhibitors Market Drivers

3.2.2. COMT Inhibitors Market Restraints

3.2.3. COMT Inhibitors Market Opportunities

3.2.4. Major COMT Inhibitors Industry Challenges

3.3. Growth and Development Patterns

3.4. Investment Feasibility Analysis

3.5. Market Opportunity Analysis

3.5.1. Product type

3.5.2. Indication

3.5.3. Distribution Channel

3.5.4. Age group

3.5.5. Combination Therapy

3.5.6. Geography


4. Market Competitive Landscape Analysis

4.1. Company Market Share Analysis, 2022

4.1.1. Global COMT Inhibitors Market: Company Market Share, Value 2022

4.1.2. Global COMT Inhibitors Market: Top 6 Company Market Share, Value 2022

4.1.3. Global COMT Inhibitors Market: Top 3 Company Market Share, Value 2022

4.2. Global COMT Inhibitors Market: Company Revenue Share Analysis, 2022

4.3. Company Assessment Metrics, 2022

4.3.1. Stars

4.3.2. Emerging Leaders

4.3.3. Pervasive Players

4.3.4. Participants

4.4. Startups/ SMEs Assessment Metrics, 2022

4.4.1. Progressive Companies

4.4.2. Responsive Companies

4.4.3. Dynamic Companies

4.4.4. Starting Blocks

4.5. Strategic Development

4.5.1. Acquisition and Mergers

4.5.2. New Product Launch

4.5.3. Regional Expansion

4.5.4. Partnerships

4.6. Key Player Product Matrix

4.7. Potential for New Players in the Global COMT Inhibitors Market


5. Premium Insights

5.1. STAR (Situation, Task, Action, Results) Analysis

5.2. Porter’s Five Forces Analysis

5.2.1. Threat of New Entrants

5.2.2. Bargaining Power of Buyers/Consumers

5.2.3. Bargaining Power of Suppliers

5.2.4. Threat of Substitute Types

5.2.5. Intensity of Competitive Rivalry

5.3. PESTEL Analysis

5.3.1. Political Factors

5.3.2. Economic Factors

5.3.3. Social Factors

5.3.4. Technological Factors

5.3.5. Environmental Factors

5.3.6. Legal Factors

5.4. Key Market Trends

5.4.1. Demand Side Trends

5.4.2. Supply Side Trends

5.5. Value Chain Analysis

5.6. Combination Therapy Analysis

5.6.1. Research and development in the global market

5.6.2. Patent Analysis

5.6.3. Emerging technologies and their potential disruption to the market

5.7. Consumer Behaviour Analysis

5.7.1. Consumer Preferences and Expectations

5.7.2. Factors Influencing Consumer Buying Decisions

5.7.2.1. North America

5.7.2.2. Europe

5.7.2.3. Asia Pacific

5.7.2.4. Latin America

5.7.2.5. Middle East and Africa

5.7.3. Consumer Pain Points

5.8. Analysis and Recommendations

5.9. Adjacent Market Analysis


6. Market Positioning of Key Players, 2022

6.1. Company market share of key players, 2022

6.2. Competitive Benchmarking

6.3. Market Positioning of Key Vendors

6.4. Geographical Presence Analysis

6.5. Major Strategies Adopted by Key Players

6.5.1. Key Strategies Analysis

6.5.2. Mergers and Acquisitions

6.5.3. Partnerships

6.5.4. Product Launch

6.5.5. Geographical Expansion

6.5.6. Others


7. Impact Analysis of COVID 19 and Russia – Ukraine War on COMT Inhibitors Market

7.1. Ukraine-Russia War Impact

7.1.1. Uncertainty and Economic Instability

7.1.2. Supply chain disruptions

7.1.3. Regional market shifts

7.1.4. Shift in government priorities

7.2. COVID-19 Impact Analysis

7.2.1. Supply Chain Disruptions

7.2.2. Demand Fluctuations

7.2.3. Shift in Product Mix

7.2.4. Reduced Industrial Activity

7.2.5. Regional Impact Analysis

7.2.5.1. North America

7.2.5.2. Europe

7.2.5.3. Asia Pacific

7.2.5.4. Latin America

7.2.5.5. Middle East and Africa


8. Global COMT Inhibitors Market, By Product type

8.1. Global COMT Inhibitors Market Overview, by Product type

8.1.1. Global COMT Inhibitors Market Revenue Share, By Product type, 2022 Vs 2030 (in %)

8.2. Tolcapone

8.2.1. Global COMT Inhibitors Market, By Tolcapone, By Region, 2022-2030 (US$ Mn)

8.2.2. Market Dynamics for Tolcapone

8.2.2.1. Drivers

8.2.2.2. Restraints

8.2.2.3. Opportunities

8.2.2.4. Trends

8.3. Entacapone

8.3.1. Global COMT Inhibitors Market, By Entacapone, By Region, 2022-2030 (US$ Mn)

8.3.2. Market Dynamics for Entacapone

8.3.2.1. Drivers

8.3.2.2. Restraints

8.3.2.3. Opportunities

8.3.2.4. Trends

8.4. Opicapone

8.4.1. Global COMT Inhibitors Market, By Opicapone, By Region, 2022-2030 (US$ Mn)

8.4.2. Market Dynamics for Opicapone

8.4.2.1. Drivers

8.4.2.2. Restraints

8.4.2.3. Opportunities

8.4.2.4. Trends

8.5. Others

8.5.1. Global COMT Inhibitors Market, By Others, By Region, 2022-2030 (US$ Mn)

8.5.2. Market Dynamics for Others

8.5.2.1. Drivers

8.5.2.2. Restraints

8.5.2.3. Opportunities

8.5.2.4. Trends


9. Global COMT Inhibitors Market, By Indication

9.1. Global COMT Inhibitors Market Overview, by Indication

9.1.1. Global COMT Inhibitors Market Revenue Share, By Indication, 2022 Vs 2030 (in %)

9.2. Parkinson’s Disease

9.2.1. Global COMT Inhibitors Market, By Parkinson’s Disease, By Region, 2022-2030 (US$ Mn)

9.2.2. Market Dynamics for Parkinson’s Disease

9.2.2.1. Drivers

9.2.2.2. Restraints

9.2.2.3. Opportunities

9.2.2.4. Trends

9.3. Other Conditions

9.3.1. Global COMT Inhibitors Market, By Other Conditions, By Region, 2022-2030 (US$ Mn)

9.3.2. Market Dynamics for Other Conditions

9.3.2.1. Drivers

9.3.2.2. Restraints

9.3.2.3. Opportunities

9.3.2.4. Trends


10. Global COMT Inhibitors Market, By Distribution Channel

10.1. Global COMT Inhibitors Market Overview, by Distribution Channel

10.1.1. Global COMT Inhibitors Market Revenue Share, By Distribution Channel, 2022 Vs 2030 (in %)

10.2. Hospital Pharmacies

10.2.1. Global COMT Inhibitors Market, By Hospital Pharmacies, By Region, 2022-2030 (US$ Mn)

10.2.2. Market Dynamics for Hospital Pharmacies

10.2.2.1. Drivers

10.2.2.2. Restraints

10.2.2.3. Opportunities

10.2.2.4. Trends

10.3. Retail Pharmacies

10.3.1. Global COMT Inhibitors Market, By Retail Pharmacies, By Region, 2022-2030 (US$ Mn)

10.3.2. Market Dynamics for Retail Pharmacies

10.3.2.1. Drivers

10.3.2.2. Restraints

10.3.2.3. Opportunities

10.3.2.4. Trends

10.4. Online Pharmacies

10.4.1. Global COMT Inhibitors Market, By Online Pharmacies, By Region, 2022-2030 (US$ Mn)

10.4.2. Market Dynamics for Online Pharmacies

10.4.2.1. Drivers

10.4.2.2. Restraints

10.4.2.3. Opportunities

10.4.2.4. Trends

10.5. Specialty Clinics

10.5.1. Global COMT Inhibitors Market, By Specialty Clinics, By Region, 2022-2030 (US$ Mn)

10.5.2. Market Dynamics for Specialty Clinics

10.5.2.1. Drivers

10.5.2.2. Restraints

10.5.2.3. Opportunities

10.5.2.4. Trends


11. Global COMT Inhibitors Market, By Age group

11.1. Global COMT Inhibitors Market Overview, by Age group

11.1.1. Global COMT Inhibitors Market Revenue Share, By Age group, 2022 Vs 2030 (in %)

11.2. Adult

11.2.1. Global COMT Inhibitors Market, By Adult, By Region, 2022-2030 (US$ Mn)

11.2.2. Market Dynamics for Adult

11.2.2.1. Drivers

11.2.2.2. Restraints

11.2.2.3. Opportunities

11.2.2.4. Trends


12. Global COMT Inhibitors Market, By Combination Therapy

12.1. Global COMT Inhibitors Market Overview, by Combination Therapy

12.1.1. Global COMT Inhibitors Market Revenue Share, By Combination Therapy, 2022 Vs 2030 (in %)

12.2. With Levodopa

12.2.1. Global COMT Inhibitors Market, By With Levodopa, By Region, 2022-2030 (US$ Mn)

12.2.2. Market Dynamics for With Levodopa

12.2.2.1. Drivers

12.2.2.2. Restraints

12.2.2.3. Opportunities

12.2.2.4. Trends

12.3. Monotherapy

12.3.1. Global COMT Inhibitors Market, By Monotherapy, By Region, 2022-2030 (US$ Mn)

12.3.2. Market Dynamics for Monotherapy

12.3.2.1. Drivers

12.3.2.2. Restraints

12.3.2.3. Opportunities

12.3.2.4. Trends


13. Global COMT Inhibitors Market, By Region

13.1. Global COMT Inhibitors Market Overview, by Region

13.1.1. Global COMT Inhibitors Market, By Region, 2022 vs 2030 (in%)

13.2. Product type

13.2.1. Global COMT Inhibitors Market, By Product type, 2022-2030 (US$ Mn)

13.3. Indication

13.3.1. Global COMT Inhibitors Market, By Indication, 2022-2030 (US$ Mn)

13.4. Distribution Channel

13.4.1. Global COMT Inhibitors Market, By Distribution Channel, 2022-2030 (US$ Mn)

13.5. Age group

13.5.1. Global COMT Inhibitors Market, By Age group, 2022-2030 (US$ Mn)

13.6. Combination Therapy

13.6.1. Global COMT Inhibitors Market, By Combination Therapy, 2022-2030 (US$ Mn)


14. North America COMT Inhibitors Market Analysis

14.1. Overview

14.1.1. Market Dynamics for North America

14.1.1.1. Drivers

14.1.1.2. Restraints

14.1.1.3. Opportunities

14.1.1.4. Trends

14.2. North America COMT Inhibitors Market, by Product type, 2017-2030(US$ Mn)

14.2.1. Overview

14.2.2. SRC Analysis

14.3. North America COMT Inhibitors Market, by Indication, 2017-2030(US$ Mn)

14.3.1. Overview

14.3.2. SRC Analysis

14.4. North America COMT Inhibitors Market, by Distribution Channel, 2017-2030(US$ Mn)

14.4.1. Overview

14.4.2. SRC Analysis

14.5. North America COMT Inhibitors Market, by Age group, 2017-2030(US$ Mn)

14.5.1. Overview

14.5.2. SRC Analysis

14.6. North America COMT Inhibitors Market, by Combination Therapy, 2017-2030(US$ Mn)

14.6.1. Overview

14.6.2. SRC Analysis

14.7. North America COMT Inhibitors Market, by Country, 2022-2030 (US$ Mn)

14.7.1. North America COMT Inhibitors Market, by Country, 2022 Vs 2030 (in%)

14.7.2. U.S.

14.7.3. Canada

14.7.4. Mexico


15. Europe COMT Inhibitors Market Analysis

15.1. Overview

15.1.1. Market Dynamics for Europe

15.1.1.1. Drivers

15.1.1.2. Restraints

15.1.1.3. Opportunities

15.1.1.4. Trends

15.2. Europe COMT Inhibitors Market, by Product type, 2017-2030(US$ Mn)

15.2.1. Overview

15.2.2. SRC Analysis

15.3. Europe COMT Inhibitors Market, by Indication, 2017-2030(US$ Mn)

15.3.1. Overview

15.3.2. SRC Analysis

15.4. Europe COMT Inhibitors Market, by Distribution Channel, 2017-2030(US$ Mn)

15.4.1. Overview

15.4.2. SRC Analysis

15.5. Europe COMT Inhibitors Market, by Age group, 2017-2030(US$ Mn)

15.5.1. Overview

15.5.2. SRC Analysis

15.6. Europe COMT Inhibitors Market, by Combination Therapy, 2017-2030(US$ Mn)

15.6.1. Overview

15.6.2. SRC Analysis

15.7. Europe COMT Inhibitors Market, by Country, 2022-2030 (US$ Mn)

15.7.1. Europe COMT Inhibitors Market, by Country, 2022 Vs 2030 (in%)

15.7.2. UK

15.7.3. France

15.7.4. Germany

15.7.5. Italy

15.7.6. Spain

15.7.7. Benelux

15.7.8. Russia

15.7.9. Rest of Europe


16. Asia Pacific COMT Inhibitors Market Analysis

16.1. Overview

16.1.1. Market Dynamics for Asia Pacific

16.1.1.1. Drivers

16.1.1.2. Restraints

16.1.1.3. Opportunities

16.1.1.4. Trends

16.2. Asia Pacific COMT Inhibitors Market, by Product type, 2017-2030(US$ Mn)

16.2.1. Overview

16.2.2. SRC Analysis

16.3. Asia Pacific COMT Inhibitors Market, by Indication, 2017-2030(US$ Mn)

16.3.1. Overview

16.3.2. SRC Analysis

16.4. Asia Pacific COMT Inhibitors Market, by Distribution Channel, 2017-2030(US$ Mn)

16.4.1. Overview

16.4.2. SRC Analysis

16.5. Asia Pacific COMT Inhibitors Market, by Age group, 2017-2030(US$ Mn)

16.5.1. Overview

16.5.2. SRC Analysis

16.6. Asia Pacific COMT Inhibitors Market, by Combination Therapy, 2017-2030(US$ Mn)

16.6.1. Overview

16.6.2. SRC Analysis

16.7. Asia Pacific COMT Inhibitors Market, by Country, 2022-2030 (US$ Mn)

16.7.1. Asia Pacific COMT Inhibitors Market, by Country, 2022 Vs 2030 (in%)

16.7.2. China

16.7.3. Japan

16.7.4. India

16.7.5. South Korea

16.7.6. South East Asia

16.7.7. Rest of Asia Pacific


17. Latin America COMT Inhibitors Market Analysis

17.1. Overview

17.1.1. Market Dynamics for Latin America

17.1.1.1. Drivers

17.1.1.2. Restraints

17.1.1.3. Opportunities

17.1.1.4. Trends

17.2. Latin America COMT Inhibitors Market, by Product type, 2017-2030(US$ Mn)

17.2.1. Overview

17.2.2. SRC Analysis

17.3. Latin America COMT Inhibitors Market, by Indication, 2017-2030(US$ Mn)

17.3.1. Overview

17.3.2. SRC Analysis

17.4. Latin America COMT Inhibitors Market, by Distribution Channel, 2017-2030(US$ Mn)

17.4.1. Overview

17.4.2. SRC Analysis

17.5. Latin America COMT Inhibitors Market, by Age group, 2017-2030(US$ Mn)

17.5.1. Overview

17.5.2. SRC Analysis

17.6. Latin America COMT Inhibitors Market, by Combination Therapy, 2017-2030(US$ Mn)

17.6.1. Overview

17.6.2. SRC Analysis

17.7. Latin America COMT Inhibitors Market, by Country, 2022-2030 (US$ Mn)

17.7.1. Latin America COMT Inhibitors Market, by Country, 2022 Vs 2030 (in%)

17.7.2. Brazil

17.7.3. Argentina

17.7.4. Rest of Latin America


18. Middle East COMT Inhibitors Market Analysis

18.1. Overview

18.1.1. Market Dynamics for Middle East

18.1.1.1. Drivers

18.1.1.2. Restraints

18.1.1.3. Opportunities

18.1.1.4. Trends

18.2. Middle East COMT Inhibitors Market, by Product type, 2017-2030(US$ Mn)

18.2.1. Overview

18.2.2. SRC Analysis

18.3. Middle East COMT Inhibitors Market, by Indication, 2017-2030(US$ Mn)

18.3.1. Overview

18.3.2. SRC Analysis

18.4. Middle East COMT Inhibitors Market, by Distribution Channel, 2017-2030(US$ Mn)

18.4.1. Overview

18.4.2. SRC Analysis

18.5. Middle East COMT Inhibitors Market, by Age group, 2017-2030(US$ Mn)

18.5.1. Overview

18.5.2. SRC Analysis

18.6. Middle East COMT Inhibitors Market, by Combination Therapy, 2017-2030(US$ Mn)

18.6.1. Overview

18.6.2. SRC Analysis

18.7. Middle East COMT Inhibitors Market, by Country, 2022-2030 (US$ Mn)

18.7.1. Middle East COMT Inhibitors Market, by Country, 2022 Vs 2030 (in%)

18.7.2. UAE

18.7.3. Saudi Arabia

18.7.4. Rest of Middle East


19. Africa COMT Inhibitors Market Analysis

19.1. Overview

19.1.1. Market Dynamics for Africa

19.1.1.1. Drivers

19.1.1.2. Restraints

19.1.1.3. Opportunities

19.1.1.4. Trends

19.2. Africa COMT Inhibitors Market, by Product type, 2017-2030(US$ Mn)

19.2.1. Overview

19.2.2. SRC Analysis

19.3. Africa COMT Inhibitors Market, by Indication, 2017-2030(US$ Mn)

19.3.1. Overview

19.3.2. SRC Analysis

19.4. Africa COMT Inhibitors Market, by Distribution Channel, 2017-2030(US$ Mn)

19.4.1. Overview

19.4.2. SRC Analysis

19.5. Africa COMT Inhibitors Market, by Age group, 2017-2030(US$ Mn)

19.5.1. Overview

19.5.2. SRC Analysis

19.6. Africa COMT Inhibitors Market, by Combination Therapy, 2017-2030(US$ Mn)

19.6.1. Overview

19.6.2. SRC Analysis

19.7. Africa COMT Inhibitors Market, by Country, 2022-2030 (US$ Mn)

19.7.1. Africa COMT Inhibitors Market, by Country, 2022 Vs 2030 (in%)

19.7.2. South Africa

19.7.3. Egypt

19.7.4. Rest of Africa


20. Company profiles

20.1. Orion Corporation

20.1.1. Company Overview

20.1.2. Products/Services Portfolio

20.1.3. Geographical Presence

20.1.4. SWOT Analysis

20.1.5. Financial Summary

20.1.5.1. Market Revenue and Net Profit (2019-2022)

20.1.5.2. Business Segment Revenue Analysis

20.1.5.3. Geographical Revenue Analysis

20.2. Roche

20.3. AbbVie Inc.

20.4. Acadia Pharmaceuticals

20.5. Amneal Pharmaceutical

20.6. UCB

20.7. Teva Pharmaceutical

20.8. Novartis AG

20.9. Lundbeck A/S

20.10. Others


21. Research Methodology

21.1. Research Methodology

21.2. Phase I – Secondary Research

21.3. Phase II – Data Modelling

21.3.1. Company Share Analysis Model

21.3.2. Revenue Based Modelling

21.4. Phase III – Primary Research

21.5. Research Limitations

21.5.1. Assumptions

List of Figures

FIG. 1 Global COMT Inhibitors Market: Research Methodology

FIG. 2 Market Size Estimation – Top Down & Bottom up Approach

FIG. 3 Global COMT Inhibitors Market Segmentation

FIG. 4 Global COMT Inhibitors Market, by Product type, 2022 (US$ Mn)

FIG. 5 Global COMT Inhibitors Market, by Indication, 2022 (US$ Mn)

FIG. 6 Global COMT Inhibitors Market, by Distribution Channel, 2022 (US$ Mn)

FIG. 7 Global COMT Inhibitors Market, by Age group, 2022 (US$ Mn)

FIG. 8 Global COMT Inhibitors Market, by Combination Therapy, 2022 (US$ Mn)

FIG. 9 Global COMT Inhibitors Market, by Geography, 2022 (US$ Mn)

FIG. 10 Attractive Investment Proposition, by Product type, 2022

FIG. 11 Attractive Investment Proposition, by Indication, 2022

FIG. 12 Attractive Investment Proposition, by Distribution Channel, 2022

FIG. 13 Attractive Investment Proposition, by Age group, 2022

FIG. 14 Attractive Investment Proposition, by Combination Therapy, 2022

FIG. 15 Attractive Investment Proposition, by Geography, 2022

FIG. 16 Global Market Share Analysis of Key COMT Inhibitors Market Manufacturers, 2022

FIG. 17 Global Market Positioning of Key COMT Inhibitors Market Manufacturers, 2022

FIG. 18 Global COMT Inhibitors Market Value Contribution, By Product type, 2022 & 2030 (Value %)

FIG. 19 Global COMT Inhibitors Market, by Tolcapone, Value, 2022-2030 (US$ Mn)

FIG. 20 Global COMT Inhibitors Market, by Entacapone, Value, 2022-2030 (US$ Mn)

FIG. 21 Global COMT Inhibitors Market, by Opicapone, Value, 2022-2030 (US$ Mn)

FIG. 22 Global COMT Inhibitors Market, by Others, Value, 2022-2030 (US$ Mn)

FIG. 23 Global COMT Inhibitors Market Value Contribution, By Indication, 2022 & 2030 (Value %)

FIG. 24 Global COMT Inhibitors Market, by Parkinson’s Disease, Value, 2022-2030 (US$ Mn)

FIG. 25 Global COMT Inhibitors Market, by Other Conditions, Value, 2022-2030 (US$ Mn)

FIG. 26 Global COMT Inhibitors Market Value Contribution, By Distribution Channel, 2022 & 2030 (Value %)

FIG. 27 Global COMT Inhibitors Market, by Hospital Pharmacies, Value, 2022-2030 (US$ Mn)

FIG. 28 Global COMT Inhibitors Market, by Retail Pharmacies, Value, 2022-2030 (US$ Mn)

FIG. 29 Global COMT Inhibitors Market, by Online Pharmacies, Value, 2022-2030 (US$ Mn)

FIG. 30 Global COMT Inhibitors Market, by Specialty Clinics, Value, 2022-2030 (US$ Mn)

FIG. 31 Global COMT Inhibitors Market Value Contribution, By Age group, 2022 & 2030 (Value %)

FIG. 32 Global COMT Inhibitors Market, by Adult, Value, 2022-2030 (US$ Mn)

FIG. 33 Global COMT Inhibitors Market Value Contribution, By Combination Therapy, 2022 & 2030 (Value %)

FIG. 34 Global COMT Inhibitors Market, by  With Levodopa, Value, 2022-2030 (US$ Mn)

FIG. 35 Global COMT Inhibitors Market, by Monotherapy, Value, 2022-2030 (US$ Mn)

FIG. 36 North America COMT Inhibitors Market, 2022-2030 (US$ Mn)

FIG. 37 U.S. COMT Inhibitors Market, 2022-2030 (US$ Mn)

FIG. 38 Canada COMT Inhibitors Market, 2022-2030 (US$ Mn)

FIG. 39 Mexico COMT Inhibitors Market, 2022-2030 (US$ Mn)

FIG. 40 Europe COMT Inhibitors Market, 2022-2030 (US$ Mn)

FIG. 41 Germany COMT Inhibitors Market, 2022-2030 (US$ Mn)

FIG. 42 France COMT Inhibitors Market, 2022-2030 (US$ Mn)

FIG. 43 U.K. COMT Inhibitors Market, 2022-2030 (US$ Mn)

FIG. 44 Italy COMT Inhibitors Market, 2022-2030 (US$ Mn)

FIG. 45 Spain COMT Inhibitors Market, 2022-2030 (US$ Mn)

FIG. 46 Benelux COMT Inhibitors Market, 2022-2030 (US$ Mn)

FIG. 47 Russia COMT Inhibitors Market, 2022-2030 (US$ Mn)

FIG. 48 Rest of Europe COMT Inhibitors Market, 2022-2030 (US$ Mn)

FIG. 49 Asia Pacific COMT Inhibitors Market, 2022-2030 (US$ Mn)

FIG. 50 China COMT Inhibitors Market, 2022-2030 (US$ Mn)

FIG. 51 Japan COMT Inhibitors Market, 2022-2030 (US$ Mn)

FIG. 52 India COMT Inhibitors Market, 2022-2030 (US$ Mn)

FIG. 53 South Korea COMT Inhibitors Market, 2022-2030 (US$ Mn)

FIG. 54 South-East Asia COMT Inhibitors Market, 2022-2030 (US$ Mn)

FIG. 55 Rest of Asia Pacific COMT Inhibitors Market, 2022-2030 (US$ Mn)

FIG. 56 Latin America COMT Inhibitors Market, 2022-2030 (US$ Mn)

FIG. 57 Brazil COMT Inhibitors Market, 2022-2030 (US$ Mn)

FIG. 58 Argentina COMT Inhibitors Market, 2022-2030 (US$ Mn)

FIG. 59 Rest of Latin America COMT Inhibitors Market, 2022-2030 (US$ Mn)

FIG. 60 Middle East COMT Inhibitors Market, 2022-2030 (US$ Mn)

FIG. 61 UAE COMT Inhibitors Market, 2022-2030 (US$ Mn)

FIG. 62 Saudi Arabia COMT Inhibitors Market, 2022-2030 (US$ Mn)

FIG. 63 Rest of Middle East COMT Inhibitors Market, 2022-2030 (US$ Mn)

FIG. 64 Africa COMT Inhibitors Market, 2022-2030 (US$ Mn)

FIG. 65 South Africa COMT Inhibitors Market, 2022-2030 (US$ Mn)

FIG. 66 Egypt COMT Inhibitors Market, 2022-2030 (US$ Mn)

FIG. 67 Rest of Africa COMT Inhibitors Market, 2022-2030 (US$ Mn)


List of Tables

TABLE 1 Market Snapshot: Global COMT Inhibitors Market

TABLE 2 Global COMT Inhibitors Market: Market Drivers Impact Analysis

TABLE 3 Global COMT Inhibitors Market: Market Restraints Impact Analysis

TABLE 4 Global COMT Inhibitors Market, by Competitive Benchmarking, 2022

TABLE 5 Global COMT Inhibitors Market, by Geographical Presence Analysis, 2022

TABLE 6 Global COMT Inhibitors Market, by Key Strategies Analysis, 2022

TABLE 7 Global COMT Inhibitors Market, by Tolcapone, By Region, 2017-2022 (US$ Mn)

TABLE 8 Global COMT Inhibitors Market, by Tolcapone, By Region, 2023-2030 (US$ Mn)

TABLE 9 Global COMT Inhibitors Market, by Entacapone, By Region, 2017-2022 (US$ Mn)

TABLE 10 Global COMT Inhibitors Market, by Entacapone, By Region, 2023-2030 (US$ Mn)

TABLE 11 Global COMT Inhibitors Market, by Opicapone, By Region, 2017-2022 (US$ Mn)

TABLE 12 Global COMT Inhibitors Market, by Opicapone, By Region, 2023-2030 (US$ Mn)

TABLE 13 Global COMT Inhibitors Market, by Others, By Region, 2017-2022 (US$ Mn)

TABLE 14 Global COMT Inhibitors Market, by Others, By Region, 2023-2030 (US$ Mn)

TABLE 15 Global COMT Inhibitors Market, by Parkinson’s Disease, By Region, 2017-2022 (US$ Mn)

TABLE 16 Global COMT Inhibitors Market, by Parkinson’s Disease, By Region, 2023-2030 (US$ Mn)

TABLE 17 Global COMT Inhibitors Market, by Other Conditions, By Region, 2017-2022 (US$ Mn)

TABLE 18 Global COMT Inhibitors Market, by Other Conditions, By Region, 2023-2030 (US$ Mn)

TABLE 19 Global COMT Inhibitors Market, by Hospital Pharmacies, By Region, 2017-2022 (US$ Mn)

TABLE 20 Global COMT Inhibitors Market, by Hospital Pharmacies, By Region, 2023-2030 (US$ Mn)

TABLE 21 Global COMT Inhibitors Market, by Retail Pharmacies, By Region, 2017-2022 (US$ Mn)

TABLE 22 Global COMT Inhibitors Market, by Retail Pharmacies, By Region, 2023-2030 (US$ Mn)

TABLE 23 Global COMT Inhibitors Market, by Online Pharmacies, By Region, 2017-2022 (US$ Mn)

TABLE 24 Global COMT Inhibitors Market, by Online Pharmacies, By Region, 2023-2030 (US$ Mn)

TABLE 25 Global COMT Inhibitors Market, by Specialty Clinics, By Region, 2017-2022 (US$ Mn)

TABLE 26 Global COMT Inhibitors Market, by Specialty Clinics, By Region, 2023-2030 (US$ Mn)

TABLE 27 Global COMT Inhibitors Market, by Adult, By Region, 2017-2022 (US$ Mn)

TABLE 28 Global COMT Inhibitors Market, by Adult, By Region, 2023-2030 (US$ Mn)

TABLE 29 Global COMT Inhibitors Market, by With Levodopa, By Region, 2017-2022 (US$ Mn)

TABLE 30 Global COMT Inhibitors Market, by With Levodopa, By Region, 2023-2030 (US$ Mn)

TABLE 31 Global COMT Inhibitors Market, by Monotherapy, By Region, 2017-2022 (US$ Mn)

TABLE 32 Global COMT Inhibitors Market, by Monotherapy, By Region, 2023-2030 (US$ Mn)

TABLE 33 Global COMT Inhibitors Market, by Product type, 2017-2022 (US$ Mn)

TABLE 34 Global COMT Inhibitors Market, by Product type, 2023-2030 (US$ Mn)

TABLE 35 Global COMT Inhibitors Market, by Indication, 2017-2022 (US$ Mn)

TABLE 36 Global COMT Inhibitors Market, by Indication, 2023-2030 (US$ Mn)

TABLE 37 Global COMT Inhibitors Market, by Distribution Channel, 2017-2022 (US$ Mn)

TABLE 38 Global COMT Inhibitors Market, by Distribution Channel, 2023-2030 (US$ Mn)

TABLE 39 Global COMT Inhibitors Market, by Age group, By Region, 2017-2022 (US$ Mn)

TABLE 40 Global COMT Inhibitors Market, by Age group, By Region, 2023-2030 (US$ Mn)

TABLE 41 Global COMT Inhibitors Market, by Combination Therapy, 2017-2022 (US$ Mn)

TABLE 42 Global COMT Inhibitors Market, by Combination Therapy, 2023-2030 (US$ Mn)

TABLE 43 Global COMT Inhibitors Market, by Region, 2017-2022 (US$ Mn)

TABLE 44 Global COMT Inhibitors Market, by Region, 2023-2030 (US$ Mn)

TABLE 45 North America COMT Inhibitors Market, by Product type, 2017-2022 (US$ Mn)

TABLE 46 North America COMT Inhibitors Market, by Product type, 2023-2030 (US$ Mn)

TABLE 47 North America COMT Inhibitors Market, by Indication, 2017-2022 (US$ Mn)

TABLE 48 North America COMT Inhibitors Market, by Indication, 2023-2030 (US$ Mn)

TABLE 49 North America COMT Inhibitors Market, by Distribution Channel, 2017-2022 (US$ Mn)

TABLE 50 North America COMT Inhibitors Market, by Distribution Channel, 2023-2030 (US$ Mn)

TABLE 51 North America COMT Inhibitors Market, by Age group, By Region, 2017-2022 (US$ Mn)

TABLE 52 North America COMT Inhibitors Market, by Age group, By Region, 2023-2030 (US$ Mn)

TABLE 53 North America COMT Inhibitors Market, by Combination Therapy, 2017-2022 (US$ Mn)

TABLE 54 North America COMT Inhibitors Market, by Combination Therapy, 2023-2030 (US$ Mn)

TABLE 55 North America COMT Inhibitors Market, by Country, 2017-2022 (US$ Mn)

TABLE 56 North America COMT Inhibitors Market, by Country, 2023-2030 (US$ Mn)

TABLE 57 United States COMT Inhibitors Market, by Product type, 2017-2022 (US$ Mn)

TABLE 58 United States COMT Inhibitors Market, by Product type, 2023-2030 (US$ Mn)

TABLE 59 United States COMT Inhibitors Market, by Indication, 2017-2022 (US$ Mn)

TABLE 60 United States COMT Inhibitors Market, by Indication, 2023-2030 (US$ Mn)

TABLE 61 United States COMT Inhibitors Market, by Distribution Channel, 2017-2022 (US$ Mn)

TABLE 62 United States COMT Inhibitors Market, by Distribution Channel, 2023-2030 (US$ Mn)

TABLE 63 United States COMT Inhibitors Market, by Age group, By Region, 2017-2022 (US$ Mn)

TABLE 64 United States COMT Inhibitors Market, by Age group, By Region, 2023-2030 (US$ Mn)

TABLE 65 United States COMT Inhibitors Market, by Combination Therapy, 2017-2022 (US$ Mn)

TABLE 66 United States COMT Inhibitors Market, by Combination Therapy, 2023-2030 (US$ Mn)

TABLE 67 Canada COMT Inhibitors Market, by Product type, 2017-2022 (US$ Mn)

TABLE 68 Canada COMT Inhibitors Market, by Product type, 2023-2030 (US$ Mn)

TABLE 69 Canada COMT Inhibitors Market, by Indication, 2017-2022 (US$ Mn)

TABLE 70 Canada COMT Inhibitors Market, by Indication, 2023-2030 (US$ Mn)

TABLE 71 Canada COMT Inhibitors Market, by Distribution Channel, 2017-2022 (US$ Mn)

TABLE 72 Canada COMT Inhibitors Market, by Distribution Channel, 2023-2030 (US$ Mn)

TABLE 73 Canada COMT Inhibitors Market, by Age group, By Region, 2017-2022 (US$ Mn)

TABLE 74 Canada COMT Inhibitors Market, by Age group, By Region, 2023-2030 (US$ Mn)

TABLE 75 Canada COMT Inhibitors Market, by Combination Therapy, 2017-2022 (US$ Mn)

TABLE 76 Canada COMT Inhibitors Market, by Combination Therapy, 2023-2030 (US$ Mn)

TABLE 77 Mexico COMT Inhibitors Market, by Product type, 2017-2022 (US$ Mn)

TABLE 78 Mexico COMT Inhibitors Market, by Product type, 2023-2030 (US$ Mn)

TABLE 79 Mexico COMT Inhibitors Market, by Indication, 2017-2022 (US$ Mn)

TABLE 80 Mexico COMT Inhibitors Market, by Indication, 2023-2030 (US$ Mn)

TABLE 81 Mexico COMT Inhibitors Market, by Distribution Channel, 2017-2022 (US$ Mn)

TABLE 82 Mexico COMT Inhibitors Market, by Distribution Channel, 2023-2030 (US$ Mn)

TABLE 83 Mexico COMT Inhibitors Market, by Age group, By Region, 2017-2022 (US$ Mn)

TABLE 84 Mexico COMT Inhibitors Market, by Age group, By Region, 2023-2030 (US$ Mn)

TABLE 85 Mexico COMT Inhibitors Market, by Combination Therapy, 2017-2022 (US$ Mn)

TABLE 86 Mexico COMT Inhibitors Market, by Combination Therapy, 2023-2030 (US$ Mn)

TABLE 87 Europe COMT Inhibitors Market, by Product type, 2017-2022 (US$ Mn)

TABLE 88 Europe COMT Inhibitors Market, by Product type, 2023-2030 (US$ Mn)

TABLE 89 Europe COMT Inhibitors Market, by Indication, 2017-2022 (US$ Mn)

TABLE 90 Europe COMT Inhibitors Market, by Indication, 2023-2030 (US$ Mn)

TABLE 91 Europe COMT Inhibitors Market, by Distribution Channel, 2017-2022 (US$ Mn)

TABLE 92 Europe COMT Inhibitors Market, by Distribution Channel, 2023-2030 (US$ Mn)

TABLE 93 Europe COMT Inhibitors Market, by Age group, By Region, 2017-2022 (US$ Mn)

TABLE 94 Europe COMT Inhibitors Market, by Age group, By Region, 2023-2030 (US$ Mn)

TABLE 95 Europe COMT Inhibitors Market, by Combination Therapy, 2017-2022 (US$ Mn)

TABLE 96 Europe COMT Inhibitors Market, by Combination Therapy, 2023-2030 (US$ Mn)

TABLE 97 Europe COMT Inhibitors Market, by Country, 2017-2022 (US$ Mn)

TABLE 98 Europe COMT Inhibitors Market, by Country, 2023-2030 (US$ Mn)

TABLE 99 Germany COMT Inhibitors Market, by Product type, 2017-2022 (US$ Mn)

TABLE 100 Germany COMT Inhibitors Market, by Product type, 2023-2030 (US$ Mn)

TABLE 101 Germany COMT Inhibitors Market, by Indication, 2017-2022 (US$ Mn)

TABLE 102 Germany COMT Inhibitors Market, by Indication, 2023-2030 (US$ Mn)

TABLE 103 Germany COMT Inhibitors Market, by Distribution Channel, 2017-2022 (US$ Mn)

TABLE 104 Germany COMT Inhibitors Market, by Distribution Channel, 2023-2030 (US$ Mn)

TABLE 105 Germany COMT Inhibitors Market, by Age group, By Region, 2017-2022 (US$ Mn)

TABLE 106 Germany COMT Inhibitors Market, by Age group, By Region, 2023-2030 (US$ Mn)

TABLE 107 Germany COMT Inhibitors Market, by Combination Therapy, 2017-2022 (US$ Mn)

TABLE 108 Germany COMT Inhibitors Market, by Combination Therapy, 2023-2030 (US$ Mn)

TABLE 109 France COMT Inhibitors Market, by Product type, 2017-2022 (US$ Mn)

TABLE 110 France COMT Inhibitors Market, by Product type, 2023-2030 (US$ Mn)

TABLE 111 France COMT Inhibitors Market, by Indication, 2017-2022 (US$ Mn)

TABLE 112 France COMT Inhibitors Market, by Indication, 2023-2030 (US$ Mn)

TABLE 113 France COMT Inhibitors Market, by Distribution Channel, 2017-2022 (US$ Mn)

TABLE 114 France COMT Inhibitors Market, by Distribution Channel, 2023-2030 (US$ Mn)

TABLE 115 France COMT Inhibitors Market, by Age group, By Region, 2017-2022 (US$ Mn)

TABLE 116 France COMT Inhibitors Market, by Age group, By Region, 2023-2030 (US$ Mn)

TABLE 117 France COMT Inhibitors Market, by Combination Therapy, 2017-2022 (US$ Mn)

TABLE 118 France COMT Inhibitors Market, by Combination Therapy, 2023-2030 (US$ Mn)

TABLE 119 United Kingdom COMT Inhibitors Market, by Product type, 2017-2022 (US$ Mn)

TABLE 120 United Kingdom COMT Inhibitors Market, by Product type, 2023-2030 (US$ Mn)

TABLE 121 United Kingdom COMT Inhibitors Market, by Indication, 2017-2022 (US$ Mn)

TABLE 122 United Kingdom COMT Inhibitors Market, by Indication, 2023-2030 (US$ Mn)

TABLE 123 United Kingdom COMT Inhibitors Market, by Distribution Channel, 2017-2022 (US$ Mn)

TABLE 124 United Kingdom COMT Inhibitors Market, by Distribution Channel, 2023-2030 (US$ Mn)

TABLE 125 United Kingdom COMT Inhibitors Market, by Age group, By Region, 2017-2022 (US$ Mn)

TABLE 126 United Kingdom COMT Inhibitors Market, by Age group, By Region, 2023-2030 (US$ Mn)

TABLE 127 United Kingdom COMT Inhibitors Market, by Combination Therapy, 2017-2022 (US$ Mn)

TABLE 128 United Kingdom COMT Inhibitors Market, by Combination Therapy, 2023-2030 (US$ Mn)

TABLE 129 Italy COMT Inhibitors Market, by Product type, 2017-2022 (US$ Mn)

TABLE 130 Italy COMT Inhibitors Market, by Product type, 2023-2030 (US$ Mn)

TABLE 131 Italy COMT Inhibitors Market, by Indication, 2017-2022 (US$ Mn)

TABLE 132 Italy COMT Inhibitors Market, by Indication, 2023-2030 (US$ Mn)

TABLE 133 Italy COMT Inhibitors Market, by Distribution Channel, 2017-2022 (US$ Mn)

TABLE 134 Italy COMT Inhibitors Market, by Distribution Channel, 2023-2030 (US$ Mn)

TABLE 135 Italy COMT Inhibitors Market, by Age group, By Region, 2017-2022 (US$ Mn)

TABLE 136 Italy COMT Inhibitors Market, by Age group, By Region, 2023-2030 (US$ Mn)

TABLE 137 Italy COMT Inhibitors Market, by Combination Therapy, 2017-2022 (US$ Mn)

TABLE 138 Italy COMT Inhibitors Market, by Combination Therapy, 2023-2030 (US$ Mn)

TABLE 139 Spain COMT Inhibitors Market, by Product type, 2017-2022 (US$ Mn)

TABLE 140 Spain COMT Inhibitors Market, by Product type, 2023-2030 (US$ Mn)

TABLE 141 Spain COMT Inhibitors Market, by Indication, 2017-2022 (US$ Mn)

TABLE 142 Spain COMT Inhibitors Market, by Indication, 2023-2030 (US$ Mn)

TABLE 143 Spain COMT Inhibitors Market, by Distribution Channel, 2017-2022 (US$ Mn)

TABLE 144 Spain COMT Inhibitors Market, by Distribution Channel, 2023-2030 (US$ Mn)

TABLE 145 Spain COMT Inhibitors Market, by Age group, By Region, 2017-2022 (US$ Mn)

TABLE 146 Spain COMT Inhibitors Market, by Age group, By Region, 2023-2030 (US$ Mn)

TABLE 147 Spain COMT Inhibitors Market, by Combination Therapy, 2017-2022 (US$ Mn)

TABLE 148 Spain COMT Inhibitors Market, by Combination Therapy, 2023-2030 (US$ Mn)

TABLE 149 Benelux COMT Inhibitors Market, by Product type, 2017-2022 (US$ Mn)

TABLE 150 Benelux COMT Inhibitors Market, by Product type, 2023-2030 (US$ Mn)

TABLE 151 Benelux COMT Inhibitors Market, by Indication, 2017-2022 (US$ Mn)

TABLE 152 Benelux COMT Inhibitors Market, by Indication, 2023-2030 (US$ Mn)

TABLE 153 Benelux COMT Inhibitors Market, by Distribution Channel, 2017-2022 (US$ Mn)

TABLE 154 Benelux COMT Inhibitors Market, by Distribution Channel, 2023-2030 (US$ Mn)

TABLE 155 Benelux COMT Inhibitors Market, by Age group, By Region, 2017-2022 (US$ Mn)

TABLE 156 Benelux COMT Inhibitors Market, by Age group, By Region, 2023-2030 (US$ Mn)

TABLE 157 Benelux COMT Inhibitors Market, by Combination Therapy, 2017-2022 (US$ Mn)

TABLE 158 Benelux COMT Inhibitors Market, by Combination Therapy, 2023-2030 (US$ Mn)

TABLE 159 Russia COMT Inhibitors Market, by Product type, 2017-2022 (US$ Mn)

TABLE 160 Russia COMT Inhibitors Market, by Product type, 2023-2030 (US$ Mn)

TABLE 161 Russia COMT Inhibitors Market, by Indication, 2017-2022 (US$ Mn)

TABLE 162 Russia COMT Inhibitors Market, by Indication, 2023-2030 (US$ Mn)

TABLE 163 Russia COMT Inhibitors Market, by Distribution Channel, 2017-2022 (US$ Mn)

TABLE 164 Russia COMT Inhibitors Market, by Distribution Channel, 2023-2030 (US$ Mn)

TABLE 165 Russia COMT Inhibitors Market, by Age group, By Region, 2017-2022 (US$ Mn)

TABLE 166 Russia COMT Inhibitors Market, by Age group, By Region, 2023-2030 (US$ Mn)

TABLE 167 Russia COMT Inhibitors Market, by Combination Therapy, 2017-2022 (US$ Mn)

TABLE 168 Russia COMT Inhibitors Market, by Combination Therapy, 2023-2030 (US$ Mn)

TABLE 169 Rest of Europe COMT Inhibitors Market, by Product type, 2017-2022 (US$ Mn)

TABLE 170 Rest of Europe COMT Inhibitors Market, by Product type, 2023-2030 (US$ Mn)

TABLE 171 Rest of Europe COMT Inhibitors Market, by Indication, 2017-2022 (US$ Mn)

TABLE 172 Rest of Europe COMT Inhibitors Market, by Indication, 2023-2030 (US$ Mn)

TABLE 173 Rest of Europe COMT Inhibitors Market, by Distribution Channel, 2017-2022 (US$ Mn)

TABLE 174 Rest of Europe COMT Inhibitors Market, by Distribution Channel, 2023-2030 (US$ Mn)

TABLE 175 Rest of Europe COMT Inhibitors Market, by Age group, By Region, 2017-2022 (US$ Mn)

TABLE 176 Rest of Europe COMT Inhibitors Market, by Age group, By Region, 2023-2030 (US$ Mn)

TABLE 177 Rest of Europe COMT Inhibitors Market, by Combination Therapy, 2017-2022 (US$ Mn)

TABLE 178 Rest of Europe COMT Inhibitors Market, by Combination Therapy, 2023-2030 (US$ Mn)

TABLE 179 Asia Pacific COMT Inhibitors Market, by Product type, 2017-2022 (US$ Mn)

TABLE 180 Asia Pacific COMT Inhibitors Market, by Product type, 2023-2030 (US$ Mn)

TABLE 181 Asia Pacific COMT Inhibitors Market, by Indication, 2017-2022 (US$ Mn)

TABLE 182 Asia Pacific COMT Inhibitors Market, by Indication, 2023-2030 (US$ Mn)

TABLE 183 Asia Pacific COMT Inhibitors Market, by Distribution Channel, 2017-2022 (US$ Mn)

TABLE 184 Asia Pacific COMT Inhibitors Market, by Distribution Channel, 2023-2030 (US$ Mn)

TABLE 185 Asia Pacific COMT Inhibitors Market, by Age group, By Region, 2017-2022 (US$ Mn)

TABLE 186 Asia Pacific COMT Inhibitors Market, by Age group, By Region, 2023-2030 (US$ Mn)

TABLE 187 Asia Pacific COMT Inhibitors Market, by Combination Therapy, 2017-2022 (US$ Mn)

TABLE 188 Asia Pacific COMT Inhibitors Market, by Combination Therapy, 2023-2030 (US$ Mn)

TABLE 189 China COMT Inhibitors Market, by Product type, 2017-2022 (US$ Mn)

TABLE 190 China COMT Inhibitors Market, by Product type, 2023-2030 (US$ Mn)

TABLE 191 China COMT Inhibitors Market, by Indication, 2017-2022 (US$ Mn)

TABLE 192 China COMT Inhibitors Market, by Indication, 2023-2030 (US$ Mn)

TABLE 193 China COMT Inhibitors Market, by Distribution Channel, 2017-2022 (US$ Mn)

TABLE 194 China COMT Inhibitors Market, by Distribution Channel, 2023-2030 (US$ Mn)

TABLE 195 China COMT Inhibitors Market, by Age group, By Region, 2017-2022 (US$ Mn)

TABLE 196 China COMT Inhibitors Market, by Age group, By Region, 2023-2030 (US$ Mn)

TABLE 197 China COMT Inhibitors Market, by Combination Therapy, 2017-2022 (US$ Mn)

TABLE 198 China COMT Inhibitors Market, by Combination Therapy, 2023-2030 (US$ Mn)

TABLE 199 Japan COMT Inhibitors Market, by Product type, 2017-2022 (US$ Mn)

TABLE 200 Japan COMT Inhibitors Market, by Product type, 2023-2030 (US$ Mn)

TABLE 201 Japan COMT Inhibitors Market, by Indication, 2017-2022 (US$ Mn)

TABLE 202 Japan COMT Inhibitors Market, by Indication, 2023-2030 (US$ Mn)

TABLE 203 Japan COMT Inhibitors Market, by Distribution Channel, 2017-2022 (US$ Mn)

TABLE 204 Japan COMT Inhibitors Market, by Distribution Channel, 2023-2030 (US$ Mn)

TABLE 205 Japan COMT Inhibitors Market, by Age group, By Region, 2017-2022 (US$ Mn)

TABLE 206 Japan COMT Inhibitors Market, by Age group, By Region, 2023-2030 (US$ Mn)

TABLE 207 Japan COMT Inhibitors Market, by Combination Therapy, 2017-2022 (US$ Mn)

TABLE 208 Japan COMT Inhibitors Market, by Combination Therapy, 2023-2030 (US$ Mn)

TABLE 209 India COMT Inhibitors Market, by Product type, 2017-2022 (US$ Mn)

TABLE 210 India COMT Inhibitors Market, by Product type, 2023-2030 (US$ Mn)

TABLE 211 India COMT Inhibitors Market, by Indication, 2017-2022 (US$ Mn)

TABLE 212 India COMT Inhibitors Market, by Indication, 2023-2030 (US$ Mn)

TABLE 213 India COMT Inhibitors Market, by Distribution Channel, 2017-2022 (US$ Mn)

TABLE 214 India COMT Inhibitors Market, by Distribution Channel, 2023-2030 (US$ Mn)

TABLE 215 India COMT Inhibitors Market, by Age group, By Region, 2017-2022 (US$ Mn)

TABLE 216 India COMT Inhibitors Market, by Age group, By Region, 2023-2030 (US$ Mn)

TABLE 217 India COMT Inhibitors Market, by Combination Therapy, 2017-2022 (US$ Mn)

TABLE 218 India COMT Inhibitors Market, by Combination Therapy, 2023-2030 (US$ Mn)

TABLE 219 South Korea COMT Inhibitors Market, by Product type, 2017-2022 (US$ Mn)

TABLE 220 South Korea COMT Inhibitors Market, by Product type, 2023-2030 (US$ Mn)

TABLE 221 South Korea COMT Inhibitors Market, by Indication, 2017-2022 (US$ Mn)

TABLE 222 South Korea COMT Inhibitors Market, by Indication, 2023-2030 (US$ Mn)

TABLE 223 South Korea COMT Inhibitors Market, by Distribution Channel, 2017-2022 (US$ Mn)

TABLE 224 South Korea COMT Inhibitors Market, by Distribution Channel, 2023-2030 (US$ Mn)

TABLE 225 South Korea COMT Inhibitors Market, by Age group, By Region, 2017-2022 (US$ Mn)

TABLE 226 South Korea COMT Inhibitors Market, by Age group, By Region, 2023-2030 (US$ Mn)

TABLE 227 South Korea COMT Inhibitors Market, by Combination Therapy, 2017-2022 (US$ Mn)

TABLE 228 South Korea COMT Inhibitors Market, by Combination Therapy, 2023-2030 (US$ Mn)

TABLE 229 South-East Asia COMT Inhibitors Market, by Product type, 2017-2022 (US$ Mn)

TABLE 230 South-East Asia COMT Inhibitors Market, by Product type, 2023-2030 (US$ Mn)

TABLE 231 South-East Asia COMT Inhibitors Market, by Indication, 2017-2022 (US$ Mn)

TABLE 232 South-East Asia COMT Inhibitors Market, by Indication, 2023-2030 (US$ Mn)

TABLE 233 South-East Asia COMT Inhibitors Market, by Distribution Channel, 2017-2022 (US$ Mn)

TABLE 234 South-East Asia COMT Inhibitors Market, by Distribution Channel, 2023-2030 (US$ Mn)

TABLE 235 South-East Asia COMT Inhibitors Market, by Age group, By Region, 2017-2022 (US$ Mn)

TABLE 236 South-East Asia COMT Inhibitors Market, by Age group, By Region, 2023-2030 (US$ Mn)

TABLE 237 South-East Asia COMT Inhibitors Market, by Combination Therapy, 2017-2022 (US$ Mn)

TABLE 238 South-East Asia COMT Inhibitors Market, by Combination Therapy, 2023-2030 (US$ Mn)

TABLE 239 Rest of Asia Pacific COMT Inhibitors Market, by Product type, 2017-2022 (US$ Mn)

TABLE 240 Rest of Asia Pacific COMT Inhibitors Market, by Product type, 2023-2030 (US$ Mn)

TABLE 241 Rest of Asia Pacific COMT Inhibitors Market, by Indication, 2017-2022 (US$ Mn)

TABLE 242 Rest of Asia Pacific COMT Inhibitors Market, by Indication, 2023-2030 (US$ Mn)

TABLE 243 Rest of Asia Pacific COMT Inhibitors Market, by Distribution Channel, 2017-2022 (US$ Mn)

TABLE 244 Rest of Asia Pacific COMT Inhibitors Market, by Distribution Channel, 2023-2030 (US$ Mn)

TABLE 245 Rest of Asia Pacific COMT Inhibitors Market, by Age group, By Region, 2017-2022 (US$ Mn)

TABLE 246 Rest of Asia Pacific COMT Inhibitors Market, by Age group, By Region, 2023-2030 (US$ Mn)

TABLE 247 Rest of Asia Pacific COMT Inhibitors Market, by Combination Therapy, 2017-2022 (US$ Mn)

TABLE 248 Rest of Asia Pacific COMT Inhibitors Market, by Combination Therapy, 2023-2030 (US$ Mn)

TABLE 249 Latin America COMT Inhibitors Market, by Product type, 2017-2022 (US$ Mn)

TABLE 250 Latin America COMT Inhibitors Market, by Product type, 2023-2030 (US$ Mn)

TABLE 251 Latin America COMT Inhibitors Market, by Indication, 2017-2022 (US$ Mn)

TABLE 252 Latin America COMT Inhibitors Market, by Indication, 2023-2030 (US$ Mn)

TABLE 253 Latin America COMT Inhibitors Market, by Distribution Channel, 2017-2022 (US$ Mn)

TABLE 254 Latin America COMT Inhibitors Market, by Distribution Channel, 2023-2030 (US$ Mn)

TABLE 255 Latin America COMT Inhibitors Market, by Age group, By Region, 2017-2022 (US$ Mn)

TABLE 256 Latin America COMT Inhibitors Market, by Age group, By Region, 2023-2030 (US$ Mn)

TABLE 257 Latin America COMT Inhibitors Market, by Combination Therapy, 2017-2022 (US$ Mn)

TABLE 258 Latin America COMT Inhibitors Market, by Combination Therapy, 2023-2030 (US$ Mn)

TABLE 259 Brazil COMT Inhibitors Market, by Product type, 2017-2022 (US$ Mn)

TABLE 260 Brazil COMT Inhibitors Market, by Product type, 2023-2030 (US$ Mn)

TABLE 261 Brazil COMT Inhibitors Market, by Indication, 2017-2022 (US$ Mn)

TABLE 262 Brazil COMT Inhibitors Market, by Indication, 2023-2030 (US$ Mn)

TABLE 263 Brazil COMT Inhibitors Market, by Distribution Channel, 2017-2022 (US$ Mn)

TABLE 264 Brazil COMT Inhibitors Market, by Distribution Channel, 2023-2030 (US$ Mn)

TABLE 265 Brazil COMT Inhibitors Market, by Age group, By Region, 2017-2022 (US$ Mn)

TABLE 266 Brazil COMT Inhibitors Market, by Age group, By Region, 2023-2030 (US$ Mn)

TABLE 267 Brazil COMT Inhibitors Market, by Combination Therapy, 2017-2022 (US$ Mn)

TABLE 268 Brazil COMT Inhibitors Market, by Combination Therapy, 2023-2030 (US$ Mn)

TABLE 269 Argentina COMT Inhibitors Market, by Product type, 2017-2022 (US$ Mn)

TABLE 270 Argentina COMT Inhibitors Market, by Product type, 2023-2030 (US$ Mn)

TABLE 271 Argentina COMT Inhibitors Market, by Indication, 2017-2022 (US$ Mn)

TABLE 272 Argentina COMT Inhibitors Market, by Indication, 2023-2030 (US$ Mn)

TABLE 273 Argentina COMT Inhibitors Market, by Distribution Channel, 2017-2022 (US$ Mn)

TABLE 274 Argentina COMT Inhibitors Market, by Distribution Channel, 2023-2030 (US$ Mn)

TABLE 275 Argentina COMT Inhibitors Market, by Age group, By Region, 2017-2022 (US$ Mn)

TABLE 276 Argentina COMT Inhibitors Market, by Age group, By Region, 2023-2030 (US$ Mn)

TABLE 277 Argentina COMT Inhibitors Market, by Combination Therapy, 2017-2022 (US$ Mn)

TABLE 278 Argentina COMT Inhibitors Market, by Combination Therapy, 2023-2030 (US$ Mn)

TABLE 279 Rest of Latin America COMT Inhibitors Market, by Product type, 2017-2022 (US$ Mn)

TABLE 280 Rest of Latin America COMT Inhibitors Market, by Product type, 2023-2030 (US$ Mn)

TABLE 281 Rest of Latin America COMT Inhibitors Market, by Indication, 2017-2022 (US$ Mn)

TABLE 282 Rest of Latin America COMT Inhibitors Market, by Indication, 2023-2030 (US$ Mn)

TABLE 283 Rest of Latin America COMT Inhibitors Market, by Distribution Channel, 2017-2022 (US$ Mn)

TABLE 284 Rest of Latin America COMT Inhibitors Market, by Distribution Channel, 2023-2030 (US$ Mn)

TABLE 285 Rest of Latin America COMT Inhibitors Market, by Age group, By Region, 2017-2022 (US$ Mn)

TABLE 286 Rest of Latin America COMT Inhibitors Market, by Age group, By Region, 2023-2030 (US$ Mn)

TABLE 287 Rest of Latin America COMT Inhibitors Market, by Combination Therapy, 2017-2022 (US$ Mn)

TABLE 288 Rest of Latin America COMT Inhibitors Market, by Combination Therapy, 2023-2030 (US$ Mn)

TABLE 289 Middle East COMT Inhibitors Market, by Product type, 2017-2022 (US$ Mn)

TABLE 290 Middle East COMT Inhibitors Market, by Product type, 2023-2030 (US$ Mn)

TABLE 291 Middle East COMT Inhibitors Market, by Indication, 2017-2022 (US$ Mn)

TABLE 292 Middle East COMT Inhibitors Market, by Indication, 2023-2030 (US$ Mn)

TABLE 293 Middle East COMT Inhibitors Market, by Distribution Channel, 2017-2022 (US$ Mn)

TABLE 294 Middle East COMT Inhibitors Market, by Distribution Channel, 2023-2030 (US$ Mn)

TABLE 295 Middle East COMT Inhibitors Market, by Age group, By Region, 2017-2022 (US$ Mn)

TABLE 296 Middle East COMT Inhibitors Market, by Age group, By Region, 2023-2030 (US$ Mn)

TABLE 297 Middle East COMT Inhibitors Market, by Combination Therapy, 2017-2022 (US$ Mn)

TABLE 298 Middle East COMT Inhibitors Market, by Combination Therapy, 2023-2030 (US$ Mn)

TABLE 299 UAE COMT Inhibitors Market, by Product type, 2017-2022 (US$ Mn)

TABLE 300 UAE COMT Inhibitors Market, by Product type, 2023-2030 (US$ Mn)

TABLE 301 UAE COMT Inhibitors Market, by Indication, 2017-2022 (US$ Mn)

TABLE 302 UAE COMT Inhibitors Market, by Indication, 2023-2030 (US$ Mn)

TABLE 303 UAE COMT Inhibitors Market, by Distribution Channel, 2017-2022 (US$ Mn)

TABLE 304 UAE COMT Inhibitors Market, by Distribution Channel, 2023-2030 (US$ Mn)

TABLE 305 UAE COMT Inhibitors Market, by Age group, By Region, 2017-2022 (US$ Mn)

TABLE 306 UAE COMT Inhibitors Market, by Age group, By Region, 2023-2030 (US$ Mn)

TABLE 307 UAE COMT Inhibitors Market, by Combination Therapy, 2017-2022 (US$ Mn)

TABLE 308 UAE COMT Inhibitors Market, by Combination Therapy, 2023-2030 (US$ Mn)

TABLE 309 Saudi Arabia COMT Inhibitors Market, by Product type, 2017-2022 (US$ Mn)

TABLE 310 Saudi Arabia COMT Inhibitors Market, by Product type, 2023-2030 (US$ Mn)

TABLE 311 Saudi Arabia COMT Inhibitors Market, by Indication, 2017-2022 (US$ Mn)

TABLE 312 Saudi Arabia COMT Inhibitors Market, by Indication, 2023-2030 (US$ Mn)

TABLE 313 Saudi Arabia COMT Inhibitors Market, by Distribution Channel, 2017-2022 (US$ Mn)

TABLE 314 Saudi Arabia COMT Inhibitors Market, by Distribution Channel, 2023-2030 (US$ Mn)

TABLE 315 Saudi Arabia COMT Inhibitors Market, by Age group, By Region, 2017-2022 (US$ Mn)

TABLE 316 Saudi Arabia COMT Inhibitors Market, by Age group, By Region, 2023-2030 (US$ Mn)

TABLE 317 Saudi Arabia COMT Inhibitors Market, by Combination Therapy, 2017-2022 (US$ Mn)

TABLE 318 Saudi Arabia COMT Inhibitors Market, by Combination Therapy, 2023-2030 (US$ Mn)

TABLE 319 Rest of Middle East COMT Inhibitors Market, by Product type, 2017-2022 (US$ Mn)

TABLE 320 Rest of Middle East COMT Inhibitors Market, by Product type, 2023-2030 (US$ Mn)

TABLE 321 Rest of Middle East COMT Inhibitors Market, by Indication, 2017-2022 (US$ Mn)

TABLE 322 Rest of Middle East COMT Inhibitors Market, by Indication, 2023-2030 (US$ Mn)

TABLE 323 Rest of Middle East COMT Inhibitors Market, by Distribution Channel, 2017-2022 (US$ Mn)

TABLE 324 Rest of Middle East COMT Inhibitors Market, by Distribution Channel, 2023-2030 (US$ Mn)

TABLE 325 Rest of Middle East COMT Inhibitors Market, by Age group, By Region, 2017-2022 (US$ Mn)

TABLE 326 Rest of Middle East COMT Inhibitors Market, by Age group, By Region, 2023-2030 (US$ Mn)

TABLE 327 Rest of Middle East COMT Inhibitors Market, by Combination Therapy, 2017-2022 (US$ Mn)

TABLE 328 Rest of Middle East COMT Inhibitors Market, by Combination Therapy, 2023-2030 (US$ Mn)

TABLE 329 Africa COMT Inhibitors Market, by Product type, 2017-2022 (US$ Mn)

TABLE 330 Africa COMT Inhibitors Market, by Product type, 2023-2030 (US$ Mn)

TABLE 331 Africa COMT Inhibitors Market, by Indication, 2017-2022 (US$ Mn)

TABLE 332 Africa COMT Inhibitors Market, by Indication, 2023-2030 (US$ Mn)

TABLE 333 Africa COMT Inhibitors Market, by Distribution Channel, 2017-2022 (US$ Mn)

TABLE 334 Africa COMT Inhibitors Market, by Distribution Channel, 2023-2030 (US$ Mn)

TABLE 335 Africa COMT Inhibitors Market, by Age group, By Region, 2017-2022 (US$ Mn)

TABLE 336 Africa COMT Inhibitors Market, by Age group, By Region, 2023-2030 (US$ Mn)

TABLE 337 Africa COMT Inhibitors Market, by Combination Therapy, 2017-2022 (US$ Mn)

TABLE 338 Africa COMT Inhibitors Market, by Combination Therapy, 2023-2030 (US$ Mn)

TABLE 339 South Africa COMT Inhibitors Market, by Product type, 2017-2022 (US$ Mn)

TABLE 340 South Africa COMT Inhibitors Market, by Product type, 2023-2030 (US$ Mn)

TABLE 341 South Africa COMT Inhibitors Market, by Indication, 2017-2022 (US$ Mn)

TABLE 342 South Africa COMT Inhibitors Market, by Indication, 2023-2030 (US$ Mn)

TABLE 343 South Africa COMT Inhibitors Market, by Distribution Channel, 2017-2022 (US$ Mn)

TABLE 344 South Africa COMT Inhibitors Market, by Distribution Channel, 2023-2030 (US$ Mn)

TABLE 345 South Africa COMT Inhibitors Market, by Age group, By Region, 2017-2022 (US$ Mn)

TABLE 346 South Africa COMT Inhibitors Market, by Age group, By Region, 2023-2030 (US$ Mn)

TABLE 347 South Africa COMT Inhibitors Market, by Combination Therapy, 2017-2022 (US$ Mn)

TABLE 348 South Africa COMT Inhibitors Market, by Combination Therapy, 2023-2030 (US$ Mn)

TABLE 349 Egypt COMT Inhibitors Market, by Product type, 2017-2022 (US$ Mn)

TABLE 350 Egypt COMT Inhibitors Market, by Product type, 2023-2030 (US$ Mn)

TABLE 351 Egypt COMT Inhibitors Market, by Indication, 2017-2022 (US$ Mn)

TABLE 352 Egypt COMT Inhibitors Market, by Indication, 2023-2030 (US$ Mn)

TABLE 353 Egypt COMT Inhibitors Market, by Distribution Channel, 2017-2022 (US$ Mn)

TABLE 354 Egypt COMT Inhibitors Market, by Distribution Channel, 2023-2030 (US$ Mn)

TABLE 355 Egypt COMT Inhibitors Market, by Age group, By Region, 2017-2022 (US$ Mn)

TABLE 356 Egypt COMT Inhibitors Market, by Age group, By Region, 2023-2030 (US$ Mn)

TABLE 357 Egypt COMT Inhibitors Market, by Combination Therapy, 2017-2022 (US$ Mn)

TABLE 358 Egypt COMT Inhibitors Market, by Combination Therapy, 2023-2030 (US$ Mn)

TABLE 359 Rest of Africa COMT Inhibitors Market, by Product type, 2017-2022 (US$ Mn)

TABLE 360 Rest of Africa COMT Inhibitors Market, by Product type, 2023-2030 (US$ Mn)

TABLE 361 Rest of Africa COMT Inhibitors Market, by Indication, 2017-2022 (US$ Mn)

TABLE 362 Rest of Africa COMT Inhibitors Market, by Indication, 2023-2030 (US$ Mn)

TABLE 363 Rest of Africa COMT Inhibitors Market, by Distribution Channel, 2017-2022 (US$ Mn)

TABLE 364 Rest of Africa COMT Inhibitors Market, by Distribution Channel, 2023-2030 (US$ Mn)

TABLE 365 Rest of Africa COMT Inhibitors Market, by Age group, By Region, 2017-2022 (US$ Mn)

TABLE 366 Rest of Africa COMT Inhibitors Market, by Age group, By Region, 2023-2030 (US$ Mn)

TABLE 367 Rest of Africa COMT Inhibitors Market, by Combination Therapy, 2017-2022 (US$ Mn)

TABLE 368 Rest of Africa COMT Inhibitors Market, by Combination Therapy, 2023-2030 (US$ Mn)

Frequently asked questions

How big is the global market for COMT inhibitors right now?

In 2022, the market for COMT inhibitors was estimated to be worth USD 948.5 million.

What is the COMT inhibitors market’s anticipated growth rate from 2023 to 2030?

The market for COMT inhibitors is anticipated to increase at a CAGR of 8.60% from 2023 to 2030, reaching USD 1835.16 million in 2030.

In terms of the product type, which market category is in the lead?

Tolcapone is the most popular category of product type.

Which segment is leading the market in terms of indication?

Parkinson’s disease, by indication, is the notable segment.

Which combination therapy segment is estimated to have the highest CAGR throughout the forecast period?

During the projection period, the levodopa category is anticipated to exhibit the highest CAGR.

In which region is the market for COMT inhibitors expanding?

The COMT inhibitors market was ruled by North America.

Who are the key participants in the market for COMT Inhibitors globally?

The top players include Orion Corporation, Roche, AbbVie Inc., Acadia Pharmaceuticals, Amneal Pharmaceutical, UCB, Teva Pharmaceutical, Novartis AG, Lundbeck A/S, and others.

What are the main market factors driving the COMT inhibitors sector?

The growing usage of COMT inhibitors as supplementary therapy for treating ADHD symptoms and research into their potential to improve focus, memory, and cognitive function are the factors propelling the growth of the COMT inhibitors market.

What main market challenges prevent the COMT inhibitors sector from growing?

The challenges limiting the growth of the COMT inhibitors market are reimbursement challenges and varying insurance coverage for COMT inhibitors affected patient access, disease complexity, and drug-drug interactions.

What are the main market opportunities for the COMT inhibitors sector?

The aspects that generate substantial prospects for the COMT inhibitors market include investigating the potential uses of currently available COMT inhibitors for other medical disorders and investigating the development of biologic COMT inhibitors for improved therapeutic benefits.

Middle East and Africa Veterinary Vaccines Market

Published:
Report ID: 37309

North America Cancer Therapy Market

Published:
Report ID: 37315

Liver Health Supplements Market

Published:
Report ID: 37298

Asia Pacific Stem Cell Therapy Market

Published:
Report ID: 37280

Walking Assist Devices Market

Published:
Report ID: 37276

Bladder Cancer Market

Published:
Report ID: 37219

US Dental Consumables Market

Published:
Report ID: 37217

Colorectal Cancer (CRC) Market

Published:
Report ID: 37236

Dural Graft Market

Published:
Report ID: 37234

Uterine Cancer Market

Published:
Report ID: 37235

US Active Pharmaceutical Ingredient (API) Market

Published:
Report ID: 37221

Cancer Supportive Care Market

Published:
Report ID: 1901

Purchase Options

$2999
Delivery Format: Excel.
$4999
Designed for the individual purchaser.
$6999
Users located at a single corporate site or regional office.
$7999
Allowed for unlimited sharing globally within one company.
Smallform of Sample request

Have a question?

User Profile

Don’t settle for less – trust Mitul to help you find the best solution.

Report delivery within 24 to 48 hours

– Other Info –

What people say?-

User Review

I am very impressed with the information in this report. The author clearly did their research when they came up with this product and it has already given me a lot of ideas.

Jana Schmidt
CEDAR CX Technologies

– Connect with us –

Phone

+91 6232 49 3207


support

24/7 Research Support


sales@credenceresearch.com

– Research Methodology –

Going beyond the basics: advanced techniques in research methodology

– Trusted By –

Pepshi, LG, Nestle
Motorola, Honeywell, Johnson and johnson
LG Chem, SIEMENS, Pfizer
Unilever, Samsonite, QIAGEN