Dynamic Line Rating Sensor Market Size, Share and Forecast 2032

Dynamic Line Rating (DLR) Sensor market size was valued at USD 61.93 million in 2024 and is projected to reach USD 300.05 million by 2032.

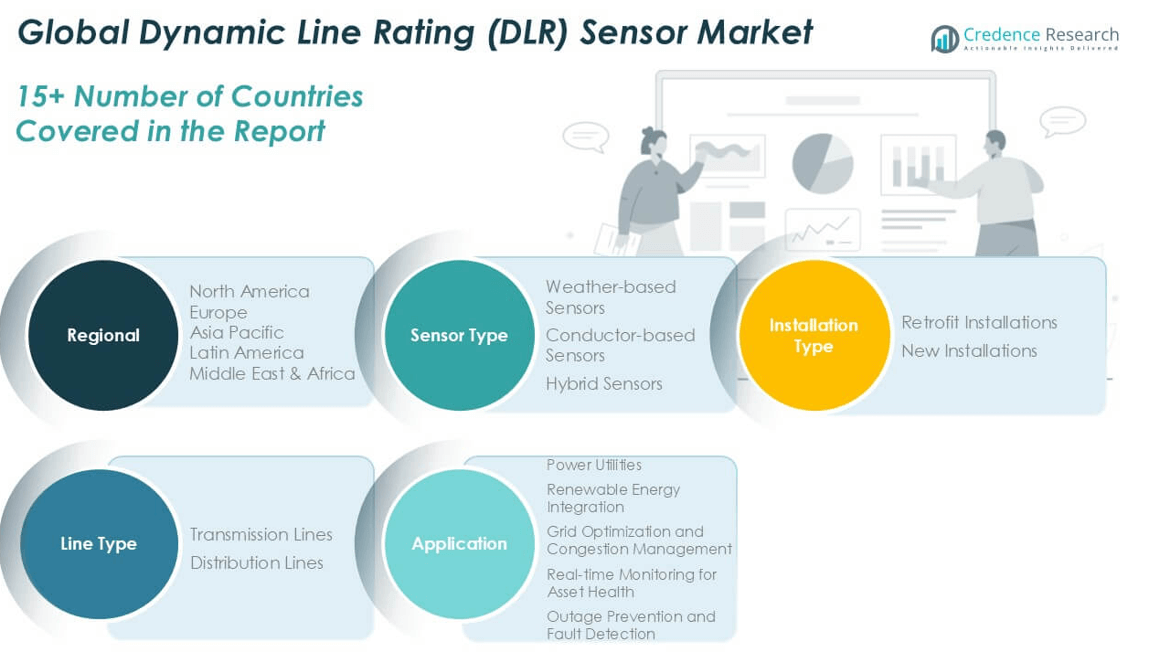
Dynamic Line Rating (DLR) Sensor Market By Sensor Type (Weather-based Sensors, Conductor-based Sensors, Hybrid Sensors); By Installation Type (Retrofit Installations, New Installations); By Line Type (Transmission Lines, Distribution Lines); By Application (Power Utilities, Renewable Energy Integration, Grid Optimization and Congestion Management, Real-time Monitoring for Asset Health, Outage Prevention and Fault Detection) – Growth, Share, Opportunities & Competitive Analysis, 2024 – 2032

SKU: CR15275Report Pages: 250Category: Semiconductor & ElectronicsReport Format: PDF, ExcelLast Updated: Jul 14Author: Sushant PhapalePreferred on

Market Report Metrics

Revenue, 2024 -
USD 61.93 million
Forecast Year -
2032
CAGR (2024–2032)
20.34%
Report Coverage
Global
REPORT ATTRIBUTE DETAILS
Historical Period 2020-2023
Base Year 2024
Forecast Period 2025-2032
Dynamic Line Rating (DLR) Sensor Market Size 2024 USD 61.93 million
Dynamic Line Rating (DLR) Sensor Market, CAGR 20.34%
Dynamic Line Rating (DLR) Sensor Market Size 2032 USD 300.05 million

Market Overview:

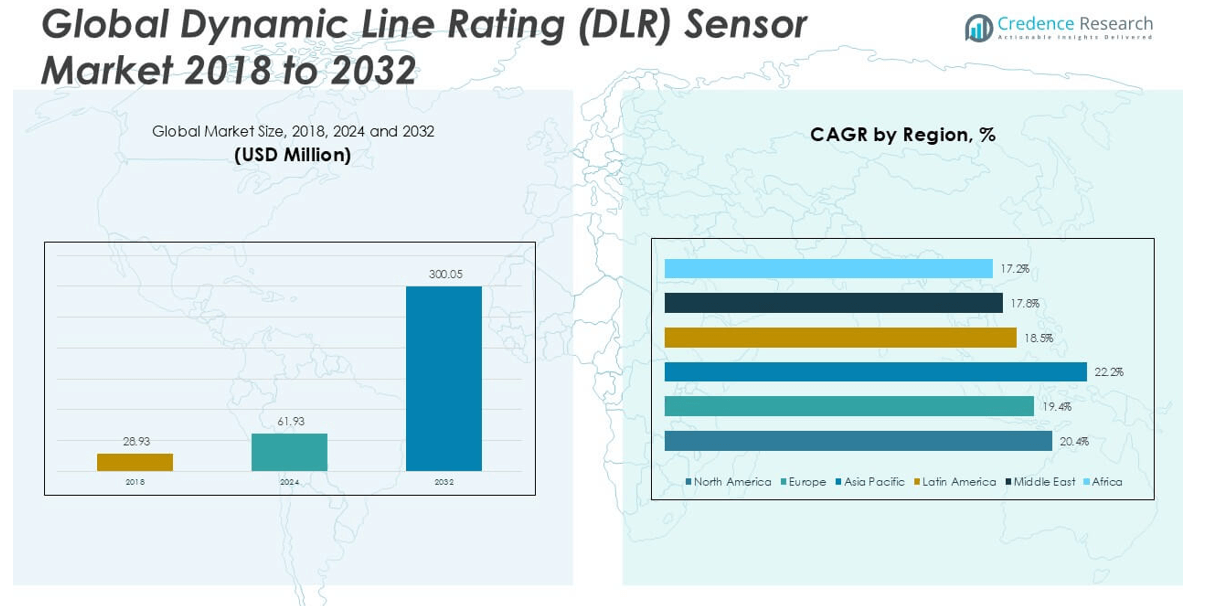
The Dynamic Line Rating (DLR) Sensor market size was valued at USD 28.93 million in 2018, increased to USD 61.93 million in 2024, and is anticipated to reach USD 300.05 million by 2032, at a CAGR of 20.34% during the forecast period.

The Dynamic Line Rating (DLR) Sensor market is led by key players such as Heimdall Power, Ampacimon, Lindsey Systems, General Electric (GE Vernova), and Schneider Electric SE, all of which offer advanced sensor technologies and integrated grid solutions. These companies are actively expanding their global footprints through partnerships and innovation in real-time monitoring systems. North America dominates the DLR Sensor market, accounting for 42.7% of the global market share in 2024, driven by robust grid modernization initiatives and early adoption of smart grid technologies. Europe follows with a 27.4% share, supported by strong regulatory frameworks and renewable integration efforts. Asia Pacific, with a growing focus on energy infrastructure and rising electricity demand, is the fastest-growing region, poised to significantly reshape the competitive landscape in the coming years.

Dynamic Line Rating (DLR) Sensor Market size

Market Insights

  • The Dynamic Line Rating (DLR) Sensor market was valued at USD 61.93 million in 2024 and is projected to reach USD 300.05 million by 2032, growing at a CAGR of 20.34% during the forecast period.
  • Growth is driven by rising demand for real-time grid optimization, increased renewable energy integration, and regulatory mandates for smart grid modernization.
  • Key trends include the shift toward predictive maintenance, integration of IoT-enabled sensors, and rapid advancements in wireless communication for enhanced data transmission.
  • The market is moderately consolidated, with leading players such as Heimdall Power, Ampacimon, and GE Vernova competing through innovation and strategic partnerships.
  • North America holds the largest regional share at 42.7%, followed by Europe at 27.4% and Asia Pacific at 20.9%; among segments, conductor-based sensors and retrofit installations dominate due to their precision and cost-efficiency in upgrading existing infrastructure.

Market Segmentation Analysis:

By Sensor Type

The Dynamic Line Rating (DLR) Sensor market, by sensor type, is segmented into weather-based sensors, conductor-based sensors, and hybrid sensors. Conductor-based sensors emerged as the dominant sub-segment in 2024, accounting for over 45% market share. Their accuracy in measuring real-time current and conductor temperature, essential for dynamic line capacity assessment, drives their adoption. The growing need for precise grid performance data and increasing deployment in aging power infrastructure further fuel their demand. While weather-based sensors are widely used, their limitations in providing direct conductor data give conductor-based sensors a competitive edge. Hybrid sensors are gaining momentum for combining the strengths of both.

  • For instance, LineVision's V3 system, a non-contact conductor-based sensor, has been deployed across more than 20 utilities and transmission operators globally and records up to 33,000 data points per second, enabling utilities to safely unlock up to 40% additional capacity on existing lines.

By Installation Type

In terms of installation type, the market is categorized into retrofit installations and new installations. Retrofit installations held the largest share in 2024, contributing approximately 58% of the market revenue. This dominance is attributed to the increasing need to upgrade existing transmission and distribution lines to meet rising power demands without constructing new infrastructure. Utilities prefer retrofitting with DLR sensors to maximize asset utilization, avoid bottlenecks, and ensure regulatory compliance with minimal investment. The growing focus on modernizing aging grids in developed economies and the cost-efficiency of retrofitting over complete replacements continue to drive this segment’s expansion.

  • For instance, Ampacimon’s retrofit-ready DLR system was installed on more than 700 transmission spans across Europe and North America, with each installation taking less than 90 minutes and requiring no service interruption, streamlining the modernization of legacy grids.

By Line Type

Based on line type, the DLR sensor market is segmented into transmission lines and distribution lines. Transmission lines led the segment in 2024, accounting for nearly 62% of the total market share. This dominance is driven by the increasing need to manage high-voltage lines efficiently and improve the reliability of long-distance power transfer. With growing integration of renewable energy sources into the grid, transmission lines require real-time monitoring to prevent overloads and manage fluctuating loads. The push for grid optimization and the demand for intelligent transmission systems further support the strong uptake of DLR sensors in this segment.

Market Overview

Rising Demand for Grid Optimization

The increasing pressure on utilities to enhance grid reliability and efficiency is a major driver for the Dynamic Line Rating (DLR) Sensor market. With fluctuating power demands and aging grid infrastructure, real-time monitoring of line capacity has become crucial. DLR sensors enable operators to optimize transmission efficiency, reduce congestion, and extend the lifespan of existing assets. This is particularly relevant in regions where building new infrastructure is costly or regulated. The emphasis on maximizing existing grid assets continues to fuel the adoption of DLR technologies across global power networks.

  • For instance, National Grid UK deployed Smart Wires' DLR and modular power flow control solutions across a 275 kV circuit, successfully increasing its capacity by 500 megawatts within three months without building new lines, demonstrating substantial operational optimization.

Integration of Renewable Energy Sources

The growing penetration of renewable energy, particularly wind and solar, has significantly increased the variability of power generation. DLR sensors help utilities manage this volatility by providing accurate, real-time data on line capacity and thermal limits. This enables efficient load balancing and prevents grid instability caused by renewable intermittency. As countries accelerate their transition to low-carbon energy, the demand for smart grid solutions like DLR sensors has intensified, positioning them as critical tools for integrating distributed energy resources and maintaining power quality across expanding transmission networks.

  • For instance, the Electric Power Research Institute (EPRI), in collaboration with Oncor Electric Delivery, integrated LineVision’s DLR system into a wind-heavy region in Texas, where it enabled a 22% increase in wind power throughput on a 138 kV line, measured over a 90-day pilot involving 1,200 hours of data collection.

Regulatory Push for Grid Modernization

Governments and regulatory bodies worldwide are mandating modernization of electrical infrastructure to improve resilience, safety, and sustainability. Policies encouraging smart grid deployment, real-time monitoring, and efficient asset utilization have led to increased investments in advanced sensor technologies like DLR. Financial incentives, grid reliability standards, and emission reduction targets further support the implementation of DLR solutions. As utilities align with these evolving regulations, DLR sensors are becoming integral components of grid modernization strategies, particularly in North America and Europe, where policy-driven upgrades are rapidly transforming traditional grid operations.

Key Trends & Opportunities

Shift Toward Predictive Maintenance and Asset Health Monitoring

A key trend gaining traction is the use of DLR sensors for predictive maintenance and condition-based monitoring. Utilities are moving away from periodic inspections toward real-time asset health analysis to prevent outages and optimize maintenance schedules. DLR sensors provide critical data on conductor temperature and line loading, enabling utilities to predict potential failures before they occur. This proactive approach not only reduces operational costs but also enhances grid reliability. The integration of analytics and AI with DLR data presents an opportunity to unlock even greater value in grid asset management.

  • For instance, New York Power Authority (NYPA) partnered with LineVision to install 55 DLR sensor units across 115 kV and 230 kV lines, generating more than 500,000 data points daily, which were analyzed using AI algorithms to identify thermal constraints and trigger condition-based alerts up to 96 hours in advance.

Advancements in Sensor Technology and Wireless Communication

Technological innovation in sensor design and wireless data transmission is expanding the capabilities of DLR systems. New-generation sensors offer higher accuracy, lower power consumption, and improved durability in harsh environmental conditions. The integration of IoT and cloud-based platforms allows seamless communication between sensors and control centers. These advancements open new opportunities for scalable deployment across remote and hard-to-reach transmission lines. As the industry embraces digitalization, manufacturers that offer compact, cost-effective, and interoperable DLR solutions are likely to gain competitive advantage in the evolving market landscape.

  • For instance, Lindsey Systems’ SMARTLINE-TD sensor platform transmits data every 30 seconds over 900 MHz and 2.4 GHz radio networks and operates for over 8 years on a single lithium battery, supporting continuous remote monitoring across 161 kV and 345 kV circuits in regions with extreme weather variations.

Key Challenges

High Initial Deployment Costs

Despite long-term benefits, the high upfront cost of DLR sensors and supporting infrastructure remains a barrier to widespread adoption. Utilities often face budget constraints and must prioritize investments, making it difficult to justify the initial expense of retrofitting existing lines. Additionally, the need for training, software integration, and maintenance further adds to the financial burden. Smaller utility providers, particularly in developing regions, may hesitate to adopt DLR solutions without external funding or clear short-term returns on investment, slowing the market’s overall penetration rate.

Integration Complexity with Legacy Systems

Integrating DLR systems with existing grid infrastructure and legacy control systems poses significant technical challenges. Many utilities operate outdated SCADA systems or have limited interoperability across their networks. Ensuring seamless communication between DLR sensors and these platforms requires customized software interfaces, skilled labor, and time-consuming deployment efforts. This complexity can lead to implementation delays and increased project costs. Utilities must invest in compatible platforms and staff training to fully leverage the benefits of DLR technology, which can hinder adoption in less digitally advanced regions.

Data Security and Reliability Concerns

With DLR systems relying heavily on wireless communication and cloud-based data transmission, concerns over cybersecurity and data integrity are rising. Unauthorized access or manipulation of real-time line data could compromise grid operations and pose safety risks. Utilities are increasingly cautious about deploying connected sensor systems without robust cybersecurity protocols. Ensuring data encryption, secure communication channels, and continuous monitoring is essential but adds to implementation costs and operational complexity. These concerns may delay decision-making, especially in highly regulated or risk-averse markets.

Regional Analysis

North America

North America led the Dynamic Line Rating (DLR) Sensor market in 2024, holding the largest revenue share of approximately 42.7%, with a market size rising from USD 12.48 million in 2018 to USD 26.42 million. The market is projected to reach USD 128.39 million by 2032, growing at a robust CAGR of 20.4%. This growth is driven by large-scale grid modernization programs, strong regulatory backing, and widespread deployment of smart grid technologies in the U.S. and Canada. Utilities in the region are actively integrating renewable sources, making DLR solutions essential for enhancing real-time transmission capacity and asset performance.

Europe

Europe accounted for around 27.4% of the global DLR Sensor market in 2024, with its value increasing from USD 8.22 million in 2018 to USD 16.96 million, and is anticipated to reach USD 77.38 million by 2032, expanding at a CAGR of 19.4%. The region's push for decarbonization, coupled with stringent energy efficiency regulations, is propelling the adoption of DLR systems. European nations are rapidly transitioning to renewable energy sources, which necessitates dynamic grid management. Additionally, high investment in transmission infrastructure and strong cross-border interconnection projects further support DLR sensor adoption across both Western and Central Europe.

Asia Pacific

Asia Pacific is the fastest-growing region in the DLR Sensor market, with a market value climbing from USD 5.57 million in 2018 to USD 12.91 million in 2024, and expected to reach USD 70.85 million by 2032 at a leading CAGR of 22.2%. The region held about 20.9% of the global share in 2024. Growth is fueled by expanding energy infrastructure in countries like China, India, and Japan, which are investing heavily in smart grid technologies. Increasing demand for electricity, urbanization, and large-scale renewable integration are prompting utilities to deploy DLR systems for real-time monitoring and grid optimization.

Latin America

Latin America contributed approximately 4.7% to the global DLR Sensor market in 2024, with the market growing from USD 1.36 million in 2018 to USD 2.88 million, and projected to reach USD 12.35 million by 2032, expanding at a CAGR of 18.5%. The region is gradually adopting smart grid technologies amid rising power demand and renewable integration efforts, particularly in Brazil, Chile, and Mexico. Investment in transmission upgrades and the need for cost-effective solutions for congestion management are key drivers. However, limited technical expertise and funding constraints may restrict faster adoption compared to other global regions.

Middle East

The Middle East DLR Sensor market was valued at USD 0.81 million in 2018 and increased to USD 1.59 million in 2024, capturing a 2.6% share of the global market. It is expected to reach USD 6.52 million by 2032, growing at a CAGR of 17.8%. The region’s demand is supported by efforts to modernize grid systems in the Gulf Cooperation Council (GCC) countries. Rising integration of solar power and increasing infrastructure development in countries like Saudi Arabia and the UAE are creating opportunities for DLR sensor deployment. However, adoption remains gradual due to high dependence on conventional grid operations.

Africa

Africa held the smallest share of the global DLR Sensor market at 1.9% in 2024, with the market size growing from USD 0.49 million in 2018 to USD 1.16 million, and projected to reach USD 4.56 million by 2032, expanding at a CAGR of 17.2%. The market is slowly gaining momentum as nations aim to expand electrification and improve grid reliability. South Africa, Egypt, and Nigeria are key contributors, investing in transmission upgrades and renewable energy. However, challenges such as limited financial resources, lack of skilled personnel, and infrastructure gaps continue to restrict the pace of DLR sensor adoption across the continent.

Dynamic Line Rating (DLR) Sensor Market segmentation

Market Segmentations:

By Sensor Type

  • Weather-based Sensors
  • Conductor-based Sensors
  • Hybrid Sensors

By Installation Type

  • Retrofit Installations
  • New Installations

By Line Type

  • Transmission Lines
  • Distribution Lines

By Application

  • Power Utilities
  • Renewable Energy Integration
  • Grid Optimization and Congestion Management
  • Real-time Monitoring for Asset Health
  • Outage Prevention and Fault Detection

By Geography

  • North America
    • U.S.
    • Canada
    • Mexico
  • Europe
    • Germany
    • France
    • U.K.
    • Italy
    • Spain
    • Rest of Europe
  • Asia Pacific
    • China
    • Japan
    • India
    • South Korea
    • South-east Asia
    • Rest of Asia Pacific
  • Latin America
    • Brazil
    • Argentina
    • Rest of Latin America
  • Middle East & Africa
    • GCC Countries
    • South Africa
    • Rest of the Middle East and Africa

Competitive Landscape

The Dynamic Line Rating (DLR) Sensor market features a moderately consolidated competitive landscape, with key players focusing on innovation, strategic partnerships, and global expansion to gain a competitive edge. Companies such as Heimdall Power, Ampacimon, and Lindsey Systems lead the market through advanced sensor technologies and reliable real-time monitoring solutions. Major industrial players like General Electric (GE Vernova), Schneider Electric SE, and Toshiba Corporation leverage their broad energy portfolios to offer integrated grid solutions, including DLR systems. Start-ups like Sentrisense and Gridpulse are introducing compact, IoT-enabled sensors, intensifying competition through agility and niche expertise. Collaborations with utilities, grid operators, and technology providers are common strategies to expand market presence and accelerate deployment. Moreover, companies are increasingly investing in R&D to enhance sensor accuracy, connectivity, and data analytics capabilities. As grid modernization accelerates globally, the competitive environment is expected to intensify, encouraging continuous innovation and the entrance of new, tech-focused players.

Key Player Analysis

  • Heimdall Power
  • Ampacimon
  • Lindsey Systems
  • General Electric (GE Vernova)
  • Sentient Energy, Inc.
  • Schneider Electric SE
  • Toshiba Corporation
  • Landis+Gyr
  • Sentrisense
  • Gridpulse
  • Laki Power
  • Energiot

Recent Developments

  • In June 2025, Landis+Gyr’s Revelo E360 and E660 Cellular grid sensors became the first electrical meters to achieve IoT Network Certified for Smart Connect Infrastructure™ by CTIA Certification. This certification validates the devices’ suitability for critical infrastructure, emphasizing cybersecurity and network performance for smart grid deployments.
  • In May 2025, Ampacimon, in collaboration with Drone Volt, introduced a drone-based solution for installing Dynamic Line Rating (DLR) sensorson live high-voltage power lines. This innovation allows for the rapid deployment of Ampacimon's Sense X DLR sensors on lines up to 315 kV, taking less than 90 seconds and without requiring a power outage. The system provides real-time monitoring of temperature, sag, current, and vibration, ensuring continuous and efficient grid monitoring, even in remote or high-risk areas.
  • In March 2025, Heimdall Power integrated Iridium's satellite connectivityinto its Neuron Dynamic Line Rating (DLR) sensors. This partnership enables real-time grid monitoring in remote areas by utilizing Iridium's global satellite network for reliable communication.
  • In March 2025, Landis+Gyr released the Revelo Cellular grid sensor, enabling advanced grid sensing, edge computing, and flexible deployment options like public/private LTE or omni-carrier services. The sensor offers high-resolution current and voltage data, power quality metrics, micro arc detection, and supports real-time grid management applications according to a press release from Landis+Gyr.

Market Concentration & Characteristics

The Dynamic Line Rating (DLR) Sensor Market exhibits a moderately concentrated structure, with a mix of established multinational players and emerging technology firms driving competition. It is characterized by a strong focus on innovation, real-time data analytics, and integration with smart grid infrastructure. Leading companies such as Heimdall Power, Ampacimon, GE Vernova, and Schneider Electric SE hold significant market share due to their advanced sensor technologies and large-scale project deployments. The market favors firms with deep technical expertise, robust product portfolios, and established relationships with utility providers. Regional players are gaining ground by offering cost-effective and flexible DLR solutions tailored to local grid requirements. It is shaped by high capital intensity, long sales cycles, and strong regulatory influence, particularly in North America and Europe. Demand for precision, reliability, and interoperability continues to influence product development. Barriers to entry remain moderate due to the need for technical know-how, integration capabilities, and compliance with grid standards.

Report Coverage

The research report offers an in-depth analysis based on Sensor Type, Installation Type, Line Type, Application and Geography. It details leading market players, providing an overview of their business, product offerings, investments, revenue streams, and key applications. Additionally, the report includes insights into the competitive environment, SWOT analysis, current market trends, as well as the primary drivers and constraints. Furthermore, it discusses various factors that have driven market expansion in recent years. The report also explores market dynamics, regulatory scenarios, and technological advancements that are shaping the industry. It assesses the impact of external factors and global economic changes on market growth. Lastly, it provides strategic recommendations for new entrants and established companies to navigate the complexities of the market.

Future Outlook

  1. The market will continue to grow rapidly due to increasing investments in smart grid infrastructure.
  2. Demand for real-time monitoring and grid optimization will drive wider adoption of DLR sensors.
  3. Integration of renewable energy sources will push utilities to deploy advanced sensor systems.
  4. Utilities will prefer retrofit installations to enhance existing infrastructure without major overhauls.
  5. Asia Pacific will emerge as a key growth region supported by expanding energy networks.
  6. Sensor technologies will evolve with better accuracy, wireless communication, and data analytics.
  7. Partnerships between sensor manufacturers and grid operators will strengthen market presence.
  8. Government regulations and grid reliability standards will support long-term market expansion.
  9. Predictive maintenance applications will boost the utility of DLR systems in asset management.
  10. Competitive pressure will increase as new entrants bring agile, cost-effective solutions to the market.
Dynamic Line Rating Sensor Market Size, Share and Forecast 2032
Report Attribute Details
Details
Historical Period
-
Base Year
2024
Forecast Period
2024–2032
Dynamic Line Rating (DLR) Sensor Size 2024
USD 61.93 million
Dynamic Line Rating (DLR) Sensor CAGR
20.34%
Dynamic Line Rating (DLR) Sensor Size 2032
USD 300.05 million

Request a Free Sample

Fill in your details and we'll send you a free sample report.

  • Sample data tables & charts
  • Research methodology

Need a Custom Version of This Report?

Tailor the scope, geography, or segments to your exact requirements.

  • Custom geography or segment scope
  • Direct access to our analyst team

Frequently Asked Questions

What is the current size of the Dynamic Line Rating (DLR) Sensor Market?
The market was valued at USD 61.93 million in 2024 and is projected to reach USD 300.05 million by 2032, growing at a CAGR of 20.34%.
What are the key segments within the Dynamic Line Rating (DLR) Sensor Market
The market is segmented by sensor type, installation type, line type, application, and geography.
What are some challenges faced by the Dynamic Line Rating (DLR) Sensor Market?
High initial costs, integration complexity with legacy systems, and data security concerns are major challenges.
Who are the major players in the Dynamic Line Rating (DLR) Sensor Market?
Key players include Heimdall Power, Ampacimon, GE Vernova, Schneider Electric SE, and Lindsey Systems.

Table of Content

Chapter 1. Report Introduction

  • 1.1 Report Description & Purpose
    • 1.1.1 Report Title & Market Definition
    • 1.1.2 Unique Selling Propositions (USP) & Key Differentiators
    • 1.1.3 Value Proposition for Stakeholders
  • 1.2 Research Objectives
    • 1.2.1 Market Sizing Objectives (Volume & Revenue)
    • 1.2.2 Segmentation Objectives
    • 1.2.3 Competitive Intelligence Objectives
    • 1.2.4 Forecast & Scenario Objectives
  • 1.3 Report Scope
    • 1.3.1 Dynamic Line Rating (DLR) Sensor Scope – Types & Subtypes Covered
    • 1.3.2 Geographic Scope – Regions & Countries Covered
    • 1.3.3 Historical Period, Base Year & Forecast Period (2024; forecast to 2032)
    • 1.3.4 Inclusions & Exclusions
  • 1.4 HS Code & Classification Framework
  • 1.5 Currency, Units & Pricing Basis
  • 1.6 Target Stakeholders
  • 1.7 Limitations & Assumptions

Chapter 2. Executive Summary

  • 2.1 Global Dynamic Line Rating (DLR) Sensor Market Snapshot
    • 2.1.1 Market Size – Historical (2024) & Forecast (2024-2032) (2024: USD 61.93 million → 2032: USD 300.05 million)
    • 2.1.2 Volume & Revenue – Global Totals
    • 2.1.3 Key Market Highlights – Top Five Facts
  • 2.2 Dynamic Line Rating (DLR) Sensor Market Segmentation Snapshot
    • 2.2.1 Market Split by Region – 2024 vs. 2032
  • 2.3 Competitive Snapshot
    • 2.3.1 Top 10 Players by Revenue Share – 2024
    • 2.3.2 Top 10 Players by Volume Share – 2024
    • 2.3.3 Recent Strategic Developments (18-Month Summary)
  • 2.4 Key Investment Highlights & Strategic Conclusions

Chapter 3. Dynamic Line Rating (DLR) Sensor Market Dynamics & Industry Analysis

  • 3.1 Market Overview & Context
    • 3.1.1 Dynamic Line Rating (DLR) Sensor Market Position in the Broader Automotive Value Chain
    • 3.1.2 OEM vs. Replacement Market Dynamics
    • 3.1.3 Market Maturity & Development Stage by Region
  • 3.2 Dynamic Line Rating (DLR) Sensor Market Drivers
  • 3.3 Dynamic Line Rating (DLR) Sensor Market Restraints & Challenges
  • 3.4 Dynamic Line Rating (DLR) Sensor Market Opportunities
  • 3.5 Porter's Five Forces Analysis
    • 3.5.1 Threat of New Entrants
    • 3.5.2 Bargaining Power of Suppliers
    • 3.5.3 Bargaining Power of Buyers
    • 3.5.4 Threat of Substitutes
    • 3.5.5 Competitive Rivalry – Intensity Assessment
  • 3.6 Dynamic Line Rating (DLR) Sensor Value Chain Analysis
    • 3.6.1 Upstream – Raw Material/Input Suppliers
      • 3.6.1.1 Raw Material/Input 1
      • 3.6.1.2 Raw Material/Input 2
      • 3.6.1.3 Raw Material/Input 3
    • 3.6.2 Midstream – Production/Manufacturing/Service Delivery
      • 3.6.2.1 Production/Process Overview
      • 3.6.2.2 Key Facility Locations & Capacity by Manufacturer
    • 3.6.3 Downstream – Distribution & End Consumer
      • 3.6.3.1 Primary Channel – B2B/OEM
      • 3.6.3.2 Secondary Channels – Dealer, Retail, Online, Direct
    • 3.6.4 Value Chain Profitability Analysis
  • 3.7 PESTEL Analysis
    • 3.7.1 Political Factors
    • 3.7.2 Economic Factors
    • 3.7.3 Social Factors
    • 3.7.4 Technological Factors
    • 3.7.5 Environmental Factors
    • 3.7.6 Legal Factors
  • 3.8 Dynamic Line Rating (DLR) Sensor Supply Chain Analysis
    • 3.8.1 Raw Material/Input Supply Risk Assessment
    • 3.8.2 Manufacturing Concentration Risk (Geographic Exposure)
    • 3.8.3 Trade Disruption Impact Analysis
  • 3.9 Regulatory & Policy Landscape

Note: The regulatory and policy landscape section covers regulations based on their applicability to the market, Dynamic Line Rating (DLR) Sensor category, geography, and scope of the study. Only regulatory frameworks with a material impact on operations, compliance, trade, sustainability, or market access are analyzed in detail.

Chapter 4. Key Investment Pockets & Opportunity Analysis

  • 4.1 Dynamic Line Rating (DLR) Sensor Market Attractiveness Analysis
    • 4.1.1 By Region – Investment Attractiveness Matrix (Volume × CAGR)
  • 4.2 Absolute Revenue Growth Opportunity
    • 4.2.1 By Region – Absolute USD Growth Through 2032
  • 4.3 Incremental Volume Opportunity
    • 4.3.1 By Region – Incremental Volume Through 2032
    • 4.3.2 Segment – Incremental Volume
  • 4.4 Emerging Submarket Opportunity Deep Dive (Subject to Applicability)
  • 4.5 Emerging Market Opportunity Scorecards
    • 4.5.1 United States
    • 4.5.2 Europe
    • 4.5.3 Asia
    • 4.5.4 Middle East & Africa

Note: Emerging Market Opportunity Scorecards will be included based on relevance and strategic importance. Regions listed are indicative and may vary depending on data availability and market dynamics.

Chapter 5. Dynamic Line Rating (DLR) Sensor Import-Export Analysis & Trade Flows

  • 5.1 Global Trade Overview
    • 5.1.1 Global Export Value by Country (2024)
    • 5.1.2 Global Export Volume by Country (2024)
    • 5.1.3 Global Import Value by Country (2024)
    • 5.1.4 Global Import Volume by Country (2024)
    • 5.1.5 Net Trade Balance by Country (2024)
  • 5.2 Export Analysis – Segment
    • 5.2.1 Type 1 (HS Code)
    • 5.2.2 Type 2 (HS Code)
    • 5.2.3 Type 3 (HS Code)
    • 5.2.4 Type 4 (HS Code)
    • 5.2.5 Type 5 (HS Code)
  • 5.3 Import Analysis – Segment
    • 5.3.1 Type 1 (HS Code)
    • 5.3.2 Type 2 (HS Code)
    • 5.3.3 Type 3 (HS Code)
    • 5.3.4 Type 4 (HS Code)
    • 5.3.5 Type 5 (HS Code)
  • 5.4 Average Unit Trade Prices
    • 5.4.1 Average Export Price – Segment & Country
    • 5.4.2 Average Import Price – Segment & Source Country
    • 5.4.3 Price Trends (2024)
  • 5.5 Key Trade Route Analysis
    • 5.5.1 Trade Route 1
    • 5.5.2 Trade Route 2
    • 5.5.3 Trade Route 3
    • 5.5.4 Trade Route 4
    • 5.5.5 Trade Route 5
  • 5.6 Trade Policy Impact Assessment
    • 5.6.1 US Anti-Dumping & Section 301 Tariffs
    • 5.6.2 EU Customs Union Impact
    • 5.6.3 Major Free Trade Agreements
    • 5.6.4 USMCA Rules of Origin

Note: Trade policy analysis will be included only where relevant to the Dynamic Line Rating (DLR) Sensor market.

Chapter 6. Competitive Landscape & Company Benchmarking

  • 6.1 Dynamic Line Rating (DLR) Sensor Market Concentration & Structure
    • 6.1.1 Herfindahl-Hirschman Index (HHI) – vs. 2024
    • 6.1.2 Tier 1, Tier 2 & Tier 3 Market Structure
    • 6.1.3 Global, Regional & Local Player Dynamics
  • 6.2 Dynamic Line Rating (DLR) Sensor Market Share Analysis – 2024
    • 6.2.1 Global Revenue Share by Company
    • 6.2.2 Global Volume Share by Company
    • 6.2.3 Regional Revenue Share
    • 6.2.4 Market Share Evolution ( vs. 2024)
    • 6.2.5 OEM Segment Share by Company
    • 6.2.6 Replacement Segment Share by Company
  • 6.3 Production/Delivery Capacity & Facility Analysis
    • 6.3.1 Global Installed Capacity
    • 6.3.2 Capacity Utilization Rates
    • 6.3.3 Production/Output Volume
    • 6.3.4 Facility Locations & Capacity Map
    • 6.3.5 Planned Capacity Additions
  • 6.4 Dynamic Line Rating (DLR) Sensor Competitive Benchmarking Matrix
    • 6.4.1 Revenue, Volume, CAGR & Profitability Comparison
    • 6.4.2 Channel Revenue Mix
    • 6.4.3 Geographic Revenue Exposure
    • 6.4.4 R&D Intensity
    • 6.4.5 Sustainability Maturity
  • 6.5 Strategic Developments in Dynamic Line Rating (DLR) Sensor (Last 24 Months)
    • 6.5.1 Mergers, Acquisitions & Divestments
    • 6.5.2 New Dynamic Line Rating (DLR) Sensor Launches
    • 6.5.3 Facility Expansions
    • 6.5.4 Strategic Alliances, Joint Ventures & Partnerships
    • 6.5.5 Distribution Expansion & Market Entry
    • 6.5.6 Sustainability & ESG Initiatives
  • 6.6 Competitive Strategy Mapping
    • 6.6.1 Leader, Challenger, Follower & Niche Classification
    • 6.6.2 Pricing Strategy Comparison
    • 6.6.3 Channel Strategy Matrix

Note: Strategic developments are included based on their materiality and the availability of reliable information.

Chapter 7. Global Dynamic Line Rating (DLR) Sensor Market – By Distribution Channel

  • 7.1 Segment Overview
    • 7.1.1 Volume & Revenue Split by Channel (2024 & 2032)
    • 7.1.2 Channel Mix Evolution (2024-2032)

Chapter 8. Regional Market Analysis – Global Overview

  • 8.1 Global Regional Overview
    • 8.1.1 Regional Volume Share
    • 8.1.2 Regional Revenue Share
    • 8.1.3 Regional Volume by Region
    • 8.1.4 Regional Revenue by Region
    • 8.1.5 Regional Forecast Through 2032
  • 8.2 Cross-Regional Segment Analysis
    • 8.2.1 By Distribution Channel
    • 8.2.2 By Brand/Price Tier

Chapter 9. North America Dynamic Line Rating (DLR) Sensor Market

  • 9.1 United States
  • 9.2 Canada
  • 9.3 Mexico

Chapter 10. Europe Dynamic Line Rating (DLR) Sensor Market

  • 10.1 Germany
  • 10.2 France
  • 10.3 Italy
  • 10.4 United Kingdom
  • 10.5 Spain
  • 10.6 Poland
  • 10.7 Russia
  • 10.8 Netherlands
  • 10.9 Belgium
  • 10.10 Sweden
  • 10.11 Denmark
  • 10.12 Norway
  • 10.13 Rest of Europe

Chapter 11. Asia Pacific Dynamic Line Rating (DLR) Sensor Market

  • 11.1 China
  • 11.2 India
  • 11.3 Japan
  • 11.4 South Korea
  • 11.5 Thailand
  • 11.6 Indonesia
  • 11.7 Vietnam
  • 11.8 Malaysia
  • 11.9 Australia
  • 11.10 Rest of Asia Pacific

Chapter 12. Latin America Dynamic Line Rating (DLR) Sensor Market

  • 12.1 Brazil
  • 12.2 Argentina
  • 12.3 Colombia
  • 12.4 Chile
  • 12.5 Rest of Latin America

Chapter 13. Middle East Dynamic Line Rating (DLR) Sensor Market

  • 13.1 Saudi Arabia
  • 13.2 United Arab Emirates
  • 13.3 Turkey
  • 13.4 Israel
  • 13.5 Iran
  • 13.6 Rest of the Middle East

Chapter 14. Africa Dynamic Line Rating (DLR) Sensor Market

  • 14.1 South Africa
  • 14.2 Egypt
  • 14.3 Nigeria
  • 14.4 Morocco
  • 14.5 Rest of Africa

Chapter 15. Dynamic Line Rating (DLR) Sensor Company Profiles

  • 15.1 [Company 01]
    • 15.1.1 Company Overview
    • 15.1.2 Key Management Personnel
    • 15.1.3 Products & Services Portfolio
    • 15.1.4 Financial Performance
    • 15.1.5 Key Market Focus & Geographic Presence
    • 15.1.6 Recent Developments & Strategic Initiatives

Note: The company profile list is preliminary and may change based on research findings, market developments, data availability, and client requirements.

Chapter 16. Appendices

  • Appendix A – List of Abbreviations & Acronyms
  • Appendix B – Industry Classification Code Reference – Full Series
  • Appendix C – Production & Capacity Data Tables
  • Appendix D – End-Use & Demand Base Tables
  • Appendix E – Consumption & Replacement Rate Assumptions
  • Appendix F – ASP Reference Tables
  • Appendix G – Manufacturing & Facility Database
  • Appendix H – Import-Export Data Tables
  • Appendix I – Regulatory Summary Tables
  • Appendix J – Primary Research Participant List (Anonymized)
  • Appendix K – Primary Research Questionnaire Framework
  • Appendix L – Data Sources & Bibliography
  • Appendix M – Market Size Divergence & Source Comparison

Chapter 17. Research Methodology

  • 17.1 Research Framework & Philosophy
  • 17.2 Secondary Research – Sources, Hierarchy & Data Extraction
  • 17.3 Data Modeling – Bottom-Up & Top-Down Market Sizing
  • 17.4 Primary Research – Stakeholder Framework, LOI & Sample Sizes
  • 17.5 Forecast Methodology – Regression, Scenario & Sensitivity Analysis
  • 17.6 Quality Control – Four-Layer Validation Framework
  • 17.7 Limitations & Standard Assumptions
  • 17.8 Disclaimer

Methodology

Meet the Team

Sushant Phapale
Sushant Phapale

ICT & Automation Expert

Sushant is an expert in ICT, automation, and electronics with a passion for innovation and market trends.

Related Topics

North America Emotion Detection & Recognition Market Size and Forecast 2032

The North America Emotion Detection & Recognition Market size was valued at USD 8,912.22 MN in 2021 and reached USD 13,270.48 MN in 2025. It is anticipated to reach USD 29,514.36 MN by 2032, growing at a CAGR of 10.23% during the forecast period.

U.S. Semiconductor Logistics Market Size. Growth & Forecast 2032

The U.S. Semiconductor Logistics Market size was valued at USD 17,679.20 million in 2026. It is anticipated to reach USD 27,714.20 million by 2032, growing at a CAGR of 7.80% during the forecast period.

Electricity and Signal Testing Instruments Market Size & Forecast 2032

The Electricity and Signal Testing Instruments market size was valued at USD 65,890 million in 2024 and to reach USD 99,596.45 million by 2032

Axial Flux Motor Market Size, Share, Growth and Forecast 2032

The Axial Flux Motor Market is projected to grow from USD 1501.72 million in 2025 to USD 4,970.69 million by 2032, at a CAGR of 18.65%.

RT-AGT & RT-APM Market Size, Growth, Share and Forecast 2032

The global RT-AGT & RT-APM market size was valued at USD 731.86 million in 2021 and reached USD 1,045.09 million in 2025. It is anticipated to reach USD 1,659.59 million by 2032, growing at a CAGR of 6.77% during the forecast period.

Vaporizers, E-Cigarettes, and Other Electronic Nicotine Delivery Systems Market

The Vaporizers, E-Cigarettes, and Other Electronic Nicotine Delivery Systems (ENDS) market reached USD 16,950 million in 2024. The market is projected to grow to USD 25,815.57 million by 2032