CHAPTER NO. 1 : INTRODUCTION 19
1.1.1. Report Description 19
Purpose of the Report 19
USP & Key Offerings 19
1.1.2. Key Benefits for Stakeholders 19
1.1.3. Target Audience 20
1.1.4. Report Scope 20
CHAPTER NO. 2 : EXECUTIVE SUMMARY 21
2.1. Dark Fiber Market Snapshot 21
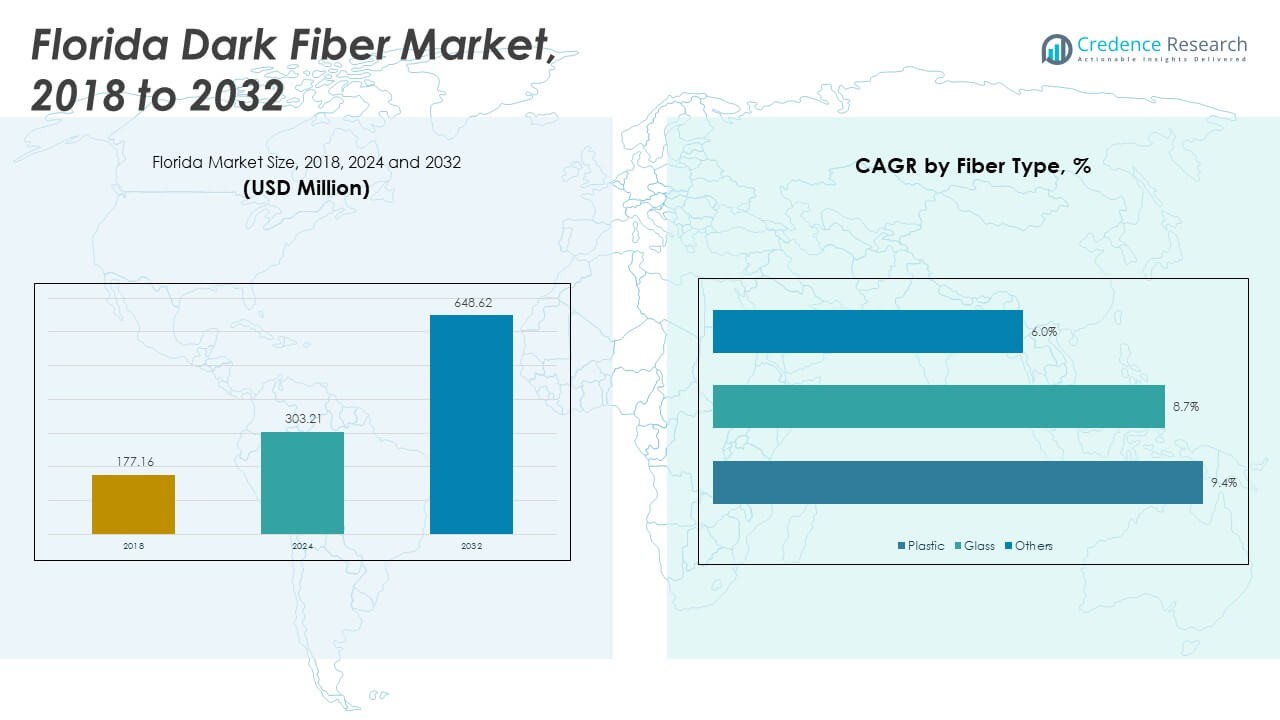
2.1.1. Florida Dark Fiber Market, Volume (Kilometres) & Revenue (USD Million) 2018 – 2032 23
2.2. Insights from Primary Respondents 23
CHAPTER NO. 3 : DARK FIBER MARKET – INDUSTRY ANALYSIS 24
3.1. Introduction 24
3.2. Market Drivers 25
3.2.1. Increasing Demand for High-Speed Data Connectivity 25
3.2.2. Expansion of Telecom and Data Center Infrastructure 26
3.3. Market Restraints 27
3.3.1. High Initial Deployment Costs 27
3.4. Market Opportunities 28
3.4.1. Market Opportunity Analysis 28
3.5. Porter’s Five Forces Analysis 29
3.6. Value Chain Analysis 30
3.7. Buying Criteria 31
CHAPTER NO. 4 : INSTALLED CAPACITY 32
4.1. Installed capacity 32
4.1.1. Florida Dark Fiber Market Installed capacity, By Florida, 2018 – 2023 32
CHAPTER NO. 5 : PRICE ANALYSIS 33
5.1. Price Analysis by Fiber Type 33
5.1.1. Florida Dark Fiber Market Price, By Fiber Type, 2018 – 2023 33
5.1.2. Florida Fiber Type Market Price, By Fiber Type, 2018 – 2023 33
CHAPTER NO. 6 : ANALYSIS COMPETITIVE LANDSCAPE 34
6.1. Company Market Share Analysis – 2023 34
6.1.1. Florida Dark Fiber Market: Company Market Share, by Revenue, 2023 34
6.1.2. Florida Dark Fiber Market: Company Market Share, by Revenue, 2023 35
6.1.3. Florida Dark Fiber Market: Top 6 Company Market Share, by Revenue, 2023 35
6.1.4. Florida Dark Fiber Market: Top 3 Company Market Share, by Revenue, 2023 36
6.2. Florida Dark Fiber Market Company Volume Market Share, 2023 37
6.3. Florida Dark Fiber Market Company Revenue Market Share, 2023 38
6.4. Company Assessment Metrics, 2023 39
6.4.1. Stars 39
6.4.2. Emerging Leaders 39
6.4.3. Pervasive Players 39
6.4.4. Participants 39
6.5. Start-ups /SMEs Assessment Metrics, 2023 39
6.5.1. Progressive Companies 39
6.5.2. Responsive Companies 39
6.5.3. Dynamic Companies 39
6.5.4. Starting Blocks 39
6.6. Strategic Developments 40
6.6.1. Acquisitions & Mergers 40
New Product Launch 40
Florida Expansion 40
6.7. Key Players Product Matrix 41
CHAPTER NO. 7 : PESTEL & ADJACENT MARKET ANALYSIS 42
7.1. PESTEL 42
7.1.1. Political Factors 42
7.1.2. Economic Factors 42
7.1.3. Social Factors 42
7.1.4. Technological Factors 42
7.1.5. Environmental Factors 42
7.1.6. Legal Factors 42
7.2. Adjacent Market Analysis 42
CHAPTER NO. 8 : DARK FIBER MARKET – BY FIBER TYPE SEGMENT ANALYSIS 43
8.1. Dark Fiber Market Overview, by Fiber Type Segment 43
8.1.1. Dark Fiber Market Revenue Share, By Fiber Type, 2023 & 2032 44
8.1.2. Dark Fiber Market Attractiveness Analysis, By Fiber Type 45
8.1.3. Incremental Revenue Growth Opportunity, by Fiber Type, 2024 – 2032 45
8.1.4. Dark Fiber Market Revenue, By Fiber Type, 2018, 2023, 2027 & 2032 46
8.2. Plastic 47
8.3. Glass 48
8.4. Others 49
CHAPTER NO. 9 : DARK FIBER MARKET – BY TECHNOLOGY SEGMENT ANALYSIS 50
9.1. Dark Fiber Market Overview, by Technology Segment 50
9.1.1. Dark Fiber Market Revenue Share, By Technology, 2023 & 2032 51
9.1.2. Dark Fiber Market Attractiveness Analysis, By Technology 52
9.1.3. Incremental Revenue Growth Opportunity, by Technology, 2024 – 2032 52
9.1.4. Dark Fiber Market Revenue, By Technology, 2018, 2023, 2027 & 2032 53
9.2. DWDM (Dense Wavelength Division Multiplexing) 54
9.3. CWDM (Coarse Wavelength Division Multiplexing) 55
9.4. Others 56
CHAPTER NO. 10 : DARK FIBER MARKET – BY SERVICE SEGMENT ANALYSIS 57
10.1. Dark Fiber Market Overview, by Service Segment 57
10.1.1. Dark Fiber Market Revenue Share, By Service, 2023 & 2032 58
10.1.2. Dark Fiber Market Attractiveness Analysis, By Service 59
10.1.3. Incremental Revenue Growth Opportunity, by Service, 2024 – 2032 59
10.1.4. Dark Fiber Market Revenue, By Service, 2018, 2023, 2027 & 2032 60
10.2. Single-mode 61
10.3. Multimode 62
10.4. Mobile Backhaul 63
CHAPTER NO. 11 : DARK FIBER MARKET – BY TECHNOLOGY SEGMENT ANALYSIS 64
11.1. Dark Fiber Market Overview, by Pricing Model Segment 64
11.1.1. Dark Fiber Market Revenue Share, By Pricing Model, 2023 & 2032 65
11.1.2. Dark Fiber Market Attractiveness Analysis, By Pricing Model 66
11.1.3. Incremental Revenue Growth Opportunity, by Pricing Model, 2024 – 2032 66
11.1.4. Dark Fiber Market Revenue, By Pricing Model, 2018, 2023, 2027 & 2032 67
11.2. Price per strand-mile 68
11.3. Price per route-mile 69
11.4. Price per fiber-pair 70
11.5. Monthly Recurring Charge (MRC) vs Non-Recurring Charge (NRC) 71
CHAPTER NO. 12 : DARK FIBER MARKET – BY CUSTOMER TYPE SEGMENT ANALYSIS 72
12.1. Dark Fiber Market Overview, by Customer Type Segment 72
12.1.1. Dark Fiber Market Revenue Share, By Customer Type, 2023 & 2032 73
12.1.2. Dark Fiber Market Attractiveness Analysis, By Customer Type 74
12.1.3. Incremental Revenue Growth Opportunity, by Customer Type, 2024 – 2032 74
12.1.4. Dark Fiber Market Revenue, By Customer Type, 2018, 2023, 2027 & 2032 75
12.2. Telecom carriers / backbone providers 76
12.3. Data centers 77
12.4. Enterprise / corporate private networks 78
12.5. Municipal / utility networks 79
12.6. Healthcare / education / government networks 80
12.7. 5G backhaul / mobile operators 81
CHAPTER NO. 13 : DARK FIBER MARKET – BY ROUTE SEGMENT ANALYSIS 82
13.1. Dark Fiber Market Overview, by Route Segment 82
13.1.1. Dark Fiber Market Revenue Share, By Route, 2023 & 2032 83
13.1.2. Dark Fiber Market Attractiveness Analysis, By Route 84
13.1.3. Incremental Revenue Growth Opportunity, by Route, 2024 – 2032 84
13.1.4. Dark Fiber Market Revenue, By Route, 2018, 2023, 2027 & 2032 85
13.2. Naples – Miami 86
13.3. Naples – Tampa 87
13.4. Tampa – Jacksonville 88
13.5. Miami – Jacksonville 89
13.6. Other major Florida corridors 90
CHAPTER NO. 14 : COMPANY PROFILES 91
14.1. South Reach Networks (SRN) 91
14.1.1. Company Overview 91
14.1.2. Product Portfolio 91
14.1.3. Swot Analysis 91
14.1.4. Business Strategy 91
14.1.5. Financial Overview 92
14.2. FPL FiberNet, LLC 93
14.3. Dark Fiber Systems, Inc. 93
14.4. Southern Telecom, Inc. (STI) 93
14.5. Company 5 93
14.6. Company 6 93
14.7. Company 7 93
14.8. Company 8 93
14.9. Company 9 93
14.10. Company 10 93
14.11. Company 11 93
14.12. Company 12 93
14.13. Company 13 93
14.14. Company 14 93
List of Figures
FIG NO. 1. Florida Dark Fiber Market, Volume (Kilometers) & Revenue (USD Million) 2018 – 2032 23
FIG NO. 2. Porter’s Five Forces Analysis for Florida Dark Fiber Market 29
FIG NO. 3. Value Chain Analysis for Florida Dark Fiber Market 30
FIG NO. 4. Florida Dark Fiber Market Installed capacity, By Florida, 2018 – 2023 32
FIG NO. 5. Florida Dark Fiber Market Price, By Fiber Type, 2018 – 2023 33
FIG NO. 6. Company Share Analysis, 2023 34
FIG NO. 7. Company Share Analysis, 2023 35
FIG NO. 8. Company Share Analysis, 2023 35
FIG NO. 9. Company Share Analysis, 2023 36
FIG NO. 10. Dark Fiber Market – Company Volume Market Share, 2023 37
FIG NO. 11. Dark Fiber Market – Company Revenue Market Share, 2023 38
FIG NO. 12. Dark Fiber Market Revenue Share, By Fiber Type, 2023 & 2032 44
FIG NO. 13. Market Attractiveness Analysis, By Fiber Type 45
FIG NO. 14. Incremental Revenue Growth Opportunity by Fiber Type, 2024 – 2032 45
FIG NO. 15. Dark Fiber Market Revenue, By Fiber Type, 2018, 2023, 2027 & 2032 46
FIG NO. 16. Florida Dark Fiber Market for Plastic, Volume (Kilometers) & Revenue (USD Million) 2018 – 2032 47
FIG NO. 17. Florida Dark Fiber Market for Glass, Volume (Kilometers) & Revenue (USD Million) 2018 – 2032 48
FIG NO. 18. Florida Dark Fiber Market for Others, Volume (Kilometers) & Revenue (USD Million) 2018 – 2032 49
FIG NO. 19. Dark Fiber Market Revenue Share, By Technology, 2023 & 2032 51
FIG NO. 20. Market Attractiveness Analysis, By Technology 52
FIG NO. 21. Incremental Revenue Growth Opportunity by Technology, 2024 – 2032 52
FIG NO. 22. Dark Fiber Market Revenue, By Technology, 2018, 2023, 2027 & 2032 53
FIG NO. 23. Florida Dark Fiber Market for DWDM (Dense Wavelength Division Multiplexing), Volume (Kilometers) & Revenue (USD Million) 2018 – 2032 54
FIG NO. 24. Florida Dark Fiber Market for CWDM (Coarse Wavelength Division Multiplexing), Volume (Kilometers) & Revenue (USD Million) 2018 – 2032 55
FIG NO. 25. Florida Dark Fiber Market for Others, Volume (Kilometers) & Revenue (USD Million) 2018 – 2032 56
FIG NO. 26. Dark Fiber Market Revenue Share, By Service, 2023 & 2032 58
FIG NO. 27. Market Attractiveness Analysis, By Service 59
FIG NO. 28. Incremental Revenue Growth Opportunity by Service, 2024 – 2032 59
FIG NO. 29. Dark Fiber Market Revenue, By Service, 2018, 2023, 2027 & 2032 60
FIG NO. 30. Florida Dark Fiber Market for Single-mode, Volume (Kilometers) & Revenue (USD Million) 2018 – 2032 61
FIG NO. 31. Florida Dark Fiber Market for Multimode, Volume (Kilometers) & Revenue (USD Million) 2018 – 2032 62
FIG NO. 32. Florida Dark Fiber Market for Mobile Backhaul, Volume (Kilometers) & Revenue (USD Million) 2018 – 2032 63
FIG NO. 33. Dark Fiber Market Revenue Share, By Pricing Model, 2023 & 2032 65
FIG NO. 34. Market Attractiveness Analysis, By Pricing Model 66
FIG NO. 35. Incremental Revenue Growth Opportunity by Pricing Model, 2024 – 2032 66
FIG NO. 36. Dark Fiber Market Revenue, By Pricing Model, 2018, 2023, 2027 & 2032 67
FIG NO. 37. Florida Dark Fiber Market for Price per strand-mile, Volume (Kilometers) & Revenue (USD Million) 2018 – 2032 68
FIG NO. 38. Florida Dark Fiber Market for Price per route-mile, Volume (Kilometers) & Revenue (USD Million) 2018 – 2032 69
FIG NO. 39. Florida Dark Fiber Market for Price per fiber-pair, Volume (Kilometers) & Revenue (USD Million) 2018 – 2032 70
FIG NO. 40. Florida Dark Fiber Market for Monthly Recurring Charge (MRC) vs Non-Recurring Charge (NRC), Volume (Kilometers) & Revenue (USD Million) 2018 – 2032 71
FIG NO. 41. Dark Fiber Market Revenue Share, By Customer Type, 2023 & 2032 73
FIG NO. 42. Market Attractiveness Analysis, By Customer Type 74
FIG NO. 43. Incremental Revenue Growth Opportunity by Customer Type, 2024 – 2032 74
FIG NO. 44. Dark Fiber Market Revenue, By Customer Type, 2018, 2023, 2027 & 2032 75
FIG NO. 45. Florida Dark Fiber Market for Telecom carriers / backbone providers, Volume (Kilometers) & Revenue (USD Million) 2018 – 2032 76
FIG NO. 46. Florida Dark Fiber Market for Data centers, Volume (Kilometers) & Revenue (USD Million) 2018 – 2032 77
FIG NO. 47. Florida Dark Fiber Market for Enterprise / corporate private networks, Volume (Kilometers) & Revenue (USD Million) 2018 – 2032 78
FIG NO. 48. Florida Dark Fiber Market for Municipal / utility networks, Volume (Kilometers) & Revenue (USD Million) 2018 – 2032 79
FIG NO. 49. Florida Dark Fiber Market for Healthcare / education / government networks, Volume (Kilometers) & Revenue (USD Million) 2018 – 2032 80
FIG NO. 50. Florida Dark Fiber Market for 5G backhaul / mobile operators, Volume (Kilometers) & Revenue (USD Million) 2018 – 2032 81
FIG NO. 51. Dark Fiber Market Revenue Share, By Route, 2023 & 2032 83
FIG NO. 52. Market Attractiveness Analysis, By Route 84
FIG NO. 53. Incremental Revenue Growth Opportunity by Route, 2024 – 2032 84
FIG NO. 54. Dark Fiber Market Revenue, By Route, 2018, 2023, 2027 & 2032 85
FIG NO. 55. Florida Dark Fiber Market for Naples – Miami, Volume (Kilometers) & Revenue (USD Million) 2018 – 2032 86
FIG NO. 56. Florida Dark Fiber Market for Naples – Tampa, Volume (Kilometers) & Revenue (USD Million) 2018 – 2032 87
FIG NO. 57. Florida Dark Fiber Market for Tampa – Jacksonville, Volume (Kilometers) & Revenue (USD Million) 2018 – 2032 88
FIG NO. 58. Florida Dark Fiber Market for Miami – Jacksonville, Volume (Kilometers) & Revenue (USD Million) 2018 – 2032 89
FIG NO. 59. Florida Dark Fiber Market for Other major Florida corridors, Volume (Kilometers) & Revenue (USD Million) 2018 – 2032 90
List of Tables
TABLE NO. 1. : Florida Dark Fiber Market: Snapshot 21
TABLE NO. 2. : Drivers for the Dark Fiber Market: Impact Analysis 25
TABLE NO. 3. : Restraints for the Dark Fiber Market: Impact Analysis 27
TABLE NO. 4. : Florida Dark Fiber Market Revenue, By Fiber Type, 2018 – 2023 33
 Market Drivers:
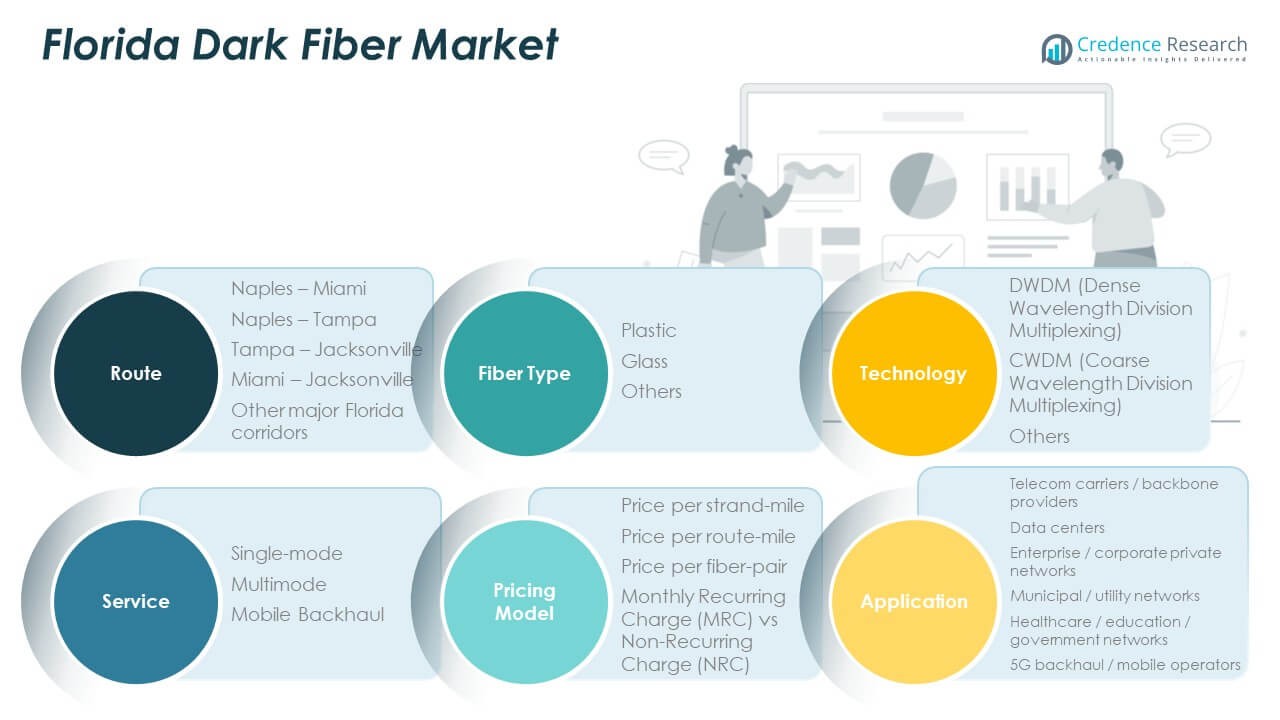 Market Trends:
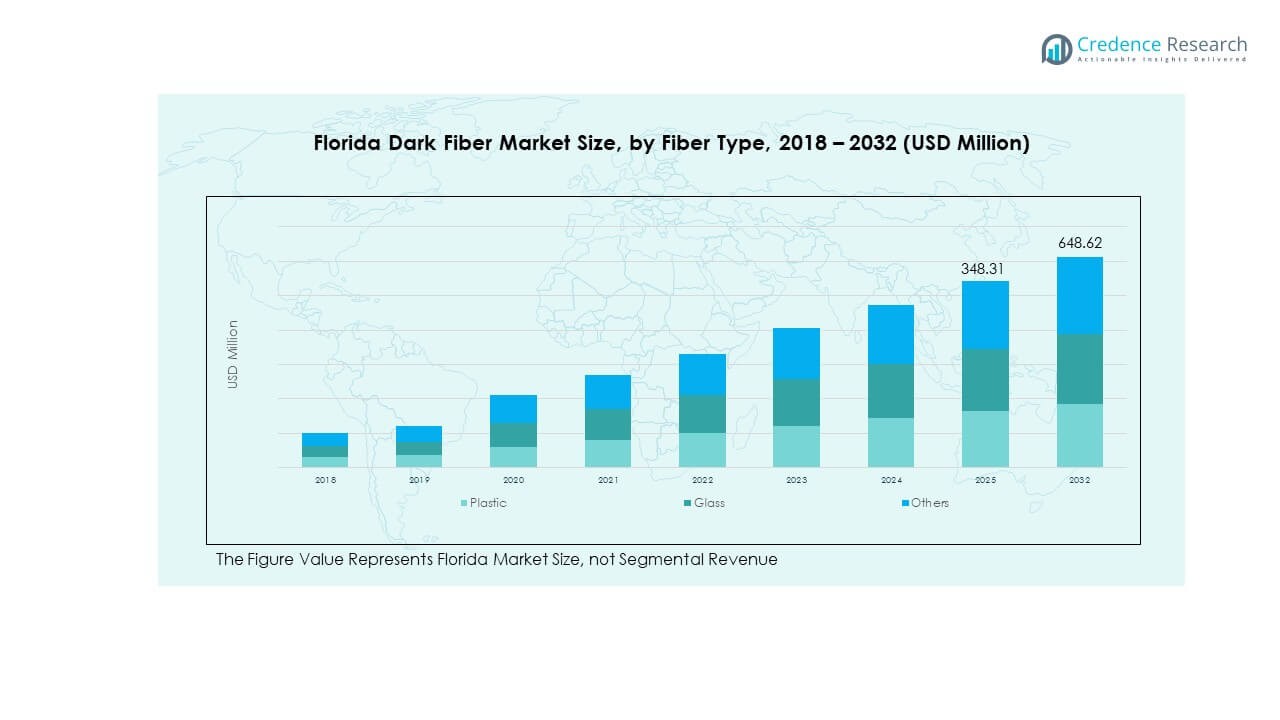 Regional Analysis:

