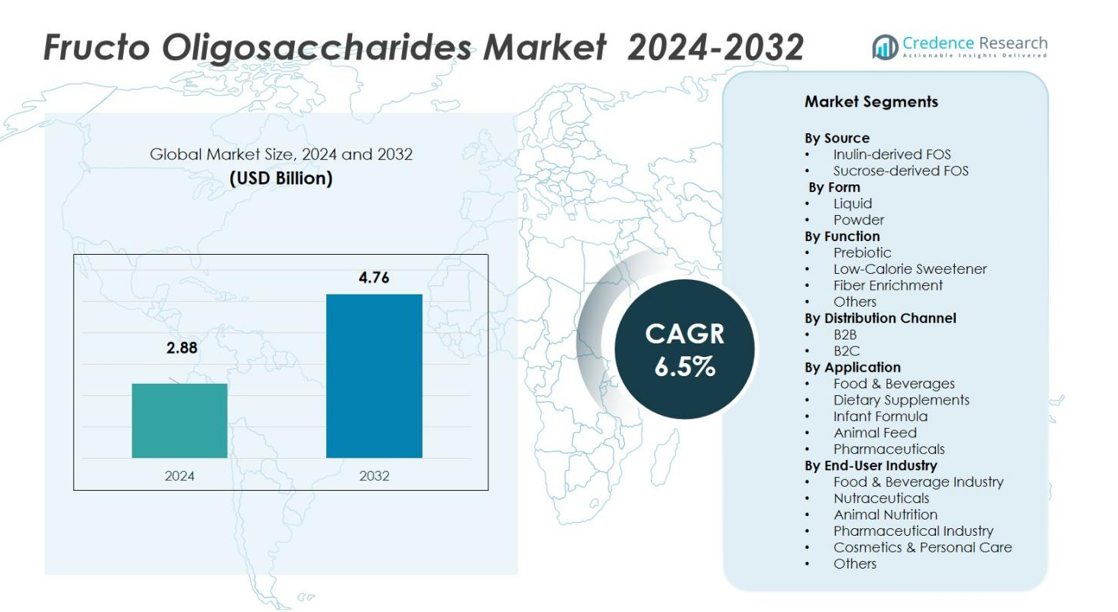
Home » Food & Beverage » Fructooligosaccharides (FOS) Market

Fructooligosaccharides (FOS) Market By Form (Liquid FOS, Powder FOS); By Source (Inulin-Based FOS, Sucrose-Based FOS); By Application (Food and Beverages, Animal Feed, Pharmaceuticals); By End-Use Industry (Food and Beverage Industry, Dietary Supplements, Animal Nutrition, Pharmaceutical Industry); By Functionality (Sweetening Agent, Prebiotic, Bulking Agent, Texturizer); By Product Type (High Purity FOS, Blended FOS Products); By Region – Growth, Share, Opportunities & Competitive Analysis, 2024 – 2032

Price: $4999

Published: | Report ID: 5708 | Report Format : PDF
REPORT ATTRIBUTE DETAILS
Historical Period  2019-2022
Base Year  2023
Forecast Period  2024-2032
Fructooligosaccharides (FOS) Market Size 2023  USD 2815.2 Million
Fructooligosaccharides (FOS) Market, CAGR  11.50%
Fructooligosaccharides (FOS) Market Size 2032  USD 7498.6 Million

Market Insights

  • The global demand for Fructooligosaccharides (FOS) was valued at USD 2815.2 Million in 2023 and is expected to reach USD 7498.6 Million in 2032, growing at a CAGR of 11.50% between 2024 and 2032.
  • In 2023, liquid form dominated the market, accounting for 54.2% of revenue.
  • The sucrose-based FOS segment is likely to account for the biggest revenue share over the projection period, while the inulin-based FOS segment is forecasted to rise significantly.
  • The Food and Beverage category is expected to develop at the quickest pace of 11.0% during the forecast period, while Animal Feed is another fast-growing section of the Fructooligosaccharides (FOS) Market.
  • Dietary Supplements is the fastest growing segment, while Animal Nutrition is another significant market holder.
  • Sweetening Agents are the most prevalent category, while Prebiotics are another key portion of the FOS Market.
  • The blended fructooligosaccharides (FOS) products are the most significant category of the FOS market.
  • During the projected period, Europe is expected to account for 42.1% of total revenue, and the North American market is expected to maintain a steady CAR.
  • The health benefits of FOS are one of the key drivers of market expansion.
  • The high cost of producing FOS is one of the primary obstacles to industry growth.

Fructooligosaccharides (FOS) Market

Design Element 2

Access crucial information at unmatched prices!

Request your free sample report today & start making informed decisions powered by Credence Research!

Download Free Sample
CTA Design Element 3

Executive Summary

Market Definition

Fructooligosaccharides (FOS) are a type of natural sweetener and prebiotic fiber. They are made up of a chain of fructose molecules and have a slightly sweet taste. FOS are commonly found in fruits and vegetables such as bananas, onions, and garlic. In the market, FOS is used as a food ingredient and dietary supplement. It is known for its potential health benefits, including promoting digestive health and supporting the growth of beneficial gut bacteria. The FOS market refers to the industry that produces and sells fructooligosaccharides for various applications.

Market Overview

The global Fructooligosaccharides (FOS) Market has witnessed steady growth in recent years and is expected to grow at a CAGR of 11.50% between 2024 and 2032. The market was valued at USD 2815.2 million in 2023 and is expected to reach USD 7498.6 million in 2032.

The Fructooligosaccharides (FOS) market is experiencing significant growth due to the increasing demand for natural sweeteners and dietary fiber. FOS is widely used as a food ingredient and dietary supplement thanks to its potential health benefits and prebiotic properties. The market is driven by factors such as rising consumer awareness about health and wellness, growing interest in digestive health, and the shift towards natural and clean-label ingredients. Manufacturers and suppliers are actively catering to this demand by offering a wide range of FOS products for various applications in the food and beverage industry.

Segmentation by Form

  • In 2023, liquid form led the market, accounting for 54.2% of revenues. Liquid fructooligosaccharides (FOS) are widely used because they may be easily included in a variety of food and beverage products. Their syrupy nature makes them easily dissolvable in water and other liquids, resulting in a homogenous slurry.
  • Powder fructooligosaccharides (FOS) are a type of FOS obtained from natural sources such as chicory root, Jerusalem artichoke, and agave. The powder version is made by extracting FOS from these sources, purifying and concentrating it, and then drying the liquid to a fine powder.

Segmentation by Source

  • The sucrose-Based FOS segment is expected to account for the largest revenue share during the forecast period due to the easy availability of raw materials, which aids in lowering manufacturing costs and increasing production of sucrose FOS, resulting in a high preference for this source of FOS among its manufacturers, driving market revenue growth.
  • The inulin-based FOS segment is predicted to grow rapidly during the forecast period due to its widespread use in the dairy and food and beverage industries, feed, nutritional supplements, and other applications.

Segmentation by Application

  • The Food & Beverage segment is estimated to grow at the fastest rate of 11.0% during the forecast period, accounting for 18.9% of the market in 2032. The Food & Beverages segment’s growth rate can be attributed to the continuous expansion of the food & beverage industry, increasing demand for functional food & beverages, and raising awareness about the benefits of incorporating FOS in various food products, such as its ability to enhance metabolic activity and act as a probiotic, resulting in growing demand for FOS in Food & Beverages, contributing to the segment’s growth rate.
  • On the other hand, Animal Feed are another fast-growing area of the Fructooligosaccharides (FOS) Market.

Segmentation by End-Use Industry

  • Dietary Supplements is the most rapidly developing segment. FOS is a typical prebiotic component in dietary supplements that promote intestinal health.
  • Animal Nutrition is another larger market holder in the FOS Market. FOS is added to animal feed to stimulate the growth of good gut bacteria and improve digestive health.

Segmentation by Functionality

  • Sweetening Agents are the most popular category in the Fructooligosaccharides (FOS) Market. FOS is utilized as a natural, low-calorie sweetener in a variety of food and beverage items.
  • Prebiotics are another major section of the FOS Market. FOS serves as a prebiotic, supporting the gut’s beneficial microorganisms and improving digestive health.

Segmentation by Product Type

  • Blended fructooligosaccharides (FOS) Products are the most prominent segment of the FOS Market. Blended FOS products are formulations that incorporate FOS with additional substances to provide specific functional or nutritional benefits.

Segmentation by Region

  • During the forecast period, Europe is expected to account for 42.1% of total revenue.
  • The North American market is expected to have a consistent CAR during the forecast period.
  • The rest of the world, including Latin America, the Middle East, and Africa, supplies the remaining demand for Fructooligosaccharides (FOS).

During the projection period, the European market is expected to have the most revenue share. This is primarily due to the high prevalence of obesity, an increase in the number of diabetic patients, and the presence of a large number of infant formula makers in Europe, all of which are driving market expansion. For example, the IDF predicts that diabetes prevalence (9.2%) and the number of diabetics (61 million) in Europe will increase by 13% by the end of 2032.

The North American market is predicted to maintain a consistent CAR over the forecast period, owing to newer developments and quality goods made in the industry by leading market players. For instance, NUTRAFLORA’s soluble prebiotic fiber, one of the most effective prebiotic fibers as well as the purest type of short-chain Fructooligosaccharide (scFOS) on the market, aids in the growth of beneficial bacteria in the large intestine and has been scientifically proven to improve digestive health, driving market revenue growth.

Moreover, the Asia Pacific market is predicted to increase at a rapid pace during the forecast period, owing to the increasing use of FOS in baby formulations. For example, China’s removal of the one-child ban is boosting the manufacturing of infant formula.

According to experts who spoke at the Growth Asia Series 2021, infant formula producers are looking into novel functional components, including Human Milk Oligosaccharides (HMOs), additional milk bases like sheep milk and goat milk, and developing organic claims.

Key Highlights of the Report

Form, Source, Additives, Application, End-Use Industry, Functionality, Product Type, and Region Segment of the Global Fructooligosaccharides (FOS) Market. In 2023, liquid form dominated the market, accounting for 54.2% of revenues, with Sweetening Agents being the most popular category. Furthermore, the most important section is blended fructooligosaccharides (FOS) products, with Animal Nutrition holding a substantial market share in the FOS industry, with Europe leading the market growth.

The market is being driven by rising consumer demand for natural and healthier food components, growing awareness of the benefits of FOS in supporting digestive health, and rising acceptance of FOS as a prebiotic ingredient in various food and beverage products. Furthermore, the primary limitations of the market are high production costs associated with FOS extraction and processing, limited consumer knowledge and availability of FOS products in certain countries, and severe laws and labeling requirements for FOS in some markets.

During the projected period, the European market is expected to account for the largest revenue share. The North American market is expected to have a steady CAR during the projected period. Additionally, the Asia Pacific market is expected to grow rapidly during the forecast period.

What Are The Main Drivers Of The Global Fructooligosaccharides (FOS) Market?

One of the key drivers in the FOS market is the increasing consumer demand for natural and healthier food ingredients. People are becoming more conscious about their dietary choices and are actively seeking out products that are made with natural sweeteners and dietary fiber. Another driver is the growing awareness about the benefits of FOS in promoting digestive health. As more research highlights the positive impact of FOS on gut health and overall well-being, consumers are incorporating FOS-rich foods and supplements into their diets.

What Are The Major Challenges Faced By The Global Fructooligosaccharides (FOS) Market?

While the FOS market is growing, it does face certain restraints. One of these is the high production costs associated with FOS extraction and processing. The complex nature of the production process, as well as the need for specialized equipment and expertise, can contribute to higher costs. Another restraint is the limited consumer awareness and availability of FOS products in certain regions. While FOS is gaining popularity, it may still be relatively unknown to some consumers, and access to FOS products may be limited in certain markets.

What Are The Growth Opportunities In The Global Fructooligosaccharides (FOS) Market?

The FOS market also presents several opportunities for growth and innovation. One opportunity lies in the expanding applications of FOS in functional foods, dietary supplements, and pharmaceuticals. As the understanding of FOS benefits deepens, there is potential to develop new products and formulations that cater to specific health needs. Another opportunity is the increasing research and development activities focused on exploring new uses and benefits of FOS. Scientists and manufacturers are continuously studying the potential applications of FOS in areas such as weight management, immune health, and more.

Market Drivers

Several factors drive the global Fructooligosaccharides (FOS) Market. The following are the key drivers of the global Fructooligosaccharides (FOS) Market:

Health Benefits Of FOS

FOS are often short-chain fructans that are not digested by the human body. Beneficial bacteria in the colon help to ferment FOS and create short-chain fatty acids. The health of the stomach is closely linked to several body functions. Therefore, maintaining gut health is vital. Fructooligosaccharides aid to keep the gastrointestinal tract balanced and active. They serve an important function in maintaining the balance and diversity of intestinal bacteria while also raising the quantity of beneficial bacteria such as Lactobacillus and Bifidobacterium. Such health benefits will propel market growth over the predicted period.

Market Restraints

The global Fructooligosaccharides (FOS) Market faces some challenges that may hinder its growth. These include the following:

High Cost Of FOS Production

The majority of prebiotic oligosaccharides are produced via enzymatic treatment of low-cost source materials such as lactose, sucrose, and plant derivatives. The enzyme source, reaction circumstances, and substrate concentration determine the amount and composition of oligosaccharides generated. Production expenses are increased due to the current process’s low yield. As a result, firms are investing in R&D activities that can help boost yield and investigating more efficient manufacturing procedures. Such challenges are projected to hinder market expansion over the forecast period. This market study report also includes thorough information on key emerging trends and challenges that will have a significant impact on market growth. The practical insights on trends and challenges will assist businesses in evaluating and developing growth strategies for the years 2023-2032.

Opportunities

The global Fructooligosaccharides (FOS) Market offers significant growth opportunities. These include the following:

Exploring The Growth Potential Of FOS In Sports Nutrition Industry

One important opportunity in the FOS market is in the sports nutrition sector. With a growing emphasis on health and fitness, more athletes and fitness enthusiasts are turning to sports nutrition supplements to improve their performance and recovery. FOS, with its prebiotic qualities and ability to promote gut health, has the potential to transform this market. FOS can be incorporated into sports nutrition products such as protein bars, smoothies, and supplements to provide athletes with a winning combination of nutrition and digestive support. FOS promotes healthy gut flora, which is essential for overall health and effective nutrient absorption.

Competitive Landscape

Shape Your Report to Specific Countries or Regions & Enjoy 30% Off!

Key Players

The global Fructooligosaccharides (FOS) Market is highly competitive, with several key players. Some of the major players in the market and their market share are as follows:

  • Beneo
  • Biosynth
  • Cargill Incorporated
  • Galam
  • Ingredion
  • Meiji Holdings Co., Ltd.
  • Tata Chemicals Ltd.
  • Tereos Group
  • Südzucker AG (BENEO)
  • Baolingbao Biological Co., Ltd.

These organizations prioritize product innovation, Purity expansion, and mergers and acquisitions to stay competitive.

The global Fructooligosaccharides (FOS) Market’s key players continually seek to stay ahead by offering new products and developments.

In January 2022, Galam, a global maker of specialty ingredients for the food and animal nutrition industries, announced plans to establish a production facility for its prebiotic GOFOS. It is a short-chain fructooligosaccharide (sc-FOS) group of potent prebiotics, with scientific evidence indicating that daily ingestion can result in a variety of health advantages in humans and animals. Galam produces GOFOS, a soluble sc-FOS prebiotic fiber. It promotes the development and maintenance of healthy gut microorganisms.

In March 2022, Tate & Lyle PLC (Tate & Lyle), a leading global provider of food and beverage ingredients and solutions, announced the signing of an agreement to acquire Quantum Hi-Tech Biological Co. Ltd (Quantum), engaged in the research, development, production, and sale of fructooligosaccharides (FOS) and galactooligosaccharides (GOS), and a leading prebiotic dietary fiber business in China, from ChemPartner Pharmatech Co. Ltd (ChemPartner) for a total consideration of USD 237 millions

Summary of Key Findings

  • Exploring the Growth Potential of FOS in the Sports Nutrition Industry.
  • Form, Source, Additives, Application, End-Use Industry, Functionality, Product Type, and region segment of the market.
  • Dietary Supplements is the most quickly developing segment
  • The Food and Beverage segment is expected to develop at the quickest pace of 11.0% during the forecast period
  • Europe is leading market growth; the market is highly competitive with key players Beneo, Biosynth, Cargill, Incorporated, Galam, Ingredion, Meiji Holdings Co., Ltd and Others.

Future Outlook

  • Increasing demand for natural sweeteners and dietary fiber
  • Growing consumer awareness about health and wellness
  • Rising interest in digestive health
  • Shift towards natural and clean-label ingredients
  • Expanding product offerings by manufacturers and suppliers
  • Potential for further market growth

How CXOs Can Benefit from the Credence Research Fructooligosaccharides (FOS) Market Report

The Credence Research Fructooligosaccharides (FOS) Market Report provides CXOs with a comprehensive overview of the market, including:

  • Market size and growth forecast: The report provides detailed estimates of the global Fructooligosaccharides (FOS) Market size, segmented by Form, Source, Additives, Application, End-Use Industry, Functionality, Product Type, and Region. It also includes forecasts for the market through 2032 based on key trends and drivers.
  • Market segmentation: The report segments the Fructooligosaccharides (FOS) Market by Form, Source, Additives, Application, End-Use Industry, Functionality, Product Type, and Region. This segmentation provides CXOs with a granular understanding of the market and the opportunities in each segment.
  • Competitive Landscape: The report profiles the key players in the Fructooligosaccharides (FOS) Market and provides insights into their strategies, product offerings, and financial performance. This information can help CXOs identify and assess their competition.
  • Key trends and drivers: The report identifies and analyzes the key trends and drivers shaping the Fructooligosaccharides (FOS) Market. This information can help CXOs make information decisions about their investments and strategies.

CXOs can use the insights from the Credence Research Fructooligosaccharides (FOS) Market Report to:

  • Identify growth opportunities: The report can help CXOs identify new growth opportunities in the Fructooligosaccharides (FOS) Market. For example, it can provide insights into emerging consumer trends and preferences, allowing CXOs to develop innovative Fructooligosaccharides (FOS)-based products that cater to the evolving demands of health-conscious individuals.
  • Make informed investment decisions: The report can help CXOs make informed investment decisions about Fructooligosaccharides (FOS). For example, it can provide valuable insights into market trends, growth potential, and competitive landscape, allowing CXOs to assess the viability of investing in the Fructooligosaccharides (FOS) industry.
  • Develop competitive strategies: The report can help CXOs to develop competitive strategies for their Fructooligosaccharides (FOS) businesses. For example, It can provide valuable insights into market trends, consumer preferences, and competitive landscape, allowing CXOs to identify unique selling propositions .and differentiate their products in the market.
  • Track market developments: The report can help CXOs monitor market developments and stay ahead of the curve. For example, it provides insights into the latest trends and innovations in the Fructooligosaccharides (FOS) Market.

Overall, the Credence Research Fructooligosaccharides (FOS) Market Report is a valuable resource for CXOs who are looking to gain a deeper understanding of the market and identify opportunities for growth.

Segmentation

By Form:

  • Liquid FOS
  • Powder FOS

By Source:

  • Inulin-Based FOS
  • Sucrose-Based FOS

By Application:

  • Food and Beverages
  • Animal Feed
  • Pharmaceuticals

By End-Use Industry:

  • Food and Beverage Industry
  • Dietary Supplements
  • Animal Nutrition
  • Pharmaceutical Industry

By Functionality:

  • Sweetening Agent
  • Prebiotic
  • Bulking Agent
  • Texturizer

By Product Type:

  • High Purity FOS
  • Blended FOS Products

By Region

  • North America
    • The U.S.
    • Canada
    • Mexico
  • Europe
    • Germany
    • France
    • The U.K.
    • Italy
    • Spain
    • Rest of Europe
  • Asia Pacific
    • China
    • Japan
    • India
    • South Korea
    • South-east Asia
    • Rest of Asia Pacific
  • Latin America
    • Brazil
    • Argentina
    • Rest of Latin America
  • Middle East & Africa
    • GCC Countries
    • South Africa
    • Rest of Middle East and Africa

Table of Content
1. Preface
1.1. Report Description
1.1.1. Purpose of the Report
1.1.2. Target Audience
1.1.3. USP and Key Offerings
1.2. Research Scope
1.3. Market Introduction
2. Executive Summary
2.1. Market Snapshot: Global Fructooligosaccharides (FOS) Market
2.1.1. Global Fructooligosaccharides (FOS) Market, By Form
2.1.2. Global Fructooligosaccharides (FOS) Market, By Source
2.1.3. Global Fructooligosaccharides (FOS) Market, By Application
2.1.4. Global Fructooligosaccharides (FOS) Market, By End-Use Industry
2.1.5. Global Fructooligosaccharides (FOS) Market, By Functionality
2.1.6. Global Fructooligosaccharides (FOS) Market, By Product Type
2.1.7. Global Fructooligosaccharides (FOS) Market, By Region
2.2. Insights from Primary Respondents
3. Market Dynamics & Factors Analysis
3.1. Introduction
3.1.1. Global Fructooligosaccharides (FOS) Market Value, 2019-2032, (US$ Mn)
3.1.2. Y-o-Y Growth Trend Analysis
3.2. Market Dynamics
3.2.1. Fructooligosaccharides (FOS) Market Drivers
3.2.2. Fructooligosaccharides (FOS) Market Restraints
3.2.3. Fructooligosaccharides (FOS) Market Opportunities
3.2.4. Major Fructooligosaccharides (FOS) Industry Challenges
3.3. Growth and Development Patterns
3.4. Investment Feasibility Analysis
3.5. Market Opportunity Analysis
3.5.1. Form
3.5.2. Source
3.5.3. Application
3.5.4. End-Use Industry
3.5.5. Functionality
3.5.6. Product Type
3.5.7. Geography
4. Market Competitive Landscape Analysis
4.1. Company Market Share Analysis, 2023
4.1.1. Global Fructooligosaccharides (FOS) Market: Company Market Share, Value 2023
4.1.2. Global Fructooligosaccharides (FOS) Market: Top 6 Company Market Share, Value 2023
4.1.3. Global Fructooligosaccharides (FOS) Market: Top 3 Company Market Share, Value 2023
4.2. Global Fructooligosaccharides (FOS) Market: Company Revenue Share Analysis, 2023
4.3. Company Assessment Metrics, 2023
4.3.1. Stars
4.3.2. Emerging Leaders
4.3.3. Pervasive Players
4.3.4. Participants
4.4. Startups/ SMEs Assessment Metrics, 2023
4.4.1. Progressive Companies
4.4.2. Responsive Companies
4.4.3. Dynamic Companies
4.4.4. Starting Blocks
4.5. Strategic Development
4.5.1. Acquisition and Mergers
4.5.2. New Product Launch
4.5.3. Regional Expansion
4.5.4. Partnerships
4.6. Key Player Product Matrix
4.7. Potential for New Players in the Global Fructooligosaccharides (FOS) Market
5. Premium Insights
5.1. STAR (Situation, Task, Action, Results) Analysis
5.2. Porter’s Five Forces Analysis
5.2.1. Threat of New Entrants
5.2.2. Bargaining Power of Buyers/Consumers
5.2.3. Bargaining Power of Suppliers
5.2.4. Threat of Substitute Types
5.2.5. Intensity of Competitive Rivalry
5.3. PESTEL Analysis
5.3.1. Political Factors
5.3.2. Economic Factors
5.3.3. Social Factors
5.3.4. Technological Factors
5.3.5. Environmental Factors
5.3.6. Legal Factors
5.4. Key Market Trends
5.4.1. Demand Side Trends
5.4.2. Supply Side Trends
5.5. Value Chain Analysis
5.6. Technology Analysis
5.6.1. Research and development in the global market
5.6.2. Patent Analysis
5.6.3. Emerging technologies and their potential disruption to the market
5.7. Consumer Behaviour Analysis
5.7.1. Consumer Preferences and Expectations
5.7.2. Factors Influencing Consumer Buying Decisions
5.7.2.1. North America
5.7.2.2. Europe
5.7.2.3. Asia Pacific
5.7.2.4. Latin America
5.7.2.5. Middle East and Africa
5.7.3. Consumer Pain Points
5.8. Analysis and Recommendations
5.9. Adjacent Market Analysis
6. Market Positioning of Key Players, 2023
6.1. Company market share of key players, 2023
6.2. Competitive Benchmarking
6.3. Market Positioning of Key Vendors
6.4. Geographical Presence Analysis
6.5. Major Strategies Adopted by Key Players
6.5.1. Key Strategies Analysis
6.5.2. Mergers and Acquisitions
6.5.3. Partnerships
6.5.4. Product Launch
6.5.5. Geographical Expansion
6.5.6. Others
7. Impact Analysis of COVID 19 and Russia – Ukraine War on Fructooligosaccharides (FOS) Market
7.1. Ukraine-Russia War Impact
7.1.1. Uncertainty and Economic Instability
7.1.2. Supply chain disruptions
7.1.3. Regional market shifts
7.1.4. Shift in government priorities
7.2. COVID-19 Impact Analysis
7.2.1. Supply Chain Disruptions
7.2.2. Demand Fluctuations
7.2.3. Shift in Product Mix
7.2.4. Reduced Industrial Activity
7.2.5. Regional Impact Analysis
7.2.5.1. North America
7.2.5.2. Europe
7.2.5.3. Asia Pacific
7.2.5.4. Latin America
7.2.5.5. Middle East and Africa
8. Global Fructooligosaccharides (FOS) Market, By Form
8.1. Global Fructooligosaccharides (FOS) Market Overview, by Form
8.1.1. Global Fructooligosaccharides (FOS) Market Revenue Share, By Form, 2023 Vs 2032 (in %)
8.2. Liquid FOS
8.2.1. Global Fructooligosaccharides (FOS) Market, By LIQUID FOS, By Region, 2019-2032 (US$ Mn)
8.2.2. Market Dynamics for LIQUID FOS
8.2.2.1. Drivers
8.2.2.2. Restraints
8.2.2.3. Opportunities
8.2.2.4. Trends
8.3. Powder FOS
8.3.1. Global Fructooligosaccharides (FOS) Market, By Powder FOS, By Region, 2019-2032 (US$ Mn)
8.3.2. Market Dynamics for Powder FOS
8.3.2.1. Drivers
8.3.2.2. Restraints
8.3.2.3. Opportunities
8.3.2.4. Trends
9. Global Fructooligosaccharides (FOS) Market, By Sources
9.1. Global Fructooligosaccharides (FOS) Market Overview, by Sources
9.1.1. Global Fructooligosaccharides (FOS) Market Revenue Share, By Sources, 2023 Vs 2032 (in %)
9.2. Inulin-Based FOS
9.2.1. Global Fructooligosaccharides (FOS) Market, By Inulin-Based FOS, By Region, 2019-2032 (US$ Mn)
9.2.2. Market Dynamics for Inulin-Based FOS
9.2.2.1. Drivers
9.2.2.2. Restraints
9.2.2.3. Opportunities
9.2.2.4. Trends
9.3. Sucrose-Based FOS
9.3.1. Global Fructooligosaccharides (FOS) Market, By Sucrose-Based FOS, By Region, 2019-2032 (US$ Mn)
9.3.2. Market Dynamics for Sucrose-Based FOS
9.3.2.1. Drivers
9.3.2.2. Restraints
9.3.2.3. Opportunities
9.3.2.4. Trends
10. Global Fructooligosaccharides (FOS) Market, By Application
10.1. Global Fructooligosaccharides (FOS) Market Overview, by Application
10.1.1. Global Fructooligosaccharides (FOS) Market Revenue Share, By Application, 2023 Vs 2032 (in %)
10.2. Food and Beverages
10.2.1. Global Fructooligosaccharides (FOS) Market, By Food and Beverages, By Region, 2019-2032 (US$ Mn)
10.2.2. Market Dynamics for Food and Beverages
10.2.2.1. Drivers
10.2.2.2. Restraints
10.2.2.3. Opportunities
10.2.2.4. Trends
10.3. Animal Feed
10.3.1. Global Fructooligosaccharides (FOS) Market, By Animal Feed, By Region, 2019-2032 (US$ Mn)
10.3.2. Market Dynamics for Animal Feed
10.3.2.1. Drivers
10.3.2.2. Restraints
10.3.2.3. Opportunities
10.3.2.4. Trends
10.4. Pharmaceuticals
10.4.1. Global Fructooligosaccharides (FOS) Market, By Pharmaceuticals, By Region, 2019-2032 (US$ Mn)
10.4.2. Market Dynamics for Pharmaceuticals
10.4.2.1. Drivers
10.4.2.2. Restraints
10.4.2.3. Opportunities
10.4.2.4. Trends
11. Global Fructooligosaccharides (FOS) Market, By End-Use Industry
11.1. Global Fructooligosaccharides (FOS) Market Overview, By End-Use Industry
11.1.1. Global Fructooligosaccharides (FOS) Market Revenue Share, By End-Use Industry, 2023 Vs 2032 (in %)
11.2. Food and Beverage Industry
11.2.1. Global Fructooligosaccharides (FOS) Market, By Food and Beverage Industry, By Region, 2019-2032 (US$ Mn)
11.2.2. Market Dynamics for Food and Beverage Industry
11.2.2.1. Drivers
11.2.2.2. Restraints
11.2.2.3. Opportunities
11.2.2.4. Trends
11.3. Dietary Supplements
11.3.1. Global Fructooligosaccharides (FOS) Market, By Dietary Supplements, By Region, 2019-2032 (US$ Mn)
11.3.2. Market Dynamics for Dietary Supplements
11.3.2.1. Drivers
11.3.2.2. Restraints
11.3.2.3. Opportunities
11.3.2.4. Trends
11.4. Animal Nutrition
11.4.1. Global Fructooligosaccharides (FOS) Market, By Animal Nutrition, By Region, 2019-2032 (US$ Mn)
11.4.2. Market Dynamics for Animal Nutrition
11.4.2.1. Drivers
11.4.2.2. Restraints
11.4.2.3. Opportunities
11.4.2.4. Trends
11.5. Pharmaceutical Industry
11.5.1. Global Fructooligosaccharides (FOS) Market, By Pharmaceutical Industry, By Region, 2019-2032 (US$ Mn)
11.5.2. Market Dynamics for Pharmaceutical Industry
11.5.2.1. Drivers
11.5.2.2. Restraints
11.5.2.3. Opportunities
11.5.2.4. Trends
12. Global Fructooligosaccharides (FOS) Market, By Functionality
12.1. Global Fructooligosaccharides (FOS) Market Overview, by Functionality
12.1.1. Global Fructooligosaccharides (FOS) Market Revenue Share, By Functionality, 2023 Vs 2032 (in %)
12.2. Sweetening Agent
12.2.1. Global Fructooligosaccharides (FOS) Market, By Sweetening Agent, By Region, 2019-2032 (US$ Mn)
12.2.2. Market Dynamics for Sweetening Agent
12.2.2.1. Drivers
12.2.2.2. Restraints
12.2.2.3. Opportunities
12.2.2.4. Trends
12.3. Prebiotic
12.3.1. Global Fructooligosaccharides (FOS) Market, By Prebiotic, By Region, 2019-2032 (US$ Mn)
12.3.2. Market Dynamics for Prebiotic
12.3.2.1. Drivers
12.3.2.2. Restraints
12.3.2.3. Opportunities
12.3.2.4. Trends
12.4. Bulking Agent
12.4.1. Global Fructooligosaccharides (FOS) Market, By Bulking Agent, By Region, 2019-2032 (US$ Mn)
12.4.2. Market Dynamics for Bulking Agent
12.4.2.1. Drivers
12.4.2.2. Restraints
12.4.2.3. Opportunities
12.4.2.4. Trends
12.5. Texturizer
12.5.1. Global Fructooligosaccharides (FOS) Market, By Texturizer, By Region, 2019-2032 (US$ Mn)
12.5.2. Market Dynamics for Texturizer
12.5.2.1. Drivers
12.5.2.2. Restraints
12.5.2.3. Opportunities
12.5.2.4. Trends
13. Global Fructooligosaccharides (FOS) Market, By Product Type
13.1. Global Fructooligosaccharides (FOS) Market Overview, by Product Type
13.1.1. Global Fructooligosaccharides (FOS) Market Revenue Share, By Product Type, 2023 Vs 2032 (in %)
13.2. High Purity FOS
13.2.1. Global Fructooligosaccharides (FOS) Market, By High Purity FOS, By Region, 2019-2032 (US$ Mn)
13.2.2. Market Dynamics for High Purity FOS
13.2.2.1. Drivers
13.2.2.2. Restraints
13.2.2.3. Opportunities
13.2.2.4. Trends
13.3. Blended FOS Products
13.3.1. Global Fructooligosaccharides (FOS) Market, By Blended FOS Products, By Region, 2019-2032 (US$ Mn)
13.3.2. Market Dynamics for Blended FOS Products
13.3.2.1. Drivers
13.3.2.2. Restraints
13.3.2.3. Opportunities
13.3.2.4. Trends
14. Global Fructooligosaccharides (FOS) Market, By Region
14.1. Global Fructooligosaccharides (FOS) Market Overview, by Region
14.1.1. Global Fructooligosaccharides (FOS) Market, By Region, 2023 vs 2032 (in%)
14.2. Form
14.2.1. Global Fructooligosaccharides (FOS) Market, By Form, 2019-2032 (US$ Mn)
14.3. Source
14.3.1. Global Fructooligosaccharides (FOS) Market, By Source, 2019-2032 (US$ Mn)
14.4. Application
14.4.1. Global Fructooligosaccharides (FOS) Market, By Application, 2019-2032 (US$ Mn)
14.5. Grade
14.5.1. Global Fructooligosaccharides (FOS) Market, By End-Use Industry, 2019-2032 (US$ Mn)
14.6. Functionality
14.6.1. Global Fructooligosaccharides (FOS) Market, By Functionality, 2019-2032 (US$ Mn)
14.7. Product Type
14.7.1. Global Fructooligosaccharides (FOS) Market, By Product Type, 2019-2032 (US$ Mn)
15. North America Fructooligosaccharides (FOS) Market Analysis
15.1. Overview
15.1.1. Market Dynamics for North America
15.1.1.1. Drivers
15.1.1.2. Restraints
15.1.1.3. Opportunities
15.1.1.4. Trends
15.2. North America Fructooligosaccharides (FOS) Market, by Form, 2019-2032(US$ Mn)
15.2.1. Overview
15.2.2. SRC Analysis
15.3. North America Fructooligosaccharides (FOS) Market, by Source, 2019-2032(US$ Mn)
15.3.1. Overview
15.3.2. SRC Analysis
15.4. North America Fructooligosaccharides (FOS) Market, by Application, 2019-2032(US$ Mn)
15.4.1. Overview
15.4.2. SRC Analysis
15.5. North America Fructooligosaccharides (FOS) Market, By End-Use Industry, 2019-2032(US$ Mn)
15.5.1. Overview
15.5.2. SRC Analysis
15.6. North America Fructooligosaccharides (FOS) Market, by Functionality, 2019-2032(US$ Mn)
15.6.1. Overview
15.6.2. SRC Analysis
15.7. North America Fructooligosaccharides (FOS) Market, by Product Type, 2019-2032(US$ Mn)
15.7.1. Overview
15.7.2. SRC Analysis
15.8. North America Fructooligosaccharides (FOS) Market, by Country, 2019-2032 (US$ Mn)
15.8.1. North America Fructooligosaccharides (FOS) Market, by Country, 2023 Vs 2032 (in%)
15.8.2. U.S.
15.8.3. Canada
15.8.4. Mexico
16. Europe Fructooligosaccharides (FOS) Market Analysis
16.1. Overview
16.1.1. Market Dynamics for North America
16.1.1.1. Drivers
16.1.1.2. Restraints
16.1.1.3. Opportunities
16.1.1.4. Trends
16.2. Europe Fructooligosaccharides (FOS) Market, by Form, 2019-2032(US$ Mn)
16.2.1. Overview
16.2.2. SRC Analysis
16.3. Europe Fructooligosaccharides (FOS) Market, by Source, 2019-2032(US$ Mn)
16.3.1. Overview
16.3.2. SRC Analysis
16.4. Europe Fructooligosaccharides (FOS) Market, by Application, 2019-2032(US$ Mn)
16.4.1. Overview
16.4.2. SRC Analysis
16.5. Europe Fructooligosaccharides (FOS) Market, By End-Use Industry, 2019-2032(US$ Mn)
16.5.1. Overview
16.5.2. SRC Analysis
16.6. Europe Fructooligosaccharides (FOS) Market, by Functionality, 2019-2032(US$ Mn)
16.6.1. Overview
16.6.2. SRC Analysis
16.7. Europe Fructooligosaccharides (FOS) Market, by Product Type, 2019-2032(US$ Mn)
16.7.1. Overview
16.7.2. SRC Analysis
16.8. Europe Fructooligosaccharides (FOS) Market, by Country, 2019-2032 (US$ Mn)
16.8.1. Europe Fructooligosaccharides (FOS) Market, by Country, 2023 Vs 2032 (in%)
16.8.2. UK
16.8.3. France
16.8.4. Germany
16.8.5. Italy
16.8.6. Spain
16.8.7. Benelux
16.8.8. Russia
16.8.9. Rest of Europe
17. Asia Pacific Fructooligosaccharides (FOS) Market Analysis
17.1. Overview
17.1.1. Market Dynamics for North America
17.1.1.1. Drivers
17.1.1.2. Restraints
17.1.1.3. Opportunities
17.1.1.4. Trends
17.2. Asia Pacific Fructooligosaccharides (FOS) Market, by Form, 2019-2032(US$ Mn)
17.2.1. Overview
17.2.2. SRC Analysis
17.3. Asia Pacific Fructooligosaccharides (FOS) Market, by Source, 2019-2032(US$ Mn)
17.3.1. Overview
17.3.2. SRC Analysis
17.4. Asia Pacific Fructooligosaccharides (FOS) Market, by Application, 2019-2032(US$ Mn)
17.4.1. Overview
17.4.2. SRC Analysis
17.5. Asia Pacific Fructooligosaccharides (FOS) Market, By End-Use Industry, 2019-2032(US$ Mn)
17.5.1. Overview
17.5.2. SRC Analysis
17.6. Asia Pacific Fructooligosaccharides (FOS) Market, by Functionality, 2019-2032(US$ Mn)
17.6.1. Overview
17.6.2. SRC Analysis
17.7. Asia Pacific Fructooligosaccharides (FOS) Market, by Product Type, 2019-2032(US$ Mn)
17.7.1. Overview
17.7.2. SRC Analysis
17.8. Asia Pacific Fructooligosaccharides (FOS) Market, by Country, 2019-2032 (US$ Mn)
17.8.1. Asia Pacific Fructooligosaccharides (FOS) Market, by Country, 2023 Vs 2032 (in%)
17.8.2. China
17.8.3. Japan
17.8.4. India
17.8.5. South Korea
17.8.6. South East Asia
17.8.7. Rest of Asia Pacific
18. Latin America Fructooligosaccharides (FOS) Market Analysis
18.1. Overview
18.1.1. Market Dynamics for North America
18.1.1.1. Drivers
18.1.1.2. Restraints
18.1.1.3. Opportunities
18.1.1.4. Trends
18.2. Latin America Fructooligosaccharides (FOS) Market, by Form, 2019-2032(US$ Mn)
18.2.1. Overview
18.2.2. SRC Analysis
18.3. Latin America Fructooligosaccharides (FOS) Market, by Source, 2019-2032(US$ Mn)
18.3.1. Overview
18.3.2. SRC Analysis
18.4. Latin America Fructooligosaccharides (FOS) Market, by Application, 2019-2032(US$ Mn)
18.4.1. Overview
18.4.2. SRC Analysis
18.5. Latin America Fructooligosaccharides (FOS) Market, By End-Use Industry, 2019-2032(US$ Mn)
18.5.1. Overview
18.5.2. SRC Analysis
18.6. Latin America Fructooligosaccharides (FOS) Market, by Functionality, 2019-2032(US$ Mn)
18.6.1. Overview
18.6.2. SRC Analysis
18.7. Latin America Fructooligosaccharides (FOS) Market, by Product Type, 2019-2032(US$ Mn)
18.7.1. Overview
18.7.2. SRC Analysis
18.8. Latin America Fructooligosaccharides (FOS) Market, by Country, 2019-2032 (US$ Mn)
18.8.1. Latin America Fructooligosaccharides (FOS) Market, by Country, 2023 Vs 2032 (in%)
18.8.2. Brazil
18.8.3. Argentina
18.8.4. Rest of Latin America
19. Middle East Fructooligosaccharides (FOS) Market Analysis
19.1. Overview
19.1.1. Market Dynamics for North America
19.1.1.1. Drivers
19.1.1.2. Restraints
19.1.1.3. Opportunities
19.1.1.4. Trends
19.2. Middle East Fructooligosaccharides (FOS) Market, by Form, 2019-2032(US$ Mn)
19.2.1. Overview
19.2.2. SRC Analysis
19.3. Middle East Fructooligosaccharides (FOS) Market, by Source, 2019-2032(US$ Mn)
19.3.1. Overview
19.3.2. SRC Analysis
19.4. Middle East Fructooligosaccharides (FOS) Market, by Application, 2019-2032(US$ Mn)
19.4.1. Overview
19.4.2. SRC Analysis
19.5. Middle East Fructooligosaccharides (FOS) Market, By End-Use Industry, 2019-2032(US$ Mn)
19.5.1. Overview
19.5.2. SRC Analysis
19.6. Middle East Fructooligosaccharides (FOS) Market, by Functionality, 2019-2032(US$ Mn)
19.6.1. Overview
19.6.2. SRC Analysis
19.7. Middle East Fructooligosaccharides (FOS) Market, by Product Type, 2019-2032(US$ Mn)
19.7.1. Overview
19.7.2. SRC Analysis
19.8. Middle East Fructooligosaccharides (FOS) Market, by Country, 2019-2032 (US$ Mn)
19.8.1. Middle East Fructooligosaccharides (FOS) Market, by Country, 2023 Vs 2032 (in%)
19.8.2. UAE
19.8.3. Saudi Arabia
19.8.4. Rest of Middle East
20. Africa Fructooligosaccharides (FOS) Market Analysis
20.1. Overview
20.1.1. Market Dynamics for North America
20.1.1.1. Drivers
20.1.1.2. Restraints
20.1.1.3. Opportunities
20.1.1.4. Trends
20.2. Africa Fructooligosaccharides (FOS) Market, by Form, 2019-2032(US$ Mn)
20.2.1. Overview
20.2.2. SRC Analysis
20.3. Africa Fructooligosaccharides (FOS) Market, by Source, 2019-2032(US$ Mn)
20.3.1. Overview
20.3.2. SRC Analysis
20.4. Africa Fructooligosaccharides (FOS) Market, by Application, 2019-2032(US$ Mn)
20.4.1. Overview
20.4.2. SRC Analysis
20.5. Africa Fructooligosaccharides (FOS) Market, By End-Use Industry, 2019-2032(US$ Mn)
20.5.1. Overview
20.5.2. SRC Analysis
20.6. Africa Fructooligosaccharides (FOS) Market, by Functionality, 2019-2032(US$ Mn)
20.6.1. Overview
20.6.2. SRC Analysis
20.7. Africa Fructooligosaccharides (FOS) Market, by Product Type, 2019-2032(US$ Mn)
20.7.1. Overview
20.7.2. SRC Analysis
20.8. Africa Fructooligosaccharides (FOS) Market, by Country, 2019-2032 (US$ Mn)
20.8.1. Middle East Fructooligosaccharides (FOS) Market, by Country, 2023 Vs 2032 (in%)
20.8.2. South Africa
20.8.3. Egypt
20.8.4. Rest of Africa
21. Company Profiles
21.1. Beneo
21.1.1. Company Overview
21.1.2. Products/Services Portfolio
21.1.3. Geographical Presence
21.1.4. SWOT Analysis
21.1.5. Financial Summary
21.1.5.1. Market Revenue and Net Profit (2019-2023)
21.1.5.2. Business Segment Revenue Analysis
21.1.5.3. Geographical Revenue Analysis
21.2. Biosynth
21.3. Cargill Incorporated
21.4. Galam
21.5. Ingredion
21.6. Meiji Holdings Co., Ltd.
21.7. Tata Chemicals Ltd.
21.8. Tereos Group
21.9. Südzucker AG (BENEO)
21.10. Baolingbao Biological Co., Ltd
22. Research Methodology
22.1. Research Methodology
22.2. Phase I – Secondary Research
22.3. Phase II – Data Modelling
22.3.1. Company Share Analysis Model
22.3.2. Revenue Based Modelling
22.4. Phase III – Primary Research
22.5. Research Limitations
22.5.1. Assumptions

List of Figures
FIG. 1 Global Fructooligosaccharides (FOS) Market: Research Methodology
FIG. 2 Market Size Estimation – Top Down & Bottom up Approach
FIG. 3 Global Fructooligosaccharides (FOS) Market Segmentation
FIG. 4 Global Fructooligosaccharides (FOS) Market, by Form, 2023 (US$ Mn)
FIG. 5 Global Fructooligosaccharides (FOS) Market, by Source, 2023 (US$ Mn)
FIG. 6 Global Fructooligosaccharides (FOS) Market, by Application, 2023 (US$ Mn)
FIG. 7 Global Fructooligosaccharides (FOS) Market, by Data Trasnfer Speed, 2023 (US$ Mn)
FIG. 8 Global Fructooligosaccharides (FOS) Market, by Functionality, 2023 (US$ Mn)
FIG. 9 Global Fructooligosaccharides (FOS) Market, by Product Type, 2023 (US$ Mn)
FIG. 10 Global Fructooligosaccharides (FOS) Market, by Geography, 2023 (US$ Mn)
FIG. 11 Attractive Investment Proposition, by Form, 2023
FIG. 12 Attractive Investment Proposition, by Source, 2023
FIG. 13 Attractive Investment Proposition, by Application, 2023
FIG. 14 Attractive Investment Proposition, By End-Use Industry, 2023
FIG. 15 Attractive Investment Proposition, by Functionality, 2023
FIG. 16 Attractive Investment Proposition, by Product Type, 2023
FIG. 17 Attractive Investment Proposition, by Geography, 2023
FIG. 18 Global Market Share Analysis of Key Fructooligosaccharides (FOS) Market Manufacturers, 2023
FIG. 19 Global Market Positioning of Key Fructooligosaccharides (FOS) Market Manufacturers, 2023
FIG. 20 Global Fructooligosaccharides (FOS) Market Value Contribution, By Form, 2023 & 2032 (Value %)
FIG. 21 Global Fructooligosaccharides (FOS) Market, by LIQUID FOS, Value, 2019-2032 (US$ Mn)
FIG. 22 Global Fructooligosaccharides (FOS) Market, by Powder FOS, Value, 2019-2032 (US$ Mn)
FIG. 23 Global Fructooligosaccharides (FOS) Market Value Contribution, By Source, 2023 & 2032 (Value %)
FIG. 24 Global Fructooligosaccharides (FOS) Market, by Inulin-Based FOS, Value, 2019-2032 (US$ Mn)
FIG. 25 Global Fructooligosaccharides (FOS) Market, by Sucrose-Based FOS, Value, 2019-2032 (US$ Mn)
FIG. 26 Global Fructooligosaccharides (FOS) Market Value Contribution, By Application, 2023 & 2032 (Value %)
FIG. 27 Global Fructooligosaccharides (FOS) Market, by Food and Beverages, Value, 2019-2032 (US$ Mn)
FIG. 28 Global Fructooligosaccharides (FOS) Market, by Animal Feed, Value, 2019-2032 (US$ Mn)
FIG. 29 Global Fructooligosaccharides (FOS) Market, by Pharmaceuticals, Value, 2019-2032 (US$ Mn)
FIG. 30 Global Fructooligosaccharides (FOS) Market Value Contribution, By End-Use Industry, 2023 & 2032 (Value %)
FIG. 31 Global Fructooligosaccharides (FOS) Market, by Food and Beverage Industry, Value, 2019-2032 (US$ Mn)
FIG. 32 Global Fructooligosaccharides (FOS) Market, by Dietary Supplements, Value, 2019-2032 (US$ Mn)
FIG. 33 Global Fructooligosaccharides (FOS) Market, by Animal Nutrition, Value, 2019-2032 (US$ Mn)
FIG. 34 Global Fructooligosaccharides (FOS) Market, by Pharmaceutical Industry, Value, 2019-2032 (US$ Mn)
FIG. 35 Global Fructooligosaccharides (FOS) Market Value Contribution, By Functionality, 2023 & 2032 (Value %)
FIG. 36 Global Fructooligosaccharides (FOS) Market, by Sweetening Agent, Value, 2019-2032 (US$ Mn)
FIG. 37 Global Fructooligosaccharides (FOS) Market, by Prebiotic, Value, 2019-2032 (US$ Mn)
FIG. 38 Global Fructooligosaccharides (FOS) Market, by Bulking Agent, Value, 2019-2032 (US$ Mn)
FIG. 39 Global Fructooligosaccharides (FOS) Market, by Texturizer, Value, 2019-2032 (US$ Mn)
FIG. 40 Global Fructooligosaccharides (FOS) Market Value Contribution, By Product Type, 2023 & 2032 (Value %)
FIG. 41 Global Fructooligosaccharides (FOS) Market, by High Purity FOS, Value, 2019-2032 (US$ Mn)
FIG. 42 Global Fructooligosaccharides (FOS) Market, by Blended FOS Products, Value, 2019-2032 (US$ Mn)
FIG. 43 North America Fructooligosaccharides (FOS) Market, 2019-2032 (US$ Mn)
FIG. 44 U.S. Fructooligosaccharides (FOS) Market, 2019-2032 (US$ Mn)
FIG. 45 Canada Fructooligosaccharides (FOS) Market, 2019-2032 (US$ Mn)
FIG. 46 Mexico Fructooligosaccharides (FOS) Market, 2019-2032 (US$ Mn)
FIG. 47 Europe Fructooligosaccharides (FOS) Market, 2019-2032 (US$ Mn)
FIG. 48 Germany Fructooligosaccharides (FOS) Market, 2019-2032 (US$ Mn)
FIG. 49 France Fructooligosaccharides (FOS) Market, 2019-2032 (US$ Mn)
FIG. 50 U.K. Fructooligosaccharides (FOS) Market, 2019-2032 (US$ Mn)
FIG. 51 Italy Fructooligosaccharides (FOS) Market, 2019-2032 (US$ Mn)
FIG. 52 Spain Fructooligosaccharides (FOS) Market, 2019-2032 (US$ Mn)
FIG. 53 Benelux Fructooligosaccharides (FOS) Market, 2019-2032 (US$ Mn)
FIG. 54 Russia Fructooligosaccharides (FOS) Market, 2019-2032 (US$ Mn)
FIG. 55 Rest of Europe Fructooligosaccharides (FOS) Market, 2019-2032 (US$ Mn)
FIG. 56 Asia Pacific Fructooligosaccharides (FOS) Market, 2019-2032 (US$ Mn)
FIG. 57 China Fructooligosaccharides (FOS) Market, 2019-2032 (US$ Mn)
FIG. 58 Japan Fructooligosaccharides (FOS) Market, 2019-2032 (US$ Mn)
FIG. 59 India Fructooligosaccharides (FOS) Market, 2019-2032 (US$ Mn)
FIG. 60 South Korea Fructooligosaccharides (FOS) Market, 2019-2032 (US$ Mn)
FIG. 61 South-East Asia Fructooligosaccharides (FOS) Market, 2019-2032 (US$ Mn)
FIG. 62 Rest of Asia Pacific Fructooligosaccharides (FOS) Market, 2019-2032 (US$ Mn)
FIG. 63 Latin America Fructooligosaccharides (FOS) Market, 2019-2032 (US$ Mn)
FIG. 64 Brazil Fructooligosaccharides (FOS) Market, 2019-2032 (US$ Mn)
FIG. 65 Argentina Fructooligosaccharides (FOS) Market, 2019-2032 (US$ Mn)
FIG. 66 Rest of Latin America Fructooligosaccharides (FOS) Market, 2019-2032 (US$ Mn)
FIG. 67 Middle East Fructooligosaccharides (FOS) Market, 2019-2032 (US$ Mn)
FIG. 68 UAE Fructooligosaccharides (FOS) Market, 2019-2032 (US$ Mn)
FIG. 69 Saudi Arabia Fructooligosaccharides (FOS) Market, 2019-2032 (US$ Mn)
FIG. 70 Rest of Middle East Fructooligosaccharides (FOS) Market, 2019-2032 (US$ Mn)
FIG. 71 Africa Fructooligosaccharides (FOS) Market, 2019-2032 (US$ Mn)
FIG. 72 South Africa Fructooligosaccharides (FOS) Market, 2019-2032 (US$ Mn)
FIG. 73 Egypt Fructooligosaccharides (FOS) Market, 2019-2032 (US$ Mn)
FIG. 74 Rest of Africa Fructooligosaccharides (FOS) Market, 2019-2032 (US$ Mn)

List of Tables
TABLE 1 Market Snapshot: Global Fructooligosaccharides (FOS) Market
TABLE 2 Global Fructooligosaccharides (FOS) Market: Market Drivers Impact Analysis
TABLE 3 Global Fructooligosaccharides (FOS) Market: Market Restraints Impact Analysis
TABLE 4 Global Fructooligosaccharides (FOS) Market, by Competitive Benchmarking, 2023
TABLE 5 Global Fructooligosaccharides (FOS) Market, by Geographical Presence Analysis, 2023
TABLE 6 Global Fructooligosaccharides (FOS) Market, by Key Strategies Analysis, 2023
TABLE 7 Global Fructooligosaccharides (FOS) Market, by LIQUID FOS, By Region, 2019-2023 (US$ Mn)
TABLE 8 Global Fructooligosaccharides (FOS) Market, by LIQUID FOS, By Region, 2024-2032 (US$ Mn)
TABLE 9 Global Fructooligosaccharides (FOS) Market, by Powder FOS, By Region, 2019-2023 (US$ Mn)
TABLE 10 Global Fructooligosaccharides (FOS) Market, by Powder FOS, By Region, 2024-2032 (US$ Mn)
TABLE 11 Global Fructooligosaccharides (FOS) Market, by Inulin-Based FOS, By Region, 2019-2023 (US$ Mn)
TABLE 12 Global Fructooligosaccharides (FOS) Market, by Inulin-Based FOS, By Region, 2024-2032 (US$ Mn)
TABLE 13 Global Fructooligosaccharides (FOS) Market, by Sucrose-Based FOS, By Region, 2019-2023 (US$ Mn)
TABLE 14 Global Fructooligosaccharides (FOS) Market, by Sucrose-Based FOS, By Region, 2024-2032 (US$ Mn)
TABLE 15 Global Fructooligosaccharides (FOS) Market, by Food and Beverages, By Region, 2019-2023 (US$ Mn)
TABLE 16 Global Fructooligosaccharides (FOS) Market, by Food and Beverages, By Region, 2024-2032 (US$ Mn)
TABLE 17 Global Fructooligosaccharides (FOS) Market, by Animal Feed, By Region, 2019-2023 (US$ Mn)
TABLE 18 Global Fructooligosaccharides (FOS) Market, by Animal Feed, By Region, 2024-2032 (US$ Mn)
TABLE 19 Global Fructooligosaccharides (FOS) Market, by Food and Beverage Industry, By Region, 2019-2023 (US$ Mn)
TABLE 20 Global Fructooligosaccharides (FOS) Market, by Food and Beverage Industry, By Region, 2024-2032 (US$ Mn)
TABLE 21 Global Fructooligosaccharides (FOS) Market, by Dietary Supplements, By Region, 2019-2023 (US$ Mn)
TABLE 22 Global Fructooligosaccharides (FOS) Market, by Dietary Supplements, By Region, 2024-2032 (US$ Mn)
TABLE 23 Global Fructooligosaccharides (FOS) Market, by Animal Nutrition, By Region, 2019-2023 (US$ Mn)
TABLE 24 Global Fructooligosaccharides (FOS) Market, by Animal Nutrition, By Region, 2024-2032 (US$ Mn)
TABLE 25 Global Fructooligosaccharides (FOS) Market, by Food and Beverage Industry, By Region, 2019-2023 (US$ Mn)
TABLE 26 Global Fructooligosaccharides (FOS) Market, by Food and Beverage Industry, By Region, 2024-2032 (US$ Mn)
TABLE 27 Global Fructooligosaccharides (FOS) Market, by Dietary Supplements, By Region, 2019-2023 (US$ Mn)
TABLE 28 Global Fructooligosaccharides (FOS) Market, by Dietary Supplements, By Region, 2024-2032 (US$ Mn)
TABLE 29 Global Fructooligosaccharides (FOS) Market, by Animal Nutrition, By Region, 2019-2023 (US$ Mn)
TABLE 30 Global Fructooligosaccharides (FOS) Market, by Animal Nutrition, By Region, 2024-2032 (US$ Mn)
TABLE 31 Global Fructooligosaccharides (FOS) Market, by Pharmaceutical Industry, By Region, 2019-2023 (US$ Mn)
TABLE 32 Global Fructooligosaccharides (FOS) Market, by Pharmaceutical Industry, By Region, 2024-2032 (US$ Mn)
a. Global Fructooligosaccharides (FOS) Market, by Sweetening Agent, By Region, 2019-2023 (US$ Mn)
TABLE 33 Global Fructooligosaccharides (FOS) Market, by Sweetening Agent, By Region, 2024-2032 (US$ Mn)
TABLE 34 Global Fructooligosaccharides (FOS) Market, by Prebiotic, By Region, 2019-2023 (US$ Mn)
TABLE 35 Global Fructooligosaccharides (FOS) Market, by Prebiotic, By Region, 2024-2032 (US$ Mn)
TABLE 36 Global Fructooligosaccharides (FOS) Market, by High Purity FOS, By Region, 2019-2023 (US$ Mn)
TABLE 37 Global Fructooligosaccharides (FOS) Market, by High Purity FOS, By Region, 2024-2032 (US$ Mn)
TABLE 38 Global Fructooligosaccharides (FOS) Market, by Blended FOS Products, By Region, 2019-2023 (US$ Mn)
TABLE 39 Global Fructooligosaccharides (FOS) Market, by Blended FOS Products, By Region, 2024-2032 (US$ Mn)
TABLE 40 Global Fructooligosaccharides (FOS) Market, by Form, 2019-2023 (US$ Mn)
TABLE 41 Global Fructooligosaccharides (FOS) Market, by Form, 2024-2032 (US$ Mn)
TABLE 42 Global Fructooligosaccharides (FOS) Market, by Source, 2019-2023 (US$ Mn)
TABLE 43 Global Fructooligosaccharides (FOS) Market, by Source, 2024-2032 (US$ Mn)
TABLE 44 Global Fructooligosaccharides (FOS) Market, by Application, 2019-2023 (US$ Mn)
TABLE 45 Global Fructooligosaccharides (FOS) Market, by Application, 2024-2032 (US$ Mn)
TABLE 46 Global Fructooligosaccharides (FOS) Market, By End-Use Industry, By Region, 2019-2023 (US$ Mn)
TABLE 47 Global Fructooligosaccharides (FOS) Market, By End-Use Industry, By Region, 2024-2032 (US$ Mn)
TABLE 48 Global Fructooligosaccharides (FOS) Market, by Functionality, 2019-2023 (US$ Mn)
TABLE 49 Global Fructooligosaccharides (FOS) Market, by Functionality, 2024-2032 (US$ Mn)
TABLE 50 Global Fructooligosaccharides (FOS) Market, by Product Type, 2019-2023 (US$ Mn)
TABLE 51 Global Fructooligosaccharides (FOS) Market, by Product Type, 2024-2032 (US$ Mn)
TABLE 52 Global Fructooligosaccharides (FOS) Market, by Price Range, 2019-2023 (US$ Mn)
TABLE 53 Global Fructooligosaccharides (FOS) Market, by Price Range, 2024-2032 (US$ Mn)
TABLE 54 Global Fructooligosaccharides (FOS) Market, by Region, 2019-2023 (US$ Mn)
TABLE 55 Global Fructooligosaccharides (FOS) Market, by Region, 2024-2032 (US$ Mn)
TABLE 56 North America Fructooligosaccharides (FOS) Market, by Form, 2019-2023 (US$ Mn)
TABLE 57 North America Fructooligosaccharides (FOS) Market, by Form, 2024-2032 (US$ Mn)
TABLE 58 North America Fructooligosaccharides (FOS) Market, by Source, 2019-2023 (US$ Mn)
TABLE 59 North America Fructooligosaccharides (FOS) Market, by Source, 2024-2032 (US$ Mn)
TABLE 60 North America Fructooligosaccharides (FOS) Market, by Application, 2019-2023 (US$ Mn)
TABLE 61 North America Fructooligosaccharides (FOS) Market, by Application, 2024-2032 (US$ Mn)
TABLE 62 North America Fructooligosaccharides (FOS) Market, By End-Use Industry, By Region, 2019-2023 (US$ Mn)
TABLE 63 North America Fructooligosaccharides (FOS) Market, By End-Use Industry, By Region, 2024-2032 (US$ Mn)
TABLE 64 North America Fructooligosaccharides (FOS) Market, by Functionality, 2019-2023 (US$ Mn)
TABLE 65 North America Fructooligosaccharides (FOS) Market, by Functionality, 2024-2032 (US$ Mn)
TABLE 66 North America Fructooligosaccharides (FOS) Market, by Product Type, 2019-2023 (US$ Mn)
TABLE 67 North America Fructooligosaccharides (FOS) Market, by Product Type, 2024-2032 (US$ Mn)
TABLE 68 North America Fructooligosaccharides (FOS) Market, by Country, 2019-2023 (US$ Mn)
TABLE 69 North America Fructooligosaccharides (FOS) Market, by Country, 2024-2032 (US$ Mn)
TABLE 70 United States Fructooligosaccharides (FOS) Market, by Form, 2019-2023 (US$ Mn)
TABLE 71 United States Fructooligosaccharides (FOS) Market, by Form, 2024-2032 (US$ Mn)
TABLE 72 United States Fructooligosaccharides (FOS) Market, by Source, 2019-2023 (US$ Mn)
TABLE 73 United States Fructooligosaccharides (FOS) Market, by Source, 2024-2032 (US$ Mn)
TABLE 74 United States Fructooligosaccharides (FOS) Market, by Application, 2019-2023 (US$ Mn)
TABLE 75 United States Fructooligosaccharides (FOS) Market, by Application, 2024-2032 (US$ Mn)
TABLE 76 United States Fructooligosaccharides (FOS) Market, By End-Use Industry, By Region, 2019-2023 (US$ Mn)
TABLE 77 United States Fructooligosaccharides (FOS) Market, By End-Use Industry, By Region, 2024-2032 (US$ Mn)
TABLE 78 United States Fructooligosaccharides (FOS) Market, by Functionality, 2019-2023 (US$ Mn)
TABLE 79 United States Fructooligosaccharides (FOS) Market, by Functionality, 2024-2032 (US$ Mn)
TABLE 80 United States Fructooligosaccharides (FOS) Market, by Product Type, 2019-2023 (US$ Mn)
TABLE 81 United States Fructooligosaccharides (FOS) Market, by Product Type, 2024-2032 (US$ Mn)
TABLE 82 Canada Fructooligosaccharides (FOS) Market, by Form, 2019-2023 (US$ Mn)
TABLE 83 Canada Fructooligosaccharides (FOS) Market, by Form, 2024-2032 (US$ Mn)
TABLE 84 Canada Fructooligosaccharides (FOS) Market, by Source, 2019-2023 (US$ Mn)
TABLE 85 Canada Fructooligosaccharides (FOS) Market, by Source, 2024-2032 (US$ Mn)
TABLE 86 Canada Fructooligosaccharides (FOS) Market, by Application, 2019-2023 (US$ Mn)
TABLE 87 Canada Fructooligosaccharides (FOS) Market, by Application, 2024-2032 (US$ Mn)
TABLE 88 Canada Fructooligosaccharides (FOS) Market, By End-Use Industry, By Region, 2019-2023 (US$ Mn)
TABLE 89 Canada Fructooligosaccharides (FOS) Market, By End-Use Industry, By Region, 2024-2032 (US$ Mn)
TABLE 90 Canada Fructooligosaccharides (FOS) Market, by Functionality, 2019-2023 (US$ Mn)
TABLE 91 Canada Fructooligosaccharides (FOS) Market, by Functionality, 2024-2032 (US$ Mn)
TABLE 92 Canada Fructooligosaccharides (FOS) Market, by Product Type, 2019-2023 (US$ Mn)
TABLE 93 Canada Fructooligosaccharides (FOS) Market, by Product Type, 2024-2032 (US$ Mn)
TABLE 94 Mexico Fructooligosaccharides (FOS) Market, by Form, 2019-2023 (US$ Mn)
TABLE 95 Mexico Fructooligosaccharides (FOS) Market, by Form, 2024-2032 (US$ Mn)
TABLE 96 Mexico Fructooligosaccharides (FOS) Market, by Source, 2019-2023 (US$ Mn)
TABLE 97 Mexico Fructooligosaccharides (FOS) Market, by Source, 2024-2032 (US$ Mn)
TABLE 98 Mexico Fructooligosaccharides (FOS) Market, by Application, 2019-2023 (US$ Mn)
TABLE 99 Mexico Fructooligosaccharides (FOS) Market, by Application, 2024-2032 (US$ Mn)
TABLE 100 Mexico Fructooligosaccharides (FOS) Market, By End-Use Industry, By Region, 2019-2023 (US$ Mn)
TABLE 101 Mexico Fructooligosaccharides (FOS) Market, By End-Use Industry, By Region, 2024-2032 (US$ Mn)
TABLE 102 Mexico Fructooligosaccharides (FOS) Market, by Functionality, 2019-2023 (US$ Mn)
TABLE 103 Mexico Fructooligosaccharides (FOS) Market, by Functionality, 2024-2032 (US$ Mn)
TABLE 104 Mexico Fructooligosaccharides (FOS) Market, by Product Type, 2019-2023 (US$ Mn)
TABLE 105 Mexico Fructooligosaccharides (FOS) Market, by Product Type, 2024-2032 (US$ Mn)
TABLE 106 Europe Fructooligosaccharides (FOS) Market, by Form, 2019-2023 (US$ Mn)
TABLE 107 Europe Fructooligosaccharides (FOS) Market, by Form, 2024-2032 (US$ Mn)
TABLE 108 Europe Fructooligosaccharides (FOS) Market, by Source, 2019-2023 (US$ Mn)
TABLE 109 Europe Fructooligosaccharides (FOS) Market, by Source, 2024-2032 (US$ Mn)
TABLE 110 Europe Fructooligosaccharides (FOS) Market, by Application, 2019-2023 (US$ Mn)
TABLE 111 Europe Fructooligosaccharides (FOS) Market, by Application, 2024-2032 (US$ Mn)
TABLE 112 Europe Fructooligosaccharides (FOS) Market, By End-Use Industry, By Region, 2019-2023 (US$ Mn)
TABLE 113 Europe Fructooligosaccharides (FOS) Market, By End-Use Industry, By Region, 2024-2032 (US$ Mn)
TABLE 114 Europe Fructooligosaccharides (FOS) Market, by Functionality, 2019-2023 (US$ Mn)
TABLE 115 Europe Fructooligosaccharides (FOS) Market, by Functionality, 2024-2032 (US$ Mn)
TABLE 116 Europe Fructooligosaccharides (FOS) Market, by Product Type, 2019-2023 (US$ Mn)
TABLE 117 Europe Fructooligosaccharides (FOS) Market, by Product Type, 2024-2032 (US$ Mn)
TABLE 118 Europe Fructooligosaccharides (FOS) Market, by Country, 2019-2023 (US$ Mn)
TABLE 119 Europe Fructooligosaccharides (FOS) Market, by Country, 2024-2032 (US$ Mn)
TABLE 120 Germany Fructooligosaccharides (FOS) Market, by Form, 2019-2023 (US$ Mn)
TABLE 121 Germany Fructooligosaccharides (FOS) Market, by Form, 2024-2032 (US$ Mn)
TABLE 122 Germany Fructooligosaccharides (FOS) Market, by Source, 2019-2023 (US$ Mn)
TABLE 123 Germany Fructooligosaccharides (FOS) Market, by Source, 2024-2032 (US$ Mn)
TABLE 124 Germany Fructooligosaccharides (FOS) Market, by Application, 2019-2023 (US$ Mn)
TABLE 125 Germany Fructooligosaccharides (FOS) Market, by Application, 2024-2032 (US$ Mn)
TABLE 126 Germany Fructooligosaccharides (FOS) Market, By End-Use Industry, By Region, 2019-2023 (US$ Mn)
TABLE 127 Germany Fructooligosaccharides (FOS) Market, By End-Use Industry, By Region, 2024-2032 (US$ Mn)
TABLE 128 Germany Fructooligosaccharides (FOS) Market, by Functionality, 2019-2023 (US$ Mn)
TABLE 129 Germany Fructooligosaccharides (FOS) Market, by Functionality, 2024-2032 (US$ Mn)
TABLE 130 Germany Fructooligosaccharides (FOS) Market, by Product Type, 2019-2023 (US$ Mn)
TABLE 131 Germany Fructooligosaccharides (FOS) Market, by Product Type, 2024-2032 (US$ Mn)
TABLE 132 France Fructooligosaccharides (FOS) Market, by Form, 2019-2023 (US$ Mn)
TABLE 133 France Fructooligosaccharides (FOS) Market, by Form, 2024-2032 (US$ Mn)
TABLE 134 France Fructooligosaccharides (FOS) Market, by Source, 2019-2023 (US$ Mn)
TABLE 135 France Fructooligosaccharides (FOS) Market, by Source, 2024-2032 (US$ Mn)
TABLE 136 France Fructooligosaccharides (FOS) Market, by Application, 2019-2023 (US$ Mn)
TABLE 137 France Fructooligosaccharides (FOS) Market, by Application, 2024-2032 (US$ Mn)
TABLE 138 France Fructooligosaccharides (FOS) Market, By End-Use Industry, By Region, 2019-2023 (US$ Mn)
TABLE 139 France Fructooligosaccharides (FOS) Market, By End-Use Industry, By Region, 2024-2032 (US$ Mn)
TABLE 140 France Fructooligosaccharides (FOS) Market, by Functionality, 2019-2023 (US$ Mn)
TABLE 141 France Fructooligosaccharides (FOS) Market, by Functionality, 2024-2032 (US$ Mn)
TABLE 142 France Fructooligosaccharides (FOS) Market, by Product Type, 2019-2023 (US$ Mn)
TABLE 143 France Fructooligosaccharides (FOS) Market, by Product Type, 2024-2032 (US$ Mn)
TABLE 144 United Kingdom Fructooligosaccharides (FOS) Market, by Form, 2019-2023 (US$ Mn)
TABLE 145 United Kingdom Fructooligosaccharides (FOS) Market, by Form, 2024-2032 (US$ Mn)
TABLE 146 United Kingdom Fructooligosaccharides (FOS) Market, by Source, 2019-2023 (US$ Mn)
TABLE 147 United Kingdom Fructooligosaccharides (FOS) Market, by Source, 2024-2032 (US$ Mn)
TABLE 148 United Kingdom Fructooligosaccharides (FOS) Market, by Application, 2019-2023 (US$ Mn)
TABLE 149 United Kingdom Fructooligosaccharides (FOS) Market, by Application, 2024-2032 (US$ Mn)
TABLE 150 United Kingdom Fructooligosaccharides (FOS) Market, By End-Use Industry, By Region, 2019-2023 (US$ Mn)
TABLE 151 United Kingdom Fructooligosaccharides (FOS) Market, By End-Use Industry, By Region, 2024-2032 (US$ Mn)
TABLE 152 United Kingdom Fructooligosaccharides (FOS) Market, by Functionality, 2019-2023 (US$ Mn)
TABLE 153 United Kingdom Fructooligosaccharides (FOS) Market, by Functionality, 2024-2032 (US$ Mn)
TABLE 154 United Kingdom Fructooligosaccharides (FOS) Market, by Product Type, 2019-2023 (US$ Mn)
TABLE 155 United Kingdom Fructooligosaccharides (FOS) Market, by Product Type, 2024-2032 (US$ Mn)
TABLE 156 Italy Fructooligosaccharides (FOS) Market, by Form, 2019-2023 (US$ Mn)
TABLE 157 Italy Fructooligosaccharides (FOS) Market, by Form, 2024-2032 (US$ Mn)
TABLE 158 Italy Fructooligosaccharides (FOS) Market, by Source, 2019-2023 (US$ Mn)
TABLE 159 Italy Fructooligosaccharides (FOS) Market, by Source, 2024-2032 (US$ Mn)
TABLE 160 Italy Fructooligosaccharides (FOS) Market, by Application, 2019-2023 (US$ Mn)
TABLE 161 Italy Fructooligosaccharides (FOS) Market, by Application, 2024-2032 (US$ Mn)
TABLE 162 Italy Fructooligosaccharides (FOS) Market, By End-Use Industry, By Region, 2019-2023 (US$ Mn)
TABLE 163 Italy Fructooligosaccharides (FOS) Market, By End-Use Industry, By Region, 2024-2032 (US$ Mn)
TABLE 164 Italy Fructooligosaccharides (FOS) Market, by Functionality, 2019-2023 (US$ Mn)
TABLE 165 Italy Fructooligosaccharides (FOS) Market, by Functionality, 2024-2032 (US$ Mn)
TABLE 166 Italy Fructooligosaccharides (FOS) Market, by Product Type, 2019-2023 (US$ Mn)
TABLE 167 Italy Fructooligosaccharides (FOS) Market, by Product Type, 2024-2032 (US$ Mn)
TABLE 168 Spain Fructooligosaccharides (FOS) Market, by Form, 2019-2023 (US$ Mn)
TABLE 169 Spain Fructooligosaccharides (FOS) Market, by Form, 2024-2032 (US$ Mn)
TABLE 170 Spain Fructooligosaccharides (FOS) Market, by Source, 2019-2023 (US$ Mn)
TABLE 171 Spain Fructooligosaccharides (FOS) Market, by Source, 2024-2032 (US$ Mn)
TABLE 172 Spain Fructooligosaccharides (FOS) Market, by Application, 2019-2023 (US$ Mn)
TABLE 173 Spain Fructooligosaccharides (FOS) Market, by Application, 2024-2032 (US$ Mn)
TABLE 174 Spain Fructooligosaccharides (FOS) Market, By End-Use Industry, By Region, 2019-2023 (US$ Mn)
TABLE 175 Spain Fructooligosaccharides (FOS) Market, By End-Use Industry, By Region, 2024-2032 (US$ Mn)
TABLE 176 Spain Fructooligosaccharides (FOS) Market, by Functionality, 2019-2023 (US$ Mn)
TABLE 177 Spain Fructooligosaccharides (FOS) Market, by Functionality, 2024-2032 (US$ Mn)
TABLE 178 Spain Fructooligosaccharides (FOS) Market, by Product Type, 2019-2023 (US$ Mn)
TABLE 179 Spain Fructooligosaccharides (FOS) Market, by Product Type, 2024-2032 (US$ Mn)
TABLE 180 Benelux Fructooligosaccharides (FOS) Market, by Form, 2019-2023 (US$ Mn)
TABLE 181 Benelux Fructooligosaccharides (FOS) Market, by Form, 2024-2032 (US$ Mn)
TABLE 182 Benelux Fructooligosaccharides (FOS) Market, by Source, 2019-2023 (US$ Mn)
TABLE 183 Benelux Fructooligosaccharides (FOS) Market, by Source, 2024-2032 (US$ Mn)
TABLE 184 Benelux Fructooligosaccharides (FOS) Market, by Application, 2019-2023 (US$ Mn)
TABLE 185 Benelux Fructooligosaccharides (FOS) Market, by Application, 2024-2032 (US$ Mn)
TABLE 186 Benelux Fructooligosaccharides (FOS) Market, By End-Use Industry, By Region, 2019-2023 (US$ Mn)
TABLE 187 Benelux Fructooligosaccharides (FOS) Market, By End-Use Industry, By Region, 2024-2032 (US$ Mn)
TABLE 188 Benelux Fructooligosaccharides (FOS) Market, by Functionality, 2019-2023 (US$ Mn)
TABLE 189 Benelux Fructooligosaccharides (FOS) Market, by Functionality, 2024-2032 (US$ Mn)
TABLE 190 Benelux Fructooligosaccharides (FOS) Market, by Product Type, 2019-2023 (US$ Mn)
TABLE 191 Benelux Fructooligosaccharides (FOS) Market, by Product Type, 2024-2032 (US$ Mn)
TABLE 192 Russia Fructooligosaccharides (FOS) Market, by Form, 2019-2023 (US$ Mn)
TABLE 193 Russia Fructooligosaccharides (FOS) Market, by Form, 2024-2032 (US$ Mn)
TABLE 194 Russia Fructooligosaccharides (FOS) Market, by Source, 2019-2023 (US$ Mn)
TABLE 195 Russia Fructooligosaccharides (FOS) Market, by Source, 2024-2032 (US$ Mn)
TABLE 196 Russia Fructooligosaccharides (FOS) Market, by Application, 2019-2023 (US$ Mn)
TABLE 197 Russia Fructooligosaccharides (FOS) Market, by Application, 2024-2032 (US$ Mn)
TABLE 198 Russia Fructooligosaccharides (FOS) Market, By End-Use Industry, By Region, 2019-2023 (US$ Mn)
TABLE 199 Russia Fructooligosaccharides (FOS) Market, By End-Use Industry, By Region, 2024-2032 (US$ Mn)
TABLE 200 Russia Fructooligosaccharides (FOS) Market, by Functionality, 2019-2023 (US$ Mn)
TABLE 201 Russia Fructooligosaccharides (FOS) Market, by Functionality, 2024-2032 (US$ Mn)
TABLE 202 Russia Fructooligosaccharides (FOS) Market, by Product Type, 2019-2023 (US$ Mn)
TABLE 203 Russia Fructooligosaccharides (FOS) Market, by Product Type, 2024-2032 (US$ Mn)
TABLE 204 Rest of Europe Fructooligosaccharides (FOS) Market, by Form, 2019-2023 (US$ Mn)
TABLE 205 Rest of Europe Fructooligosaccharides (FOS) Market, by Form, 2024-2032 (US$ Mn)
TABLE 206 Rest of Europe Fructooligosaccharides (FOS) Market, by Source, 2019-2023 (US$ Mn)
TABLE 207 Rest of Europe Fructooligosaccharides (FOS) Market, by Source, 2024-2032 (US$ Mn)
TABLE 208 Rest of Europe Fructooligosaccharides (FOS) Market, by Application, 2019-2023 (US$ Mn)
TABLE 209 Rest of Europe Fructooligosaccharides (FOS) Market, by Application, 2024-2032 (US$ Mn)
TABLE 210 Rest of Europe Fructooligosaccharides (FOS) Market, By End-Use Industry, By Region, 2019-2023 (US$ Mn)
TABLE 211 Rest of Europe Fructooligosaccharides (FOS) Market, By End-Use Industry, By Region, 2024-2032 (US$ Mn)
TABLE 212 Rest of Europe Fructooligosaccharides (FOS) Market, by Functionality, 2019-2023 (US$ Mn)
TABLE 213 Rest of Europe Fructooligosaccharides (FOS) Market, by Functionality, 2024-2032 (US$ Mn)
TABLE 214 Rest of Europe Fructooligosaccharides (FOS) Market, by Product Type, 2019-2023 (US$ Mn)
TABLE 215 Rest of Europe Fructooligosaccharides (FOS) Market, by Product Type, 2024-2032 (US$ Mn)
TABLE 216 Asia Pacific Fructooligosaccharides (FOS) Market, by Form, 2019-2023 (US$ Mn)
TABLE 217 Asia Pacific Fructooligosaccharides (FOS) Market, by Form, 2024-2032 (US$ Mn)
TABLE 218 Asia Pacific Fructooligosaccharides (FOS) Market, by Source, 2019-2023 (US$ Mn)
TABLE 219 Asia Pacific Fructooligosaccharides (FOS) Market, by Source, 2024-2032 (US$ Mn)
TABLE 220 Asia Pacific Fructooligosaccharides (FOS) Market, by Application, 2019-2023 (US$ Mn)
TABLE 221 Asia Pacific Fructooligosaccharides (FOS) Market, by Application, 2024-2032 (US$ Mn)
TABLE 222 Asia Pacific Fructooligosaccharides (FOS) Market, By End-Use Industry, By Region, 2019-2023 (US$ Mn)
TABLE 223 Asia Pacific Fructooligosaccharides (FOS) Market, By End-Use Industry, By Region, 2024-2032 (US$ Mn)
TABLE 224 Asia Pacific Fructooligosaccharides (FOS) Market, by Functionality, 2019-2023 (US$ Mn)
TABLE 225 Asia Pacific Fructooligosaccharides (FOS) Market, by Functionality, 2024-2032 (US$ Mn)
TABLE 226 Asia Pacific Fructooligosaccharides (FOS) Market, by Product Type, 2019-2023 (US$ Mn)
TABLE 227 Asia Pacific Fructooligosaccharides (FOS) Market, by Product Type, 2024-2032 (US$ Mn)
TABLE 228 China Fructooligosaccharides (FOS) Market, by Form, 2019-2023 (US$ Mn)
TABLE 229 China Fructooligosaccharides (FOS) Market, by Form, 2024-2032 (US$ Mn)
TABLE 230 China Fructooligosaccharides (FOS) Market, by Source, 2019-2023 (US$ Mn)
TABLE 231 China Fructooligosaccharides (FOS) Market, by Source, 2024-2032 (US$ Mn)
TABLE 232 China Fructooligosaccharides (FOS) Market, by Application, 2019-2023 (US$ Mn)
TABLE 233 China Fructooligosaccharides (FOS) Market, by Application, 2024-2032 (US$ Mn)
TABLE 234 China Fructooligosaccharides (FOS) Market, By End-Use Industry, By Region, 2019-2023 (US$ Mn)
TABLE 235 China Fructooligosaccharides (FOS) Market, By End-Use Industry, By Region, 2024-2032 (US$ Mn)
TABLE 236 China Fructooligosaccharides (FOS) Market, by Functionality, 2019-2023 (US$ Mn)
TABLE 237 China Fructooligosaccharides (FOS) Market, by Functionality, 2024-2032 (US$ Mn)
TABLE 238 China Fructooligosaccharides (FOS) Market, by Product Type, 2019-2023 (US$ Mn)
TABLE 239 China Fructooligosaccharides (FOS) Market, by Product Type, 2024-2032 (US$ Mn)
TABLE 240 Japan Fructooligosaccharides (FOS) Market, by Form, 2019-2023 (US$ Mn)
TABLE 241 Japan Fructooligosaccharides (FOS) Market, by Form, 2024-2032 (US$ Mn)
TABLE 242 Japan Fructooligosaccharides (FOS) Market, by Source, 2019-2023 (US$ Mn)
TABLE 243 Japan Fructooligosaccharides (FOS) Market, by Source, 2024-2032 (US$ Mn)
TABLE 244 Japan Fructooligosaccharides (FOS) Market, by Application, 2019-2023 (US$ Mn)
TABLE 245 Japan Fructooligosaccharides (FOS) Market, by Application, 2024-2032 (US$ Mn)
TABLE 246 Japan Fructooligosaccharides (FOS) Market, By End-Use Industry, By Region, 2019-2023 (US$ Mn)
TABLE 247 Japan Fructooligosaccharides (FOS) Market, By End-Use Industry, By Region, 2024-2032 (US$ Mn)
TABLE 248 Japan Fructooligosaccharides (FOS) Market, by Functionality, 2019-2023 (US$ Mn)
TABLE 249 Japan Fructooligosaccharides (FOS) Market, by Functionality, 2024-2032 (US$ Mn)
TABLE 250 Japan Fructooligosaccharides (FOS) Market, by Product Type, 2019-2023 (US$ Mn)
TABLE 251 Japan Fructooligosaccharides (FOS) Market, by Product Type, 2024-2032 (US$ Mn)
TABLE 252 India Fructooligosaccharides (FOS) Market, by Form, 2019-2023 (US$ Mn)
TABLE 253 India Fructooligosaccharides (FOS) Market, by Form, 2024-2032 (US$ Mn)
TABLE 254 India Fructooligosaccharides (FOS) Market, by Source, 2019-2023 (US$ Mn)
TABLE 255 India Fructooligosaccharides (FOS) Market, by Source, 2024-2032 (US$ Mn)
TABLE 256 India Fructooligosaccharides (FOS) Market, by Application, 2019-2023 (US$ Mn)
TABLE 257 India Fructooligosaccharides (FOS) Market, by Application, 2024-2032 (US$ Mn)
TABLE 258 India Fructooligosaccharides (FOS) Market, By End-Use Industry, By Region, 2019-2023 (US$ Mn)
TABLE 259 India Fructooligosaccharides (FOS) Market, By End-Use Industry, By Region, 2024-2032 (US$ Mn)
TABLE 260 India Fructooligosaccharides (FOS) Market, by Functionality, 2019-2023 (US$ Mn)
TABLE 261 India Fructooligosaccharides (FOS) Market, by Functionality, 2024-2032 (US$ Mn)
TABLE 262 India Fructooligosaccharides (FOS) Market, by Product Type, 2019-2023 (US$ Mn)
TABLE 263 India Fructooligosaccharides (FOS) Market, by Product Type, 2024-2032 (US$ Mn)
TABLE 264 South Korea Fructooligosaccharides (FOS) Market, by Form, 2019-2023 (US$ Mn)
TABLE 265 South Korea Fructooligosaccharides (FOS) Market, by Form, 2024-2032 (US$ Mn)
TABLE 266 South Korea Fructooligosaccharides (FOS) Market, by Source, 2019-2023 (US$ Mn)
TABLE 267 South Korea Fructooligosaccharides (FOS) Market, by Source, 2024-2032 (US$ Mn)
TABLE 268 South Korea Fructooligosaccharides (FOS) Market, by Application, 2019-2023 (US$ Mn)
TABLE 269 South Korea Fructooligosaccharides (FOS) Market, by Application, 2024-2032 (US$ Mn)
TABLE 270 South Korea Fructooligosaccharides (FOS) Market, By End-Use Industry, By Region, 2019-2023 (US$ Mn)
TABLE 271 South Korea Fructooligosaccharides (FOS) Market, By End-Use Industry, By Region, 2024-2032 (US$ Mn)
TABLE 272 South Korea Fructooligosaccharides (FOS) Market, by Functionality, 2019-2023 (US$ Mn)
TABLE 273 South Korea Fructooligosaccharides (FOS) Market, by Functionality, 2024-2032 (US$ Mn)
TABLE 274 South Korea Fructooligosaccharides (FOS) Market, by Product Type, 2019-2023 (US$ Mn)
TABLE 275 South Korea Fructooligosaccharides (FOS) Market, by Product Type, 2024-2032 (US$ Mn)
TABLE 276 South-East Asia Fructooligosaccharides (FOS) Market, by Form, 2019-2023 (US$ Mn)
TABLE 277 South-East Asia Fructooligosaccharides (FOS) Market, by Form, 2024-2032 (US$ Mn)
TABLE 278 South-East Asia Fructooligosaccharides (FOS) Market, by Source, 2019-2023 (US$ Mn)
TABLE 279 South-East Asia Fructooligosaccharides (FOS) Market, by Source, 2024-2032 (US$ Mn)
TABLE 280 South-East Asia Fructooligosaccharides (FOS) Market, by Application, 2019-2023 (US$ Mn)
TABLE 281 South-East Asia Fructooligosaccharides (FOS) Market, by Application, 2024-2032 (US$ Mn)
TABLE 282 South-East Asia Fructooligosaccharides (FOS) Market, By End-Use Industry, By Region, 2019-2023 (US$ Mn)
TABLE 283 South-East Asia Fructooligosaccharides (FOS) Market, By End-Use Industry, By Region, 2024-2032 (US$ Mn)
TABLE 284 South-East Asia Fructooligosaccharides (FOS) Market, by Functionality, 2019-2023 (US$ Mn)
TABLE 285 South-East Asia Fructooligosaccharides (FOS) Market, by Functionality, 2024-2032 (US$ Mn)
TABLE 286 South-East Asia Fructooligosaccharides (FOS) Market, by Product Type, 2019-2023 (US$ Mn)
TABLE 287 South-East Asia Fructooligosaccharides (FOS) Market, by Product Type, 2024-2032 (US$ Mn)
TABLE 288 Rest of Asia Pacific Fructooligosaccharides (FOS) Market, by Form, 2019-2023 (US$ Mn)
TABLE 289 Rest of Asia Pacific Fructooligosaccharides (FOS) Market, by Form, 2024-2032 (US$ Mn)
TABLE 290 Rest of Asia Pacific Fructooligosaccharides (FOS) Market, by Source, 2019-2023 (US$ Mn)
TABLE 291 Rest of Asia Pacific Fructooligosaccharides (FOS) Market, by Source, 2024-2032 (US$ Mn)
TABLE 292 Rest of Asia Pacific Fructooligosaccharides (FOS) Market, by Application, 2019-2023 (US$ Mn)
TABLE 293 Rest of Asia Pacific Fructooligosaccharides (FOS) Market, by Application, 2024-2032 (US$ Mn)
TABLE 294 Rest of Asia Pacific Fructooligosaccharides (FOS) Market, By End-Use Industry, By Region, 2019-2023 (US$ Mn)
TABLE 295 Rest of Asia Pacific Fructooligosaccharides (FOS) Market, By End-Use Industry, By Region, 2024-2032 (US$ Mn)
TABLE 296 Rest of Asia Pacific Fructooligosaccharides (FOS) Market, by Functionality, 2019-2023 (US$ Mn)
TABLE 297 Rest of Asia Pacific Fructooligosaccharides (FOS) Market, by Functionality, 2024-2032 (US$ Mn)
TABLE 298 Rest of Asia Pacific Fructooligosaccharides (FOS) Market, by Product Type, 2019-2023 (US$ Mn)
TABLE 299 Rest of Asia Pacific Fructooligosaccharides (FOS) Market, by Product Type, 2024-2032 (US$ Mn)
TABLE 300 Latin America Fructooligosaccharides (FOS) Market, by Form, 2019-2023 (US$ Mn)
TABLE 301 Latin America Fructooligosaccharides (FOS) Market, by Form, 2024-2032 (US$ Mn)
TABLE 302 Latin America Fructooligosaccharides (FOS) Market, by Source, 2019-2023 (US$ Mn)
TABLE 303 Latin America Fructooligosaccharides (FOS) Market, by Source, 2024-2032 (US$ Mn)
TABLE 304 Latin America Fructooligosaccharides (FOS) Market, by Application, 2019-2023 (US$ Mn)
TABLE 305 Latin America Fructooligosaccharides (FOS) Market, by Application, 2024-2032 (US$ Mn)
TABLE 306 Latin America Fructooligosaccharides (FOS) Market, By End-Use Industry, By Region, 2019-2023 (US$ Mn)
TABLE 307 Latin America Fructooligosaccharides (FOS) Market, By End-Use Industry, By Region, 2024-2032 (US$ Mn)
TABLE 308 Latin America Fructooligosaccharides (FOS) Market, by Functionality, 2019-2023 (US$ Mn)
TABLE 309 Latin America Fructooligosaccharides (FOS) Market, by Functionality, 2024-2032 (US$ Mn)
TABLE 310 Latin America Fructooligosaccharides (FOS) Market, by Product Type, 2019-2023 (US$ Mn)
TABLE 311 Latin America Fructooligosaccharides (FOS) Market, by Product Type, 2024-2032 (US$ Mn)
TABLE 312 Brazil Fructooligosaccharides (FOS) Market, by Form, 2019-2023 (US$ Mn)
TABLE 313 Brazil Fructooligosaccharides (FOS) Market, by Form, 2024-2032 (US$ Mn)
TABLE 314 Brazil Fructooligosaccharides (FOS) Market, by Source, 2019-2023 (US$ Mn)
TABLE 315 Brazil Fructooligosaccharides (FOS) Market, by Source, 2024-2032 (US$ Mn)
TABLE 316 Brazil Fructooligosaccharides (FOS) Market, by Application, 2019-2023 (US$ Mn)
TABLE 317 Brazil Fructooligosaccharides (FOS) Market, by Application, 2024-2032 (US$ Mn)
TABLE 318 Brazil Fructooligosaccharides (FOS) Market, By End-Use Industry, By Region, 2019-2023 (US$ Mn)
TABLE 319 Brazil Fructooligosaccharides (FOS) Market, By End-Use Industry, By Region, 2024-2032 (US$ Mn)
TABLE 320 Brazil Fructooligosaccharides (FOS) Market, by Functionality, 2019-2023 (US$ Mn)
TABLE 321 Brazil Fructooligosaccharides (FOS) Market, by Functionality, 2024-2032 (US$ Mn)
TABLE 322 Brazil Fructooligosaccharides (FOS) Market, by Product Type, 2019-2023 (US$ Mn)
TABLE 323 Brazil Fructooligosaccharides (FOS) Market, by Product Type, 2024-2032 (US$ Mn)
TABLE 324 Argentina Fructooligosaccharides (FOS) Market, by Form, 2019-2023 (US$ Mn)
TABLE 325 Argentina Fructooligosaccharides (FOS) Market, by Form, 2024-2032 (US$ Mn)
TABLE 326 Argentina Fructooligosaccharides (FOS) Market, by Source, 2019-2023 (US$ Mn)
TABLE 327 Argentina Fructooligosaccharides (FOS) Market, by Source, 2024-2032 (US$ Mn)
TABLE 328 Argentina Fructooligosaccharides (FOS) Market, by Application, 2019-2023 (US$ Mn)
TABLE 329 Argentina Fructooligosaccharides (FOS) Market, by Application, 2024-2032 (US$ Mn)
TABLE 330 Argentina Fructooligosaccharides (FOS) Market, By End-Use Industry, By Region, 2019-2023 (US$ Mn)
TABLE 331 Argentina Fructooligosaccharides (FOS) Market, By End-Use Industry, By Region, 2024-2032 (US$ Mn)
TABLE 332 Argentina Fructooligosaccharides (FOS) Market, by Functionality, 2019-2023 (US$ Mn)
TABLE 333 Argentina Fructooligosaccharides (FOS) Market, by Functionality, 2024-2032 (US$ Mn)
TABLE 334 Argentina Fructooligosaccharides (FOS) Market, by Product Type, 2019-2023 (US$ Mn)
TABLE 335 Argentina Fructooligosaccharides (FOS) Market, by Product Type, 2024-2032 (US$ Mn)
TABLE 336 Rest of Latin America Fructooligosaccharides (FOS) Market, by Form, 2019-2023 (US$ Mn)
TABLE 337 Rest of Latin America Fructooligosaccharides (FOS) Market, by Form, 2024-2032 (US$ Mn)
TABLE 338 Rest of Latin America Fructooligosaccharides (FOS) Market, by Source, 2019-2023 (US$ Mn)
TABLE 339 Rest of Latin America Fructooligosaccharides (FOS) Market, by Source, 2024-2032 (US$ Mn)
TABLE 340 Rest of Latin America Fructooligosaccharides (FOS) Market, by Application, 2019-2023 (US$ Mn)
TABLE 341 Rest of Latin America Fructooligosaccharides (FOS) Market, by Application, 2024-2032 (US$ Mn)
TABLE 342 Rest of Latin America Fructooligosaccharides (FOS) Market, By End-Use Industry, By Region, 2019-2023 (US$ Mn)
TABLE 343 Rest of Latin America Fructooligosaccharides (FOS) Market, By End-Use Industry, By Region, 2024-2032 (US$ Mn)
TABLE 344 Rest of Latin America Fructooligosaccharides (FOS) Market, by Functionality, 2019-2023 (US$ Mn)
TABLE 345 Rest of Latin America Fructooligosaccharides (FOS) Market, by Functionality, 2024-2032 (US$ Mn)
TABLE 346 Rest of Latin America Fructooligosaccharides (FOS) Market, by Product Type, 2019-2023 (US$ Mn)
TABLE 347 Rest of Latin America Fructooligosaccharides (FOS) Market, by Product Type, 2024-2032 (US$ Mn)
TABLE 348 Middle East Fructooligosaccharides (FOS) Market, by Form, 2019-2023 (US$ Mn)
TABLE 349 Middle East Fructooligosaccharides (FOS) Market, by Form, 2024-2032 (US$ Mn)
TABLE 350 Middle East Fructooligosaccharides (FOS) Market, by Source, 2019-2023 (US$ Mn)
TABLE 351 Middle East Fructooligosaccharides (FOS) Market, by Source, 2024-2032 (US$ Mn)
TABLE 352 Middle East Fructooligosaccharides (FOS) Market, by Application, 2019-2023 (US$ Mn)
TABLE 353 Middle East Fructooligosaccharides (FOS) Market, by Application, 2024-2032 (US$ Mn)
TABLE 354 Middle East Fructooligosaccharides (FOS) Market, By End-Use Industry, By Region, 2019-2023 (US$ Mn)
TABLE 355 Middle East Fructooligosaccharides (FOS) Market, By End-Use Industry, By Region, 2024-2032 (US$ Mn)
TABLE 356 Middle East Fructooligosaccharides (FOS) Market, by Functionality, 2019-2023 (US$ Mn)
TABLE 357 Middle East Fructooligosaccharides (FOS) Market, by Functionality, 2024-2032 (US$ Mn)
TABLE 358 Middle East Fructooligosaccharides (FOS) Market, by Product Type, 2019-2023 (US$ Mn)
TABLE 359 Middle East Fructooligosaccharides (FOS) Market, by Product Type, 2024-2032 (US$ Mn)
TABLE 360 UAE Fructooligosaccharides (FOS) Market, by Form, 2019-2023 (US$ Mn)
TABLE 361 UAE Fructooligosaccharides (FOS) Market, by Form, 2024-2032 (US$ Mn)
TABLE 362 UAE Fructooligosaccharides (FOS) Market, by Source, 2019-2023 (US$ Mn)
TABLE 363 UAE Fructooligosaccharides (FOS) Market, by Source, 2024-2032 (US$ Mn)
TABLE 364 UAE Fructooligosaccharides (FOS) Market, by Application, 2019-2023 (US$ Mn)
TABLE 365 UAE Fructooligosaccharides (FOS) Market, by Application, 2024-2032 (US$ Mn)
TABLE 366 UAE Fructooligosaccharides (FOS) Market, By End-Use Industry, By Region, 2019-2023 (US$ Mn)
TABLE 367 UAE Fructooligosaccharides (FOS) Market, By End-Use Industry, By Region, 2024-2032 (US$ Mn)
TABLE 368 UAE Fructooligosaccharides (FOS) Market, by Functionality, 2019-2023 (US$ Mn)
TABLE 369 UAE Fructooligosaccharides (FOS) Market, by Functionality, 2024-2032 (US$ Mn)
TABLE 370 UAE Fructooligosaccharides (FOS) Market, by Product Type, 2019-2023 (US$ Mn)
TABLE 371 UAE Fructooligosaccharides (FOS) Market, by Product Type, 2024-2032 (US$ Mn)
TABLE 372 Saudi Arabia Fructooligosaccharides (FOS) Market, by Form, 2019-2023 (US$ Mn)
TABLE 373 Saudi Arabia Fructooligosaccharides (FOS) Market, by Form, 2024-2032 (US$ Mn)
TABLE 374 Saudi Arabia Fructooligosaccharides (FOS) Market, by Source, 2019-2023 (US$ Mn)
TABLE 375 Saudi Arabia Fructooligosaccharides (FOS) Market, by Source, 2024-2032 (US$ Mn)
TABLE 376 Saudi Arabia Fructooligosaccharides (FOS) Market, by Application, 2019-2023 (US$ Mn)
TABLE 377 Saudi Arabia Fructooligosaccharides (FOS) Market, by Application, 2024-2032 (US$ Mn)
TABLE 378 Saudi Arabia Fructooligosaccharides (FOS) Market, By End-Use Industry, By Region, 2019-2023 (US$ Mn)
TABLE 379 Saudi Arabia Fructooligosaccharides (FOS) Market, By End-Use Industry, By Region, 2024-2032 (US$ Mn)
TABLE 380 Saudi Arabia Fructooligosaccharides (FOS) Market, by Functionality, 2019-2023 (US$ Mn)
TABLE 381 Saudi Arabia Fructooligosaccharides (FOS) Market, by Functionality, 2024-2032 (US$ Mn)
TABLE 382 Saudi Arabia Fructooligosaccharides (FOS) Market, by Product Type, 2019-2023 (US$ Mn)
TABLE 383 Saudi Arabia Fructooligosaccharides (FOS) Market, by Product Type, 2024-2032 (US$ Mn)
TABLE 384 Rest of Middle East Fructooligosaccharides (FOS) Market, by Form, 2019-2023 (US$ Mn)
TABLE 385 Rest of Middle East Fructooligosaccharides (FOS) Market, by Form, 2024-2032 (US$ Mn)
TABLE 386 Rest of Middle East Fructooligosaccharides (FOS) Market, by Source, 2019-2023 (US$ Mn)
TABLE 387 Rest of Middle East Fructooligosaccharides (FOS) Market, by Source, 2024-2032 (US$ Mn)
TABLE 388 Rest of Middle East Fructooligosaccharides (FOS) Market, by Application, 2019-2023 (US$ Mn)
TABLE 389 Rest of Middle East Fructooligosaccharides (FOS) Market, by Application, 2024-2032 (US$ Mn)
TABLE 390 Rest of Middle East Fructooligosaccharides (FOS) Market, By End-Use Industry, By Region, 2019-2023 (US$ Mn)
TABLE 391 Rest of Middle East Fructooligosaccharides (FOS) Market, By End-Use Industry, By Region, 2024-2032 (US$ Mn)
TABLE 392 Rest of Middle East Fructooligosaccharides (FOS) Market, by Functionality, 2019-2023 (US$ Mn)
TABLE 393 Rest of Middle East Fructooligosaccharides (FOS) Market, by Functionality, 2024-2032 (US$ Mn)
TABLE 394 Rest of Middle East Fructooligosaccharides (FOS) Market, by Product Type, 2019-2023 (US$ Mn)
TABLE 395 Rest of Middle East Fructooligosaccharides (FOS) Market, by Product Type, 2024-2032 (US$ Mn)
TABLE 396 Africa Fructooligosaccharides (FOS) Market, by Form, 2019-2023 (US$ Mn)
TABLE 397 Africa Fructooligosaccharides (FOS) Market, by Form, 2024-2032 (US$ Mn)
TABLE 398 Africa Fructooligosaccharides (FOS) Market, by Source, 2019-2023 (US$ Mn)
TABLE 399 Africa Fructooligosaccharides (FOS) Market, by Source, 2024-2032 (US$ Mn)
TABLE 400 Africa Fructooligosaccharides (FOS) Market, by Application, 2019-2023 (US$ Mn)
TABLE 401 Africa Fructooligosaccharides (FOS) Market, by Application, 2024-2032 (US$ Mn)
TABLE 402 Africa Fructooligosaccharides (FOS) Market, By End-Use Industry, By Region, 2019-2023 (US$ Mn)
TABLE 403 Africa Fructooligosaccharides (FOS) Market, By End-Use Industry, By Region, 2024-2032 (US$ Mn)
TABLE 404 Africa Fructooligosaccharides (FOS) Market, by Functionality, 2019-2023 (US$ Mn)
TABLE 405 Africa Fructooligosaccharides (FOS) Market, by Functionality, 2024-2032 (US$ Mn)
TABLE 406 Africa Fructooligosaccharides (FOS) Market, by Product Type, 2019-2023 (US$ Mn)
TABLE 407 Africa Fructooligosaccharides (FOS) Market, by Product Type, 2024-2032 (US$ Mn)
TABLE 408 South Africa Fructooligosaccharides (FOS) Market, by Form, 2019-2023 (US$ Mn)
TABLE 409 South Africa Fructooligosaccharides (FOS) Market, by Form, 2024-2032 (US$ Mn)
TABLE 410 South Africa Fructooligosaccharides (FOS) Market, by Source, 2019-2023 (US$ Mn)
TABLE 411 South Africa Fructooligosaccharides (FOS) Market, by Source, 2024-2032 (US$ Mn)
TABLE 412 South Africa Fructooligosaccharides (FOS) Market, by Application, 2019-2023 (US$ Mn)
TABLE 413 South Africa Fructooligosaccharides (FOS) Market, by Application, 2024-2032 (US$ Mn)
TABLE 414 South Africa Fructooligosaccharides (FOS) Market, By End-Use Industry, By Region, 2019-2023 (US$ Mn)
TABLE 415 South Africa Fructooligosaccharides (FOS) Market, By End-Use Industry, By Region, 2024-2032 (US$ Mn)
TABLE 416 South Africa Fructooligosaccharides (FOS) Market, by Functionality, 2019-2023 (US$ Mn)
TABLE 417 South Africa Fructooligosaccharides (FOS) Market, by Functionality, 2024-2032 (US$ Mn)
TABLE 418 South Africa Fructooligosaccharides (FOS) Market, by Product Type, 2019-2023 (US$ Mn)
TABLE 419 South Africa Fructooligosaccharides (FOS) Market, by Product Type, 2024-2032 (US$ Mn)
TABLE 420 Egypt Fructooligosaccharides (FOS) Market, by Form, 2019-2023 (US$ Mn)
TABLE 421 Egypt Fructooligosaccharides (FOS) Market, by Form, 2024-2032 (US$ Mn)
TABLE 422 Egypt Fructooligosaccharides (FOS) Market, by Source, 2019-2023 (US$ Mn)
TABLE 423 Egypt Fructooligosaccharides (FOS) Market, by Source, 2024-2032 (US$ Mn)
TABLE 424 Egypt Fructooligosaccharides (FOS) Market, by Application, 2019-2023 (US$ Mn)
TABLE 425 Egypt Fructooligosaccharides (FOS) Market, by Application, 2024-2032 (US$ Mn)
TABLE 426 Egypt Fructooligosaccharides (FOS) Market, By End-Use Industry, By Region, 2019-2023 (US$ Mn)
TABLE 427 Egypt Fructooligosaccharides (FOS) Market, By End-Use Industry, By Region, 2024-2032 (US$ Mn)
TABLE 428 Egypt Fructooligosaccharides (FOS) Market, by Functionality, 2019-2023 (US$ Mn)
TABLE 429 Egypt Fructooligosaccharides (FOS) Market, by Functionality, 2024-2032 (US$ Mn)
TABLE 430 Egypt Fructooligosaccharides (FOS) Market, by Product Type, 2019-2023 (US$ Mn)
TABLE 431 Egypt Fructooligosaccharides (FOS) Market, by Product Type, 2024-2032 (US$ Mn)
TABLE 432 Rest of Africa Fructooligosaccharides (FOS) Market, by Form, 2019-2023 (US$ Mn)
TABLE 433 Rest of Africa Fructooligosaccharides (FOS) Market, by Form, 2024-2032 (US$ Mn)
TABLE 434 Rest of Africa Fructooligosaccharides (FOS) Market, by Source, 2019-2023 (US$ Mn)
TABLE 435 Rest of Africa Fructooligosaccharides (FOS) Market, by Source, 2024-2032 (US$ Mn)
TABLE 436 Rest of Africa Fructooligosaccharides (FOS) Market, by Application, 2019-2023 (US$ Mn)
TABLE 437 Rest of Africa Fructooligosaccharides (FOS) Market, by Application, 2024-2032 (US$ Mn)
TABLE 438 Rest of Africa Fructooligosaccharides (FOS) Market, By End-Use Industry, By Region, 2019-2023 (US$ Mn)
TABLE 439 Rest of Africa Fructooligosaccharides (FOS) Market, By End-Use Industry, By Region, 2024-2032 (US$ Mn)
TABLE 440 Rest of Africa Fructooligosaccharides (FOS) Market, by Functionality, 2019-2023 (US$ Mn)
TABLE 441 Rest of Africa Fructooligosaccharides (FOS) Market, by Functionality, 2024-2032 (US$ Mn)
TABLE 442 Rest of Africa Fructooligosaccharides (FOS) Market, by Product Type, 2019-2023 (US$ Mn)
TABLE 443 Rest of Africa Fructooligosaccharides (FOS) Market, by Product Type, 2024-2032 (US$ Mn)

Frequently Asked Questions

What is the current size of the global Fructooligosaccharides (FOS) Market?

The global Fructooligosaccharides (FOS) Market was valued at USD 2815.2 Million in 2023.

What is the expected growth rate of the Fructooligosaccharides (FOS) Market between 2024 and 2032?

The Fructooligosaccharides (FOS) Market is expected to grow at a CAGR of 11.50% between 2024 and 2032, reaching USD 7498.6 Million in 2032.

Which segment is leading the market share in terms of Form?

In 2023, liquid form led the market, accounting for 54.2% of sales. or

Which Application in the Food Products segment is expected to post the highest CAGR during the forecast period?

The Food and Beverage segment is the quickest rate of 11.0% during the forecast period

Who are the major players in the global Fructooligosaccharides (FOS) Market?

The top players include Beneo, Biosynth, Cargill, Incorporated, Galam, Ingredion, Meiji Holdings Co., Ltd and Others.

Individual Quick Freezing (IQF) Fruits Market

Published:
Report ID: 6585

Specialty Yeast Market

Published:
Report ID: 36557

Prebiotic Ingredients Market

Published:
Report ID: 36544

Chia Seeds Market

Published:
Report ID: 3952

Cereal Bars Market

Published:
Report ID: 3837

Food Encapsulation Market

Published:
Report ID: 5663

Gluten-Free Bakery Products Market

Published:
Report ID: 36306

Low Calorie Food Market

Published:
Report ID: 12195

Food Preservatives Market

Published:
Report ID: 5660

Dairy Blends Market

Published:
Report ID: 4452

Sodium Benzoate Market

Published:
Report ID: 10462

Ready to Use Therapeutic Food Market

Published:
Report ID: 8866

Purchase Options

$2999
Delivery Format: Excel.
$4999
Designed for the individual purchaser.
$6999
Users located at a single corporate site or regional office.
$7999
Allowed for unlimited sharing globally within one company.
Smallform of Sample request

Have a question?

User Profile

Don’t settle for less – trust Mitul to help you find the best solution.

Report delivery within 24 to 48 hours

– Other Info –

What people say?-

User Review

I am very impressed with the information in this report. The author clearly did their research when they came up with this product and it has already given me a lot of ideas.

Jana Schmidt
CEDAR CX Technologies

– Connect with us –

Phone

+91 6232 49 3207


support

24/7 Research Support


sales@credenceresearch.com

– Research Methodology –

Going beyond the basics: advanced techniques in research methodology

– Trusted By –

Pepshi, LG, Nestle
Motorola, Honeywell, Johnson and johnson
LG Chem, SIEMENS, Pfizer
Unilever, Samsonite, QIAGEN