
Glycated Albumin Assay Market Overview:
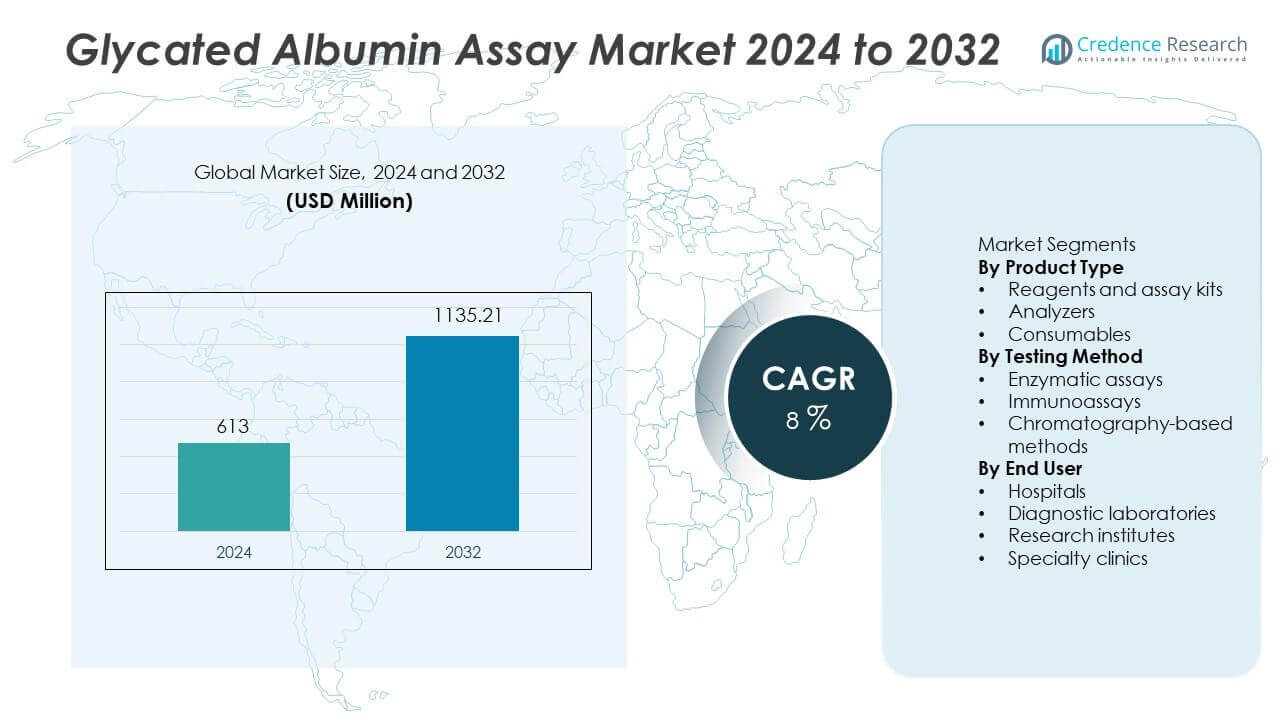
The glycated albumin assay market was valued at USD 613 million in 2024 and is projected to reach USD 1,135.21 million by 2032, registering a CAGR of 8% during the forecast period. (Credence Research)
| REPORT ATTRIBUTE | DETAILS |
|---|---|
| Historical Period | 2020-2023 |
| Base Year | 2024 |
| Forecast Period | 2025-2032 |
| Glycated Albumin Assay Market Size 2024 | USD 613 million |
| Glycated Albumin Assay Market, CAGR | 8% |
| Glycated Albumin Assay Market Size 2032 | USD 1,135.21 million |
The glycated albumin assay market is led by established diagnostic companies including Roche Diagnostics, Abbott Laboratories, Siemens Healthineers, Beckman Coulter, ARKRAY, Asahi Kasei Corporation, Tosoh Corporation, Randox Laboratories, DiaSys Diagnostic Systems, and Bio-Rad Laboratories. These players strengthen their positions through reliable assay performance, automation compatibility, and strong hospital relationships. North America leads the market with a 38% share, supported by advanced laboratory infrastructure and high diabetes testing volumes. Europe follows with a 27% share, driven by structured disease management programs and public healthcare systems. Asia Pacific holds a 24% share, reflecting rapid growth in diabetes prevalence and expanding diagnostic capacity. Competitive strategies focus on reagent innovation, analyzer integration, and geographic expansion.
Glycated Albumin Assay Market Insights
- Rising diabetes prevalence and the need for short-term glycemic monitoring drive demand, especially in renal and anemic patient care, supporting strong uptake of glycated albumin testing in hospitals and diagnostic laboratories.
- Enzymatic assays lead testing methods with a 48% share due to automation compatibility, while reagents and assay kits dominate product types with a 52% share because of repeat purchase demand.
- Competition remains moderate, with key players focusing on assay accuracy, analyzer integration, and portfolio expansion to strengthen long-term laboratory relationships.
- North America leads with a 38% share, followed by Europe at 27% and Asia Pacific at 24%, supported by advanced diagnostics, public healthcare programs, and growing diabetes screening.
Glycated Albumin Assay Market Segmentation Analysis:
By Product Type:
Reagents and assay kits dominate the product type segment with a 52% market share. This dominance reflects their recurring demand and routine replacement cycle. Clinical laboratories rely on ready-to-use kits for consistent testing throughput. Hospitals prefer standardized reagents to maintain test accuracy and reduce handling errors. Rising diabetes screening volumes further drive reagent consumption. Manufacturers focus on improving shelf life and assay stability. Analyzers hold a 31% share due to capital investment needs. Consumables account for the remaining demand, supported by daily laboratory operations and workflow continuity.
- For instance, Asahi Kasei’s Lucica® GA-L reagent offers an extended shelf life and requires a minimal volume of serum per test.
By Testing Method:
Enzymatic assays lead the testing method segment with a 48% market share. This method benefits from high specificity and faster turnaround time. Laboratories favor enzymatic assays for routine glycated albumin measurement. The method integrates easily with automated chemistry analyzers. Immunoassays hold a 34% share due to strong sensitivity and clinical familiarity. Chromatography-based methods represent niche use cases in research settings. Cost efficiency and automation compatibility strongly drive enzymatic assay adoption across diagnostic environments.
- For instance, ARKRAY’s GA reagent series supports high-speed analyzer throughput with rapid assay times.
By End User:
Diagnostic laboratories dominate the end user segment with a 46% market share. High sample volumes and centralized testing support this leadership. Laboratories invest in automated platforms to improve efficiency. Hospitals account for a 32% share due to inpatient diabetes monitoring needs. Research institutes contribute steady demand for clinical studies. Specialty clinics show growing adoption in outpatient diabetes management. Increasing focus on short-term glycemic monitoring drives broader end user participation.
Key Growth Drivers
Rising Prevalence of Diabetes and Pre-Diabetes
The increasing global diabetes burden strongly drives the glycated albumin assay market. Clinicians need tools for short-term glycemic assessment. Glycated albumin reflects glucose control over two to three weeks. This advantage supports use in unstable glycemic conditions. Rising pre-diabetes screening also expands testing volumes. Urbanization and lifestyle changes raise diabetes incidence. Healthcare systems emphasize early diagnosis and monitoring. Physicians adopt glycated albumin tests for patients with fluctuating glucose levels. This clinical relevance sustains steady demand growth across diagnostic settings.
- For instance, Roche Diagnostics’ Tina-quant® glycated albumin assay reports results within 10 minutes and uses a sample volume of 3 microliters.
Growing Adoption in Renal and Anemic Patient Management
Glycated albumin assays gain preference in patients with kidney disease. Hemoglobin-based tests show limitations in such populations. Anemia and dialysis alter HbA1c accuracy. Glycated albumin remains unaffected by red blood cell lifespan. Nephrologists rely on this marker for precise monitoring. Chronic kidney disease prevalence continues to rise globally. Hospitals integrate glycated albumin testing into renal care protocols. Improved clinical outcomes drive adoption. This specialized application significantly contributes to market expansion.
- For instance, DiaSys Diagnostic Systems’ Glycated Albumin FS assay operates on open chemistry analyzers, delivers results in under 10 minutes, requires 5 microliters of sample, and maintains linear measurement up to 60 grams per liter.
Expansion of Automated and Standardized Laboratory Testing
Automation in clinical laboratories supports market growth. Laboratories prioritize standardized and high-throughput assays. Glycated albumin tests integrate well with chemistry analyzers. Automated workflows reduce manual errors and turnaround time. Diagnostic chains invest in scalable testing platforms. Rising test volumes require efficient processing systems. Reagent manufacturers optimize kits for automation compatibility. This alignment improves laboratory efficiency. Automation adoption across hospitals and reference labs accelerates assay utilization.
Key Trends & Opportunities
Increasing Clinical Acceptance as a Complementary Glycemic Marker
Clinicians increasingly recognize glycated albumin as a complementary marker. The test provides insights beyond HbA1c limitations. Short-term glucose changes become easier to track. Endocrinologists use this assay for therapy adjustment. Growing clinical guidelines mention alternative glycemic markers. Educational initiatives raise physician awareness. This acceptance creates opportunities for broader test adoption. Diagnostic companies promote clinical evidence to support usage. Expanded clinical confidence strengthens long-term market opportunities.
- For instance, Tosoh Corporation’s GA reagent demonstrates analytical measurement within 10 minutes and requires a serum volume of 2 microliters on automated analyzers.
Product Innovation and Assay Sensitivity Improvements
Manufacturers invest in assay performance enhancement. Improved sensitivity supports early glycemic change detection. Kit stability and longer shelf life gain focus. Compact analyzer development supports smaller laboratories. Innovation reduces testing complexity and operational costs. Emerging markets benefit from simplified assay formats. Product differentiation creates competitive opportunities. Companies launch user-friendly kits for diverse settings. Continuous innovation supports market penetration and portfolio expansion.
- For instance, Abbott Laboratories’ enzymatic glycated albumin assay achieves a detection range up to 70 grams per liter and supports analyzer throughput exceeding 300 tests per hour.
Key Challenges
High Cost of Advanced Testing Platforms
High analyzer costs limit adoption in smaller facilities. Capital investment remains a key barrier. Budget-constrained laboratories delay technology upgrades. Advanced platforms require skilled operators and maintenance. Reagent pricing also affects routine testing frequency. Cost sensitivity impacts emerging and rural markets. Public healthcare systems face procurement challenges. These factors slow penetration in price-sensitive regions. Cost reduction strategies remain critical for broader adoption.
Limited Awareness in Primary Care Settings
Primary care awareness of glycated albumin remains limited. Many physicians rely solely on HbA1c testing. Lack of training restricts assay utilization. Clinical guidelines show slower adoption at grassroots levels. Diagnostic labs hesitate without consistent test demand. Educational gaps hinder early screening use cases. Awareness campaigns require time and investment. Without education, adoption remains concentrated in specialists. This limitation constrains market growth potential.
Regional Analysis
North America
North America holds a 38% market share in the glycated albumin assay market, driven by advanced diagnostic infrastructure and high diabetes prevalence. The region benefits from strong clinical awareness of alternative glycemic markers. Hospitals and diagnostic laboratories adopt glycated albumin testing for patients with renal disorders and anemia. Favorable reimbursement frameworks support test utilization. The United States leads regional demand due to large testing volumes and early technology adoption. Continuous investment in automated laboratory systems strengthens testing efficiency. Presence of major diagnostic manufacturers further supports product availability and clinical integration across healthcare settings.
Europe
Europe accounts for a 27% market share, supported by rising diabetes screening programs and strong public healthcare systems. Countries such as Germany, France, and the United Kingdom drive demand through structured disease management initiatives. Clinical adoption increases due to growing recognition of glycated albumin in complex patient populations. Research institutes contribute to steady testing volumes through clinical studies. Regulatory emphasis on standardized diagnostics supports assay quality. Hospitals increasingly integrate glycated albumin testing alongside HbA1c. Expansion of centralized diagnostic laboratories enhances access and consistency across regional healthcare networks.
Asia Pacific
Asia Pacific represents a 24% market share, driven by a rapidly growing diabetic population and expanding diagnostic capacity. Countries including China, Japan, and India contribute significantly to regional demand. Rising healthcare spending improves access to advanced laboratory testing. Urban hospitals adopt glycated albumin assays for short-term glycemic monitoring. Japan shows strong clinical acceptance due to early adoption history. Diagnostic chains expand aggressively across emerging economies. Increased awareness of diabetes complications accelerates testing uptake. Local manufacturers improve affordability, supporting broader penetration across diverse healthcare settings.
Rest of the World
Rest of the World holds an 11% market share, supported by gradual improvements in healthcare infrastructure. Latin America and the Middle East drive most regional demand. Rising diabetes incidence increases diagnostic testing needs. Private laboratories play a key role in assay adoption. Hospitals focus on high-risk patient monitoring in urban centers. Limited reimbursement coverage slows wider adoption in some regions. International diagnostic companies expand distribution networks. Government initiatives to strengthen chronic disease management gradually support market growth across developing healthcare systems.
Glycated Albumin Assay Market Segmentations:
By Product Type
- Reagents and assay kits
- Analyzers
- Consumables
By Testing Method
- Enzymatic assays
- Immunoassays
- Chromatography-based methods
By End User
- Hospitals
- Diagnostic laboratories
- Research institutes
- Specialty clinics
By Geography
- North America
- U.S.
- Canada
- Mexico
- Europe
- Germany
- France
- U.K.
- Italy
- Spain
- Rest of Europe
- Asia Pacific
- China
- Japan
- India
- South Korea
- South-east Asia
- Rest of Asia Pacific
- Latin America
- Brazil
- Argentina
- Rest of Latin America
- Middle East & Africa
- GCC Countries
- South Africa
- Rest of the Middle East and Africa
Competitive Landscape
Competitive landscape or analysis includes Roche Diagnostics, Abbott Laboratories, Siemens Healthineers, Beckman Coulter, ARKRAY, Asahi Kasei Corporation, Tosoh Corporation, Randox Laboratories, DiaSys Diagnostic Systems, and Bio-Rad Laboratories. These companies compete through assay accuracy, automation compatibility, and clinical reliability. Leading players focus on expanding reagent portfolios for routine laboratory workflows. Automation-ready kits strengthen adoption across high-volume diagnostic laboratories. Product differentiation centers on assay stability and reduced turnaround time. Companies invest in analyzer integration to support standardized testing. Strategic partnerships with hospitals improve test adoption. Geographic expansion targets emerging markets with rising diabetes prevalence. Competitive intensity remains moderate due to specialized clinical use. Continuous product upgrades sustain market positioning. Strong regulatory compliance supports brand credibility. Overall competition emphasizes quality, scalability, and long-term laboratory relationships.
Key Player Analysis
- Roche Diagnostics
- Abbott Laboratories
- Siemens Healthineers
- Beckman Coulter
- ARKRAY, Inc.
- Asahi Kasei Corporation
- Tosoh Corporation
- Randox Laboratories
- DiaSys Diagnostic Systems
- Bio-Rad Laboratories
Recent Developments
- In May 2025, Roche Diagnostics highlighted growth in its clinical testing solutions and advanced assays at Diagnostics Day. Glycated albumin testing strategy was included in broader diagnostics pipeline discussions.
- In 2025, Roche Diagnostics was featured in a market report listing key players in the glycated albumin market, showing its continued positioning in assay development.
Report Coverage
The research report offers an in-depth analysis based on Product Type, Testing Method, End User and Geography. It details leading market players, providing an overview of their business, product offerings, investments, revenue streams, and key applications. Additionally, the report includes insights into the competitive environment, SWOT analysis, current market trends, as well as the primary drivers and constraints. Furthermore, it discusses various factors that have driven market expansion in recent years. The report also explores market dynamics, regulatory scenarios, and technological advancements that are shaping the industry. It assesses the impact of external factors and global economic changes on market growth. Lastly, it provides strategic recommendations for new entrants and established companies to navigate the complexities of the market.
Future Outlook
- Clinical adoption will increase as awareness of short-term glycemic markers improves.
- Diagnostic laboratories will expand glycated albumin testing within routine diabetes panels.
- Automation integration will remain a priority across high-volume laboratories.
- Product innovation will focus on improved assay stability and sensitivity.
- Demand will rise in renal and anemia patient management settings.
- Emerging markets will show stronger adoption with improving healthcare access.
- Diagnostic companies will strengthen distribution networks globally.
- Physician education will support broader clinical acceptance of the assay.
- Regulatory standardization will enhance test reliability and consistency.
- Long-term monitoring applications will support sustained market growth.

Request a Free Sample
Fill in your details and we'll send you a free sample report.
- Sample data tables & charts
- Research methodology
Market Dynamics
Rising Prevalence of Diabetes and Pre-Diabetes
The global increase in diabetes and pre-diabetes cases is driving demand for glycated albumin assays, as clinicians seek tools for short-term glycemic assessment and early diagnosis. This is especially important for monitoring patients with unstable glucose levels, supporting steady growth in diagnostic testing volumes.
Growing Adoption in Renal and Anemic Patient Management
Glycated albumin assays are increasingly used for patients with kidney disease or anemia, where traditional HbA1c tests are less reliable. Their clinical relevance in these populations is expanding adoption in hospitals and nephrology settings, contributing significantly to market expansion.
Expansion of Automated and Standardized Laboratory Testing
The integration of glycated albumin assays with automated chemistry analyzers and standardized laboratory workflows is boosting market growth. Automation reduces manual errors, increases throughput, and supports the needs of high-volume diagnostic laboratories.
Increasing Clinical Acceptance as a Complementary Glycemic Marker
Physicians and endocrinologists are recognizing the value of glycated albumin as a complementary marker to HbA1c, especially for tracking short-term glucose fluctuations. Growing inclusion in clinical guidelines and educational initiatives is broadening its adoption.
Product Innovation and Assay Sensitivity Improvements
Manufacturers are investing in assay sensitivity, stability, and user-friendly formats, making glycated albumin testing more accessible and reliable. These innovations support adoption in both advanced and emerging healthcare settings, driving further market penetration.
Need a Custom Version of This Report?
Tailor the scope, geography, or segments to your exact requirements.
- Custom geography or segment scope
- Direct access to our analyst team
Frequently Asked Questions
What is the current market size for the Glycated Albumin Assay market, and what is its projected size in 2032?
At what Compound Annual Growth Rate is the Glycated Albumin Assay market projected to grow between 2024 and 2032?
Which Glycated Albumin Assay market segment held the largest share in 2024?
What are the primary factors fueling the growth of the Glycated Albumin Assay market?
Who are the leading companies in the Glycated Albumin Assay market?
Which region commanded the largest share of the Glycated Albumin Assay market in 2024?
Table of Content
Chapter 1 Market Segmentation
- 1.1 Segmentation Framework
- 1.1.1 Product and Service Classification
- 1.1.2 Application and End-Use Classification
- 1.1.3 Technology and Solution Classification
- 1.1.4 Customer and Distribution Channel Classification
- 1.1.5 Geographic Segmentation
- 1.1.6 Market Segment Definitions and Boundaries
- 1.2 By End User
- 1.2.1 Hospitals
- 1.2.2 Diagnostic laboratories
- 1.2.3 Research institutes
- 1.2.4 Specialty clinics
- 1.3 By Product Type
- 1.3.1 Reagents and assay kits
- 1.3.2 Analyzers
- 1.3.3 Consumables
- 1.4 By Testing Method
- 1.4.1 Enzymatic assays
- 1.4.2 Immunoassays
- 1.4.3 Chromatography-based methods
Chapter 2 Introduction
- 2.1 Report Objectives and Scope
- 2.2 Product Definition and Industry Terminology
- 2.3 Market Inclusions and Exclusions
- 2.4 Research Process
- 2.4.1 Primary Research and Expert Interviews
- 2.4.2 Secondary Research and Source Review
- 2.4.3 Top-Down and Bottom-Up Estimation
- 2.4.4 Data Triangulation and Verification
- 2.5 Market Size Measurement Basis
- 2.5.1 2024: USD 613 million → 2032: USD 1,135.21 million
- 2.6 Historical and Forecast Reference Periods
- 2.6.1 Base Year: 2024
- 2.6.2 Forecast Period: 2024-2032
- 2.7 Research Assumptions and Limitations
Chapter 3 Executive Summary
- 3.1 Market Snapshot and Key Findings
- 3.2 Base-Year Market Size, 2024
- 3.3 Forecast Market Size, 2032
- 3.4 Revenue and Volume Growth Outlook
- 3.5 Key Demand and Supply Indicators
- 3.6 Leading Market Segments
- 3.7 Fastest-Growing Market Opportunities
- 3.8 Regional Performance Highlights
- 3.9 Technology and Industry Transformation
- 3.10 Competitive Landscape Summary
- 3.11 Analyst View and Strategic Implications
Chapter 4 Global Glycated Albumin Assay Market Trends and Developments
- 4.1 Historical Industry Development
- 4.2 Recent Market Trends and Developments
- 4.3 Demand and Customer Behavior Trends
- 4.4 Technology and Product Innovation
- 4.5 Artificial Intelligence, Automation and Digitalization
- 4.6 Local Manufacturing and Supply Chain Realignment
- 4.7 Industry Partnerships, Mergers and Acquisitions
- 4.8 Sustainability and Circular Economy Developments
- 4.9 Government and Private Sector Investment Trends
- 4.10 Emerging Business Models and Commercialization
- 4.11 Industry Developments and Announcements
Chapter 5 Global Glycated Albumin Assay Market Production, Supply and Demand Analysis
- 5.1 Demand Trend and Consumption Analysis
- 5.2 Demand Forecast, 2024-2032
- 5.3 Production and Output Trend
- 5.4 Production and Output Forecast, 2024-2032
- 5.5 Installed Capacity and Capacity Utilization
- 5.6 Company-Wise Production Plants and Statistics
- 5.6.1 Installed Production Capacity
- 5.6.2 Actual Production
- 5.6.3 Planned Capacity and Expansion Targets
- 5.7 Supply Chain Structure and Procurement Trends
- 5.8 Supply-Demand Gap and Bottlenecks
- 5.9 Import Dependence and Sourcing Structure
- 5.10 Contract Manufacturing and Outsourcing
- 5.11 Regional Supply and Demand Concentration
Chapter 6 Global Glycated Albumin Assay Market Pricing Analysis
- 6.1 Pricing Structure and Measurement
- 6.2 Historical Pricing Trends
- 6.3 Pricing Outlook, 2024-2032
- 6.4 Average Selling Price and Unit Economics
- 6.5 Pricing by Product and Market Segment
- 6.6 Geographic Pricing Differences
- 6.7 Key Input, Energy, Labor and Logistics Costs
- 6.8 Contract Pricing and Purchasing Models
- 6.9 Pricing Sensitivity and Competitive Positioning
- 6.10 Price, Margin and Profitability Implications
Chapter 7 Global Glycated Albumin Assay Market Dynamics
- 7.1 Market Growth Drivers
- 7.1.1 Demand-Side Drivers
- 7.1.2 Technology and Innovation Drivers
- 7.1.3 Infrastructure and Investment Drivers
- 7.1.4 Regulatory and Policy Drivers
- 7.2 Market Restraints
- 7.2.1 Cost and Affordability Constraints
- 7.2.2 Technology and Adoption Barriers
- 7.2.3 Supply Chain and Operational Constraints
- 7.3 Market Challenges
- 7.3.1 Competitive Pressure and Margin Erosion
- 7.3.2 Skills, Infrastructure and Implementation Gaps
- 7.4 Emerging Market Opportunities
- 7.5 Market Dynamics Impact and Time-Horizon Assessment
Chapter 8 Global Glycated Albumin Assay Value Chain Analysis
- 8.1 Industry Value Chain Overview
- 8.2 Upstream Suppliers and Critical Inputs
- 8.3 Technology and Component Providers
- 8.4 Manufacturing or Service Delivery
- 8.5 Distribution, Channel Partners and Integrators
- 8.6 Downstream Applications and End Users
- 8.7 Value Addition and Profit Pools
- 8.8 Vertical Integration and Outsourcing
- 8.9 Supplier Concentration and Risk
- 8.10 Supply Chain Localization and Resilience
Chapter 9 Global Glycated Albumin Assay Market Regulations and Policies
- 9.1 Relevant Laws, Standards and Compliance Frameworks
- 9.2 Product, Service, Safety and Quality Requirements
- 9.3 Government Policies, Incentives and Subsidies
- 9.4 Imports, Exports and Trade Barriers
- 9.5 Public Procurement and Local Content Requirements
- 9.6 Environmental and Sustainability Compliance
- 9.7 Upcoming Policy Changes and Market Implications
Chapter 10 Global Glycated Albumin Assay Market Hotspots and Opportunities
- 10.1 Market Opportunity Mapping and Growth Hotspots
- 10.2 High-Growth Applications and Customer Groups
- 10.3 Underserved Markets and White-Space Opportunities
- 10.4 Emerging Technology and Product Opportunities
- 10.5 New Capacity and Investment Hotspots
- 10.6 Market Entry and Expansion Opportunities
- 10.7 Distribution and Partnership Opportunities
- 10.8 Near-Term and Long-Term Commercial Potential
- 10.9 Opportunity Attractiveness and Execution Risks
Chapter 11 Global Glycated Albumin Assay Market Outlook, 2024-2032
- 11.1 Market Size and Analysis
- 11.1.1 Revenue (Market Measurement: 2024: USD 613 million → 2032: USD 1,135.21 million)
- 11.1.2 Market Volume and Quantity Sold
- 11.1.3 Historical Market Size
- 11.1.4 Base-Year Market Size, 2024
- 11.2 Market Forecast, 2024-2032
- 11.2.1 Revenue Forecast to 2032
- 11.2.2 Volume Forecast to 2032
- 11.2.3 CAGR and Year-on-Year Growth
- 11.2.4 Incremental Revenue Opportunity
- 11.3 Forecast Assumptions and Scenario Analysis
- 11.3.1 Base-Case Forecast
- 11.3.2 Optimistic and Conservative Scenarios
- 11.3.3 Technology, Pricing and Policy Sensitivities
- 11.4 Market Attractiveness and Growth Outlook
Chapter 12 Global Glycated Albumin Assay Market Segmentation and Outlook
- 12.1 Segmentation Summary and Market Shares, 2024
- 12.2 Largest and Fastest-Growing Segments
- 12.3 By End User - Market Size and Forecast, 2024-2032
- 12.3.1 Segment Definition and Scope
- 12.3.2 Historical Market Size
- 12.3.3 Revenue Forecast, 2024-2032
- 12.3.4 Volume Forecast, 2024-2032
- 12.3.5 Base-Year Market Share, 2024
- 12.3.6 Segment CAGR and Growth Drivers
- 12.3.7 Subsegment Market Size and Forecast
- 12.3.7.1 Hospitals
- 12.3.7.2 Diagnostic laboratories
- 12.3.7.3 Research institutes
- 12.3.7.4 Specialty clinics
- 12.3.8 Subsegment Pricing and Adoption Trends
- 12.3.9 Leading Suppliers and Competition
- 12.3.10 Regional Demand and Opportunities
- 12.4 By Product Type - Market Size and Forecast, 2024-2032
- 12.4.1 Segment Definition and Scope
- 12.4.2 Historical Market Size
- 12.4.3 Revenue Forecast, 2024-2032
- 12.4.4 Volume Forecast, 2024-2032
- 12.4.5 Base-Year Market Share, 2024
- 12.4.6 Segment CAGR and Growth Drivers
- 12.4.7 Subsegment Market Size and Forecast
- 12.4.7.1 Reagents and assay kits
- 12.4.7.2 Analyzers
- 12.4.7.3 Consumables
- 12.4.8 Subsegment Pricing and Adoption Trends
- 12.4.9 Leading Suppliers and Competition
- 12.4.10 Regional Demand and Opportunities
- 12.5 By Testing Method - Market Size and Forecast, 2024-2032
- 12.5.1 Segment Definition and Scope
- 12.5.2 Historical Market Size
- 12.5.3 Revenue Forecast, 2024-2032
- 12.5.4 Volume Forecast, 2024-2032
- 12.5.5 Base-Year Market Share, 2024
- 12.5.6 Segment CAGR and Growth Drivers
- 12.5.7 Subsegment Market Size and Forecast
- 12.5.7.1 Enzymatic assays
- 12.5.7.2 Immunoassays
- 12.5.7.3 Chromatography-based methods
- 12.5.8 Subsegment Pricing and Adoption Trends
- 12.5.9 Leading Suppliers and Competition
- 12.5.10 Regional Demand and Opportunities
- 12.6 Segment Growth Comparison
- 12.7 Segment Attractiveness and Priority Matrix
Chapter 13 Global Glycated Albumin Assay End-Use and Application Market Outlook
- 13.1 End-Use Industry and Customer Demand Structure
- 13.2 Leading Applications and Customer Groups
- 13.3 End-Use Market Size, Share and Forecast
- 13.4 Major End-Use Industry Deep Dives
- 13.4.1 Customer Requirements and Use Cases
- 13.4.2 Demand and Replacement Cycles
- 13.4.3 Technical and Regulatory Considerations
- 13.4.4 Purchasing and Procurement Models
- 13.4.5 Leading Vendors and Distribution Channels
- 13.4.6 Forecast and Commercial Opportunities
- 13.5 Emerging Applications and Cross-Segment Demand
- 13.6 End-Use Industry Investment Priorities
Chapter 14 Global Glycated Albumin Assay Geographic Market Outlook, 2024-2032
- 14.1 Regional Market Size and Share, 2024
- 14.2 Regional Market Forecast, 2024-2032
- 14.3 Regional Pricing, Production and Demand Differences
- 14.4 North America
- 14.4.1 United States
- 14.4.2 Canada
- 14.4.3 Mexico
- 14.5 Europe
- 14.5.1 Germany
- 14.5.2 France
- 14.5.3 Italy
- 14.5.4 United Kingdom
- 14.5.5 Spain
- 14.5.6 Poland
- 14.5.7 Russia
- 14.5.8 Netherlands
- 14.5.9 Belgium
- 14.5.10 Sweden
- 14.5.11 Denmark
- 14.5.12 Norway
- 14.5.13 Rest of Europe
- 14.6 Asia Pacific
- 14.6.1 China
- 14.6.2 India
- 14.6.3 Japan
- 14.6.4 South Korea
- 14.6.5 Thailand
- 14.6.6 Indonesia
- 14.6.7 Vietnam
- 14.6.8 Malaysia
- 14.6.9 Australia
- 14.6.10 Rest of Asia Pacific
- 14.7 Latin America
- 14.7.1 Brazil
- 14.7.2 Argentina
- 14.7.3 Colombia
- 14.7.4 Chile
- 14.7.5 Rest of Latin America
- 14.8 Middle East
- 14.8.1 Saudi Arabia
- 14.8.2 United Arab Emirates
- 14.8.3 Turkey
- 14.8.4 Israel
- 14.8.5 Iran
- 14.8.6 Rest of the Middle East
- 14.9 Africa
- 14.9.1 South Africa
- 14.9.2 Egypt
- 14.9.3 Nigeria
- 14.9.4 Morocco
- 14.9.5 Rest of Africa
- 14.10 Regional Investment, Policy and Supply Chain Differences
- 14.11 Regional Competitive Landscape
- 14.12 Geographic Growth Hotspots
Chapter 15 Global Glycated Albumin Assay Technology, Innovation and Sustainability Outlook
- 15.1 Technology Landscape and Maturity
- 15.2 Product, Process and Service Innovation
- 15.3 AI, Automation and Digital Tools in the Industry
- 15.4 Technology Adoption and Performance Benchmarking
- 15.5 Innovation Pipeline and R&D Investment
- 15.6 Patent and Intellectual Property Trends
- 15.7 Energy Efficiency and Resource Management
- 15.8 Sustainability, Recycling and Circularity
- 15.9 Technology Roadmap, 2024-2032
- 15.10 Risks of Obsolescence and Technology Substitution
Chapter 16 Global Glycated Albumin Assay Market Key Strategic Imperatives
- 16.1 Growth and Market Entry Priorities
- 16.2 High-Return Products and Segments
- 16.3 Pricing, Profitability and Cost Optimization
- 16.4 Technology Investment and Product Differentiation
- 16.5 Supply Chain Localization and Resilience
- 16.6 Distribution and Customer Acquisition
- 16.7 Partnership, Acquisition and Capacity Strategy
- 16.8 Regional Expansion Priorities
- 16.9 Short-, Medium- and Long-Term Actions
Chapter 17 Competition Outlook
- 17.1 Industry Competition Characteristics
- 17.2 Market Structure and Concentration
- 17.3 Market Share and Competitive Positioning, 2024
- 17.4 Company-Wise Revenue and Product Benchmarking
- 17.5 Production and Service Capacity Benchmarking
- 17.6 Technology, Pricing and Differentiation
- 17.7 Regional Footprint and Distribution Strength
- 17.8 Mergers, Acquisitions and Strategic Alliances
- 17.9 New Entrants and Competitive Threats
- 17.10 Porter's Five Forces and Industry Attractiveness
- 17.11 Competitive Outlook, 2024-2032
Chapter 18 Company Profiles
- 18.1 Company Coverage and Selection Criteria
- 18.2 Roche Diagnostics
- 18.2.1 Business Description
- 18.2.2 Company Ownership and Geographic Presence
- 18.2.3 Product and Service Portfolio
- 18.2.4 Manufacturing and Operating Footprint
- 18.2.5 Production Capacity and Expansion Plans
- 18.2.6 Financial Performance and Investment
- 18.2.7 Market Share and Competitive Position
- 18.2.8 Technology and Innovation Capabilities
- 18.2.9 Strategic Alliances or Partnerships
- 18.2.10 Recent Developments
- 18.2.11 Growth Strategy and Outlook
- 18.3 Abbott Laboratories
- 18.4 Siemens Healthineers
- 18.5 Beckman Coulter
- 18.6 ARKRAY, Inc.
- 18.7 Asahi Kasei Corporation
- 18.8 Tosoh Corporation
- 18.9 Randox Laboratories
- 18.10 DiaSys Diagnostic Systems
- 18.11 Bio-Rad Laboratories
- 18.12 Other Relevant Market Participants
Note: Every listed company is profiled on the structure shown under the first company. The company list is preliminary and may change based on research findings, market developments, data availability and client requirements.
Chapter 19 Disclaimer
- 19.1 Research and Forecast Disclaimer
- 19.2 Data Source and Estimation Limitations
Note: The depth of individual sections depends on data availability for this market. Volume, capacity, trade and other unit-based metrics are included where applicable.

