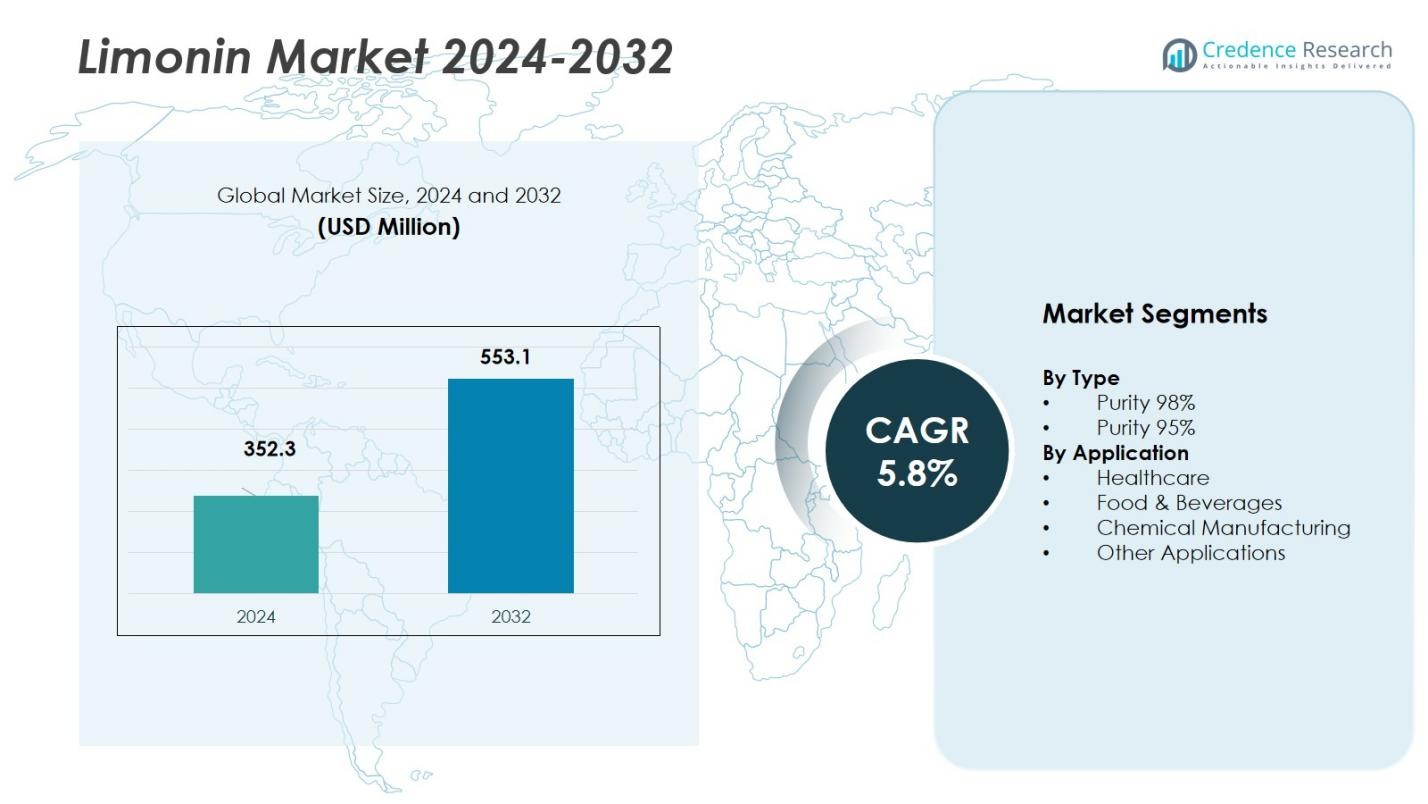
Chemical
Home » Limonin Market

Limonin Market

Limonin Market By Application (Pharmaceuticals, Food and Beverages, Cosmetics, Dietary Supplements, Agriculture, Flavoring Agent) By Type (High Purity Limonin (e.g., 98% Purity), Standard Purity Limonin, Other Purity Grades, Natural Limonin Extracts) – Growth, Future Prospects & Competitive Analysis, 2016 – 2030
Report Book

Published Date: Sep 2023
Category: Chemicals
Report ID: 62095
Report Format: PDF
No of Pages: 228

Rating: Credence Reports

Market Insights

  • The Limonin market is positioned for significant growth, with a consistent Compound Annual Growth Rate (CAGR) of 3.32% from 2023 to 2030.
  • This growth trajectory is expected to lead to a substantial increase in revenue, with the market value anticipated to rise from USD 431.86 million in 2022 to USD 542.87 million in 2030.
  • North America dominates Limonin, contributing to over 35% of the market share. This region’s strong foothold is attributed to its early adoption of health-conscious trends and natural ingredients.
  • The 98% purity segment is expected to lead the market’s growth. Limonin with higher purity levels is valued for its effectiveness and suitability for various applications.
  • The healthcare and pharmaceuticals industry emerges as the largest consumer of Limonin, primarily due to its medicinal and therapeutic properties. This sector’s demand for natural ingredients has driven the adoption of Limonin in pharmaceutical research.
  • The organic segment within the Limonin market is likely to experience rapid growth. Increasing consumer preference for organic products has boosted the demand for organic Limonin as an ingredient in various industries.
  • Several key drivers fuel the growth of the Limonin market, including the growing health awareness among consumers, the rising demand for natural ingredients, the expansion of the functional food and beverage industry, and ongoing pharmaceutical research incorporating Limonin.
  • The market faces challenges such as regulatory hurdles, limited research in some areas, seasonal variability in production, and a competitive landscape with multiple players.
  • Opportunities in the Limonin market include expanding into the natural cosmetics sector, capitalizing on the demand for functional beverages, investing in research and development to explore new applications, and fostering collaboration between industries, such as food and pharmaceuticals, driving innovative product developments.

Limonin market

Executive Summary

The Limonin market is growing, driven by increased health awareness, demand for natural ingredients, and expanding applications across industries. However, it faces challenges regarding regulations, limited research, and competition. Opportunities exist in the natural cosmetics and functional beverage sectors, research and development, and industry collaborations.

Market Definition

Limonin is a natural compound found in citrus fruits, known for its various health benefits and applications across industries. It is widely used in the pharmaceutical, food and beverage, and cosmetics sectors.

Market Overview

The Limonin market is positioned for substantial growth, underpinned by a consistent Compound Annual Growth Rate (CAGR) of 3.32% projected from 2023 to 2030. This anticipated growth is expected to result in a notable increase in market revenue, ascending from USD 431.86 million in 2022 to USD 542.87 million by 2030.

One of the key drivers of this growth is the increasing consumer preference for natural ingredients and a heightened awareness of health-conscious choices. Limonin, a natural compound found in citrus fruits, aligns perfectly with this trend due to its various health benefits and versatile applications.

The Limonin market is characterized by its multi-faceted applications spanning several industries. It is sought after in the healthcare and pharmaceutical sectors due to its medicinal properties and potential therapeutic applications. Pharmaceutical research endeavors have further fueled the adoption of Limonin as a valuable ingredient.

Moreover, the food and beverage industry has embraced Limonin as a natural ingredient, especially in producing functional foods and beverages. Consumers’ increasing demand for health-enhancing products drives this market segment’s growth.

In terms of purity, Limonin, with 98% purity, is expected to lead the market’s growth. This high level of purity enhances the effectiveness and suitability of Limonin for various applications, attracting industries seeking premium-quality ingredients.

Regionally, North America currently dominates the Limonin market, contributing over 35% of the market share. This dominance can be attributed to the region’s early adoption of health-conscious trends and the incorporating of natural ingredients into various products.

Limonin market Competitive Scenario

Market Segmentation

Segmentation by Application

  • Limonin is crucial to the pharmaceutical industry due to its medicinal properties. It is utilized in drug formulation and research for its potential therapeutic applications, including its antioxidant and anti-inflammatory properties.
  • Limonin has gained significant traction in the food and beverage sector. It is used as a natural ingredient in producing functional foods and beverages. Limonin’s presence in these products enhances their health appeal and nutritional value.
  • The cosmetics industry has embraced Limonin for its natural properties. It is incorporated into various skincare and beauty products, such as creams, lotions, and serums. Limonin’s antioxidant and anti-aging properties make it a sought-after ingredient in cosmetics.
  • Limonin is a valuable component in dietary supplements due to its potential health benefits. It is included in supplements to promote overall well-being and specific health outcomes.
  • In agriculture, Limonin is sometimes used as a natural insecticide. Its repellent properties make it an environmentally friendly choice for pest control in crop cultivation.
  • Limonin’s natural citrusy flavor makes it suitable for use as a flavoring agent in various food and beverage products. Its addition enhances the taste profile of these items.
  • Limonin’s unique properties make it a subject of interest in biomedical research. Researchers explore its potential applications in various health-related studies, contributing to advancements in healthcare.
  • Some natural cleaning products utilize Limonin for its cleaning and degreasing properties. It serves as an eco-friendly alternative to traditional cleaning agents.
  • Limonin’s versatility extends to other applications, including its use in creating natural and organic personal care products, household cleaners, and more. Its diverse range of potential uses continues to drive innovation and exploration in various industries.

Segmentation by Type

  • Purity Limonin, such as the 98% purity segment, is a frontrunner in market growth. This grade of Limonin is highly sought after due to its exceptional purity, which enhances its effectiveness and versatility. It finds applications across various industries, including pharmaceuticals, food and beverages, cosmetics, etc.
  • Standard purity Limonin, typically with purity levels below 98%, also contributes significantly to the market. While it may not be as concentrated as high purity Limonin, it remains valuable for various applications, especially in sectors where extremely high purity is not required.
  • Limonin is available in various purity grades to cater to specific industry needs. These purity grades may range from lower to higher concentrations, offering manufacturers and product developers flexibility.
  • Some applications prefer natural Limonin extracts from citrus fruits. These extracts may contain a combination of compounds, including Limonin, and are valued for their natural sourcing.
  • In certain cases, synthetic Limonin may be used, especially when precise control over purity and composition is required. Synthetic Limonin can be tailored to meet specific industry and product specifications.
  • Blended Limonin products combine Limonin with other natural or synthetic ingredients to create specialized formulations. These blends are designed to address specific application requirements or enhance certain properties.
  • Some industries may require customized solutions with unique purity levels and compositions. Manufacturers can work closely with customers to develop tailored Limonin products to meet specific needs.

Segmentation by End-Users

  • The healthcare and pharmaceuticals industry is the largest consumer of Limonin. Its medicinal and therapeutic properties make Limonin a valuable ingredient in formulating pharmaceutical products, dietary supplements, and herbal remedies. Limonin is used in various medications and health-related formulations due to its potential health benefits.
  • The food and beverage industry is another significant consumer of Limonin. Limonin is employed as a natural ingredient in food products and functional beverages. Its natural sourcing and potential health advantages align with the growing demand for natural and health-conscious food options.
  • Limonin finds applications in cosmetics and personal care due to its potential skin-related benefits and natural properties. It can be used in skincare products, such as creams, lotions, and serums, for its antioxidant and skin-soothing properties.
  • Manufacturers specializing in natural cosmetics often incorporate Limonin into their product lines. Limonin’s natural sourcing fits well with the ethos of natural and organic cosmetic brands. It can be used as a natural ingredient in various skincare and haircare products.
  • Limonin is a sought-after component in nutraceuticals and dietary supplements due to its potential health-promoting properties. It is used to produce dietary capsules, tablets, and powders to enhance overall health and well-being.
  • Limonin may find applications in other industries, depending on specific needs and innovative uses. These industries could include research and development, where Limonin may serve as a reagent, or niche sectors exploring unique applications of this compound.

Segmentation by Region

  • North America is the dominant region in the Limonin market, accounting for over 35% of the market share in 2022. The region’s leadership is attributed to a well-established healthcare and pharmaceutical industry, a growing health-conscious population, and a robust demand for natural ingredients.
  • Europe is a significant player in the Limonin market, with expectations of substantial growth. The region contributes around 25% of the global market share. The European market’s growth is fueled by increasing health awareness, a burgeoning natural cosmetics industry, and a growing preference for natural and organic products.
  • The Asia Pacific region showcases promising growth potential in the Limonin market. Rising investments in research and development, coupled with a strong demand for natural ingredients, are driving market expansion in this region. Asia Pacific is expected to witness above-average Compound Annual Growth Rates (CAGR) above 13.5%.
  • Latin America holds a share of approximately 3.80% in the Limonin market. While the share may be relatively small compared to other regions, Latin America is experiencing increased interest in natural ingredients, which may contribute to market growth.
  • The Middle East and Africa region are also part of the Limonin market landscape. It is characterized by a CAGR of 7.5%, indicating moderate growth. Expanding healthcare and wellness industries in this region will likely drive the demand for Limonin.

Limonin market Regional analysis

The Limonin market is strategically segmented by region, reflecting the diverse global landscape of its consumption. North America dominates this landscape with a significant market share of over 35%, attributed to the region’s well-established healthcare and pharmaceutical industries. In 2022, North America played a pivotal role in shaping the market’s dynamics, and it is expected to continue leading in terms of market share and growth throughout the forecast period.

On the other hand, Europe contributes around 25% of the global market share, boasting a stable Compound Annual Growth Rate (CAGR) of around 3%. The region is poised for steady growth due to increasing health awareness and a burgeoning natural cosmetics industry. Europe’s demand for natural and organic products continues to drive market expansion.

Asia Pacific is a region that showcases tremendous growth potential in the Limonin market, thanks to rising investments in research and development and a growing preference for natural ingredients. The region is expected to experience a robust CAGR above 4%, making it a significant player in the market’s future landscape.

Latin America plays a modest yet noteworthy role, contributing approximately 3.5% of the market share. While the share may be relatively small compared to other regions, Latin America is witnessing an upsurge in interest regarding natural ingredients, which may contribute to market growth in the coming years.

The Middle East and Africa region also participate in the Limonin market, with a CAGR of 1.2%, indicating moderate growth. The expansion of healthcare and wellness industries in this region is expected to drive the demand for Limonin-based products.

The Limonin market’s regional segmentation highlights North America’s dominance with Europe, Asia Pacific, Latin America, the Middle East, and Africa, all playing crucial roles in shaping the market’s dynamics. While North America leads in share, Europe and Asia Pacific are expected to grow significantly, reflecting the global shift towards natural and health-conscious products.

Key Highlights of the Report

North America emerged as the dominant player in the Limonin market in 2022, commanding over 35% of the market share. This can be attributed to the region’s robust demand and consumption of Limonin. The 98% Purity segment is set to lead market growth. High-purity Limonin is in demand due to its effectiveness and various industry applications.

The healthcare and pharmaceuticals industry stands as the largest consumer of Limonin. Its natural properties make it a valuable ingredient for various medicinal and therapeutic purposes. The organic segment of the Limonin market is poised for rapid growth. Increasing consumer preference for organic and natural products drives demand for organic Limonin.

What Are the Main Drivers of the Limonin Market?

The main drivers of the Limonin Market include the growing health awareness, natural ingredient demand, rising functional food and beverage industry, and pharmaceutical research.

What Are The Major Challenges Faced By the Limonin Market?

The Limonin Market’s major challenges include regulatory, limited research, seasonal variability, and the competitive market.

What Are The Growth Opportunities In the Limonin Market?

The growth opportunities in the Limonin Market include the expanding natural cosmetics market, functional beverages, research and development, and industry collaboration.

Market Drivers

Several factors drive the Limonin market. The following are the key drivers of the Limonin market:

Growing Health Awareness:

The Limonin market is benefiting from a global surge in health consciousness. Consumers are increasingly recognizing the potential health benefits associated with Limonin consumption. Limonin, derived from citrus fruits, is emerging as a favored choice as they seek natural alternatives to synthetic additives and preservatives.

Its reputation as a natural compound with various potential health benefits, such as antioxidant properties and potential cancer-fighting capabilities, aligns perfectly with the growing preference for healthier dietary choices. This heightened health awareness is a pivotal driver propelling the demand for Limonin across various industries, including food, pharmaceuticals, and cosmetics.

Natural Ingredient Demand:

The market’s growth is intricately tied to the broader consumer demand for natural ingredients. Limonin, sourced from citrus fruits like lemons and oranges, aligns seamlessly with this trend. Consumers seek products with fewer synthetic chemicals and additives in food, beverages, cosmetics, or pharmaceuticals.

The natural and organic movement is reshaping consumer preferences, leading to a surge in Limonin’s popularity as an ingredient known for its organic and naturally derived characteristics. This demand for purity and authenticity in products is a key driving force behind the increasing adoption of Limonin.

Rising Functional Food and Beverage Industry:

The functional food and beverage industry is experiencing rapid growth, and Limonin is playing a pivotal role in this expansion. Manufacturers are increasingly incorporating Limonin into their product formulations to enhance the health appeal of their offerings. Limonin’s potential health benefits, including its role as an antioxidant and ability to support various aspects of well-being, make it a valuable addition to functional food and beverage products.

This trend fosters the creation of new Limonin-infused products and drives consumer interest and consumption. As the functional food and beverage industry continues to innovate, Limonin is expected to maintain its position as a sought-after natural ingredient.

Pharmaceutical Research:

Ongoing research in the pharmaceutical industry is shedding light on the medicinal potential of Limonin. This factor is bolstering the demand for Limonin in the healthcare sector. Researchers are exploring its applications in various medical contexts, including its possible role in cancer prevention and treatment.

As scientific evidence supporting these health benefits accumulates, pharmaceutical companies are keenly interested in incorporating Limonin into their drug development efforts. The promising results from this research are opening new avenues for Limonin’s utilization in pharmaceutical products, further driving its market growth.

Market Restraints

The Limonin market faces some challenges that may hinder its growth. These include the following:

Regulatory Challenges:

Regulatory challenges pose a significant restraint to the Limonin market’s growth. Adherence to stringent standards and regulations is paramount, especially in industries like pharmaceuticals, food, and cosmetics, where Limonin is widely used. Achieving compliance with these standards can be a complex and time-consuming process.

Regulatory bodies often require thorough documentation, quality control, and safety assessments. Navigating this intricate regulatory landscape can strain resources and slow market entry for new and existing players. Additionally, regulation changes or the introduction new requirements can further add to the compliance burden, potentially affecting market dynamics.

Limited Research:

While Limonin exhibits considerable potential, limited research on its properties and applications can hinder its market expansion. Comprehensive scientific studies are essential to understand Limonin’s capabilities and uncover new uses fully. More robust research is needed to ensure innovation in product development, potentially leaving valuable applications untapped.

To overcome this challenge, investment in research and development is crucial. Research institutions, academic organizations, and industry players need to collaborate to expand the body of knowledge surrounding Limonin. This, in turn, can drive innovation and open up new market opportunities.

Seasonal Variability:

The supply of Limonin is subject to seasonal fluctuations, which can disrupt the market’s supply chain and affect pricing dynamics. Limonin is primarily sourced from citrus fruits like lemons and oranges, which have distinct growing seasons. During periods of peak production, the supply of Limonin may exceed demand, leading to lower prices.

Conversely, in off-seasons, scarcity can drive prices higher. This seasonality can pose challenges for manufacturers and product developers relying on a stable Limonin supply. Strategies such as storage, preservation, or diversification of sources may be necessary to mitigate the impact of seasonal variability.

Competitive Market:

The Limonin market is fiercely competitive, with numerous players vying for market share. This competitive landscape can exert pressure on pricing and profit margins. Companies must continually innovate and differentiate their Limonin-based products to maintain a competitive edge. Additionally, competition can lead to aggressive marketing strategies, further intensifying rivalry within the market.

Establishing a foothold in this competitive environment can be challenging for new entrants, requiring substantial investments in marketing, research, and product development. As a result, the competitive nature of the Limonin market can present hurdles for both existing and prospective market participants.

Market Opportunities

The Limonin market offers significant growth opportunities. These include the following:

Expanding Natural Cosmetics Market:

The natural cosmetics market is experiencing remarkable growth driven by increasing consumer awareness of the benefits of natural ingredients for skincare and beauty products. With its well-documented skin-friendly properties, Limonin is poised to capitalize on this trend. It can be incorporated into various cosmetic formulations, including creams, lotions, and serums, to offer consumers a natural alternative for maintaining healthy and radiant skin.

Limonin’s antioxidant and antimicrobial properties make it a desirable ingredient for cosmetics that combat skin aging and imperfections. Manufacturers in the natural cosmetics sector have a unique opportunity to tap into the growing demand for Limonin-infused products, providing consumers with effective and natural skincare solutions.

Functional Beverages:

The global trend toward health and wellness is fueling the demand for functional beverages fortified with ingredients like Limonin. Consumers seek beverages that quench their thirst and provide health benefits. Limonin’s association with various health advantages, such as its potential to support digestion and promote overall well-being, positions it as an attractive option for functional beverage manufacturers.

These beverages can range from detoxifying juices to energy drinks, where Limonin can enhance the nutritional profile and appeal to health-conscious consumers. With consumers increasingly making mindful choices about their beverage consumption, the functional beverage segment offers substantial growth potential for Limonin.

Research and Development:

Investment in research and development is pivotal for unlocking the full potential of Limonin. Although its health benefits and applications are well-recognized, ongoing research can reveal new and innovative uses. Researchers can delve deeper into understanding the mechanisms of action of Limonin, explore its synergistic effects with other compounds, and identify novel applications across industries.

By supporting research initiatives, stakeholders in the Limonin market can stay at the forefront of innovation and remain responsive to evolving consumer demands. This can lead to the development novel Limonin-based products with enhanced functionality and broader market appeal.

Collaboration between Industries:

Collaborations between industries, particularly the food and pharmaceutical sectors, hold immense promise for expanding the Limonin market’s reach and versatility. Cross-industry partnerships can foster innovative product developments that leverage Limonin’s unique properties. For example, combining Limonin with specific nutrients in functional foods or dietary supplements can create synergistic health benefits.

Similarly, collaborative efforts can lead to the development of novel pharmaceutical formulations that incorporate Limonin for therapeutic purposes. These collaborations diversify Limonin’s applications and create opportunities for joint marketing and distribution efforts. By breaking down traditional industry boundaries, such partnerships can drive growth and broaden the scope of the Limonin market.

Competitive Landscape

Key Players

The Limonin market is highly competitive, with several key players. Some of the major players in the market and their market share are as follows:

  • Chemodex Ltd
  • Cayman Chemical
  • Carbosynth
  • ChemScene, LLC
  • ALB Technology
  • Toronto Research Chemicals
  • Sabinsa Corporation
  • Indena S.p.A
  • Martin Bauer Group
  • TCI America
  • Naturex
  • Atkin Chemical Inc.
  • Changsa Natural-ex Inc.
  • Others

Key players in the Limonin market include companies involved in the production, distribution, and research of Limonin. Collaborative efforts between industry players can drive innovation and product development in this competitive market.

Recent Development

The ongoing evolution of operations and technological innovations has resulted in the emergence of multiple distribution channels within the Limonin market. Leading Limonin manufacturers strategically focus on expanding and fortifying their market presence by enhancing their global distribution networks.

Summary of Key Findings

  • The Limonin market is experiencing steady growth due to heightened consumer awareness of its health benefits and the increasing demand for natural ingredients.
  • The pharmaceutical and food industries are significant consumers of Limonin, with its applications extending into cosmetics and other sectors, contributing to its market growth.
  • Regulatory challenges constrain market expansion, as compliance with various standards and regulations can be intricate and time-consuming.
  • Limited research on Limonin’s potential uses could hinder its market growth; thus, more comprehensive studies are required to unlock its full applications.
  • Seasonal variations impact Limonin’s availability, affecting its supply chain and pricing, which presents a challenge in maintaining consistent market growth.
  • The competitive landscape of the Limonin market with multiple players may lead to pricing pressures and intense rivalry.
  • Opportunities lie in the expanding natural cosmetics market, with Limonin’s skin-friendly properties making it a sought-after ingredient.
  • Functional beverages enriched with Limonin are gaining popularity in the health-conscious market, offering new avenues for market growth.
  • Investments in research and development can uncover new applications and benefits of Limonin, which could further boost market expansion.
  • Collaborations between industries, particularly in the food and pharmaceutical sectors, have the potential to lead to innovative product developments, extending the Limonin market’s reach and versatility.

Future Outlook

  • The Limonin market is poised for continued growth, primarily driven by increasing consumer awareness of its health benefits and natural origin.
  • Ongoing research and development efforts are expected to uncover new applications and medicinal uses for Limonin, expanding its market reach.
  • As health consciousness grows, the demand for natural ingredients like Limonin will likely surge, particularly in the pharmaceutical, food, and cosmetics industries.
  • Regulatory challenges remain a key consideration, and the market must navigate complex compliance requirements to ensure sustained growth.
  • Collaborations between industries, such as food and pharmaceuticals, can lead to innovative product developments, creating new market opportunities.
  • Limonin’s market presence will likely expand globally as manufacturers strategically strengthen their distribution channels to reach a wider audience.
  • Players in the Limonin market may focus on product differentiation and innovation to stand out in the competitive landscape.
  • Given the natural origin of Limonin, sustainability practices in its production and supply chain could become a significant selling point.
  • Raising awareness about the benefits and applications of Limonin through consumer education efforts can further drive market growth.
  • Keeping pace with evolving consumer trends and preferences, such as clean labels and functional ingredients, will be crucial for market players.

Market Segmentation

By Application

  • Pharmaceuticals
  • Food and Beverages
  • Cosmetics
  • Dietary Supplements
  • Agriculture
  • Flavoring Agent
  • Biomedical Research
  • Natural Cleaning Products
  • Others

By Type

  • High Purity Limonin (e.g., 98% Purity)
  • Standard Purity Limonin
  • Other Purity Grades
  • Natural Limonin Extracts
  • Synthetic Limonin
  • Blended Limonin Products
  • Customized Limonin Solutions

By End-Users

  • Healthcare and Pharmaceuticals Industry
  • Food and Beverage Industry
  • Cosmetics and Personal Care Industry
  • Natural Cosmetics Manufacturers
  • Nutraceuticals and Dietary Supplements
  • Other Industries

By Price Range

  • Low
  • Medium
  • High

By Region

North America

  • US.
  • Canada
  • Mexico

Europe

  • Germany
  • France
  • U.K.
  • Italy
  • Spain
  • Rest of Europe

Asia Pacific

  • China
  • Japan
  • India
  • South Korea
  • South-east Asia
  • Rest of Asia Pacific

Latin America

  • Brazil
  • Argentina
  • Rest of Latin America

Middle East & Africa

  • GCC Countries
  • South Africa
  • Rest of the Middle East and Africa

Adjacent Markets

In the Limonin market, several adjacent markets have high revenue growth opportunities. The key adjacent markets for the Limonin market are:

Report Report Report
Citrus Extracts and Flavors Market Natural Ingredients and Botanical Extracts Market Functional Foods and Beverages  Market
Nutraceuticals and Dietary Supplements Market Pharmaceuticals and Nutraceuticals Research Flavor and Fragrance Industry
Natural Cosmetic Ingredients Market Plant-Based Products Market

CHAPTER NO. 1 : INTRODUCTION 27

1.1. Report Description 27

1.1.1. Purpose of the Report 27

1.1.2. USP & Key Offerings 27

1.2. Key Benefits for Stakeholders 27

1.3. Target Audience 28

1.4. Report Scope 29


CHAPTER NO. 2 : EXECUTIVE SUMMARY 31

2.1. Limonin Market Snapshot 31

2.2. 32

2.3. Global Limonin Market, 2017 – 2022 (Kilo Tons) (USD Million) 33

2.1. Insights from Primary Respondents 33


CHAPTER NO. 3 : IMPACT ANALYSIS OF COVID 19 & RUSSIA-UKRAINE WAR ON LIMONIN MARKET 34

3.1. Impact Assessment of COVID-19 Pandemic, By Region 34

3.1.1. Supply chain disruptions 34

3.1.2. Demand fluctuations 34

3.1.3. Shift in product mix 34

3.1.4. Reduced industrial activity 34

3.1.5. Temporary disruptions and delays 34

3.1.6. Shift in focus towards essential services 34

3.2. Russia-Ukraine War Impacts 35

3.2.1. Uncertainty and economic instability 35

3.2.2. Supply chain disruptions 35

3.2.3. Regional market shifts 35

3.2.4. Shift in government priorities 35


CHAPTER NO. 4 : LIMONIN MARKET – INDUSTRY ANALYSIS 36

4.1. Introduction 36

4.2. Market Drivers 37

4.2.1. Driving Factor 1 Analysis 37

4.2.2. Driving Factor 2 Analysis 38

4.3. Market Restraints 39

4.3.1. Restraining Factor Analysis 39

4.4. Market Opportunities 40

4.4.1. Market Opportunity Analysis 40

4.5. Porter’s Five Forces Analysis 41

4.6. Value Chain Analysis 42

4.7. Buying Criteria 43


CHAPTER NO. 5 : IMPORT EXPORT ANALYSIS 44

5.1. Import Analysis by Region 44

5.1.1. Global Limonin Market Import Volume/Revenue, By Region, 2017 – 2022 44

5.2. Export Analysis by Region 45

5.2.1. Global Limonin Market Export Volume/Revenue, By Region, 2017 – 2022 45


CHAPTER NO. 6 : DEMAND SUPPLY ANALYSIS 46

6.1. Demand Analysis by Region 46

6.1.1. Global Limonin Market Demand Volume/Revenue, By Region, 2017 – 2022 46

6.2. Supply Analysis by Region 47

6.2.1. Global Limonin Market Supply Volume/Revenue, By Region, 2017 – 2022 47


CHAPTER NO. 7 : PRODUCTION ANALYSIS 48

7.1. Production Analysis by Region 48

7.1.1. Global Limonin Market Production, By Region, 2017 – 2022 48

7.1.2. Global Limonin Market Production Volume, By Region, 2017 – 2022 (Kilo Tons) 48


CHAPTER NO. 8 : PRICE ANALYSIS 49

8.1. Price Analysis by Region 49

8.1.1. Global Limonin Market Price, By Region, 2017 – 2022 49

8.1.2. Global Type Market Price, By Region, 2017 – 2022 49

8.2. Price Analysis by Type 50

8.2.1. Global Limonin Market Price, By Type, 2017 – 2022 50

8.2.2. Global Type Market Price, By Type, 2017 – 2022 50


CHAPTER NO. 9 : RAW MATERIALS ANALYSIS 51

9.1. Key Raw Materials and Suppliers 51

9.2. Key Raw Materials Price Trend 51


CHAPTER NO. 10 : MANUFACTURING COST ANALYSIS 52

10.1. Manufacturing Cost Analysis 52

10.1.1. Manufacturing Cost Analysis 52

10.2. Manufacturing Process 52

10.2.1. Manufacturing Process 52


CHAPTER NO. 11 : ANALYSIS COMPETITIVE LANDSCAPE 53

11.1. Company Market Share Analysis – 2022 53

11.1.1. Global Limonin Market: Company Market Share, by Volume, 2022 53

11.1.2. Global Limonin Market: Company Market Share, by Revenue2022 53

11.1.3. Global Limonin Market: Top 6 Company Market Share, by Revenue2022 54

11.1.4. Global Limonin Market: Top 3 Company Market Share, by Revenue2022 54

11.1. Global Limonin Market Company Volume Market Share, 2022 55

11.2. Global Limonin Market Company Revenue Market Share, 2022 56

11.3. Company Assessment Metrics, 2022 57

11.3.1. Stars 57

11.3.2. Emerging Leaders 57

11.3.3. Pervasive Players 57

11.3.4. Participants 57

11.4. Strategic Developments 58

11.4.1. Acquisitions & Mergers 58

11.4.2. New Product Launch 58

11.4.3. Regional Expansion 58

11.5. Key Players Product Matrix 59


CHAPTER NO. 12 : PESTEL & ADJACENT MARKET ANALYSIS 60

12.1. PESTEL 60

12.1.1. Political Factors 60

12.1.2. Economic Factors 60

12.1.3. Social Factors 60

12.1.4. Technological Factors 60

12.1.5. Environmental Factors 60

12.1.6. Legal Factors 60

12.2. Adjacent Market Analysis 60


CHAPTER NO. 13 : LIMONIN MARKET – BY TYPE SEGMENT ANALYSIS 61

13.1. Limonin Market Overview, by Type Segment 61

13.1.1. Limonin Market Volume Share, By Type, 2022 & 2030 62

13.1.2. Limonin Market Revenue Share, By Type, 2022 & 2030 62

13.1.3. Limonin Market Attractiveness Analysis, By Type 63

13.1.4. Incremental Revenue Growth Opportunity, by Type, 2023 – 2030 63

13.1.5. Limonin Market Revenue, By Type, 2017, 2022, 2026 & 2030 64

13.2. Purity 98% 65

13.2.1. Global Purity 98% Limonin Market Volume & Revenue, By Region, 2017 – 2022 (Kilo Tons) (USD Million) 66

13.2.2. Global Purity 98% Limonin Market Volume & Revenue, By Region, 2017 – 2022 (Kilo Tons) (USD Million) 66

13.3. Purity 95% 67

13.3.1. Global Purity 95% Limonin Market Volume & Revenue, By Region, 2017 – 2022 (Kilo Tons) (USD Million) 68

13.3.2. Global Purity 95% Limonin Market Volume & Revenue, By Region, 2017 – 2022 (Kilo Tons) (USD Million) 68


CHAPTER NO. 14 : LIMONIN MARKET – BY APPLICATION SEGMENT ANALYSIS 69

14.1. Limonin Market Overview, by Application Segment 69

14.1.1. Limonin Market Volume Share, By Application, 2022 & 2030 70

14.1.2. Limonin Market Revenue Share, By Application, 2022 & 2030 70

14.1.3. Limonin Market Attractiveness Analysis, By Application 71

14.1.4. Incremental Revenue Growth Opportunity, by Application, 2023 – 2030 71

14.1.5. Limonin Market Revenue, By Application, 2017, 2022, 2026 & 2030 72

14.2. Healthcare & Pharmaceuticals 73

14.2.1. Global Healthcare & Pharmaceuticals Limonin Market Volume & Revenue, By Region, 2017 – 2022 (Kilo Tons) (USD Million) 74

14.2.2. Global Healthcare & Pharmaceuticals Limonin Market Volume & Revenue, By Region, 2017 – 2022 (Kilo Tons) (USD Million) 74

14.3. Food & Beverages 75

14.3.1. Global Food & Beverages Limonin Market Volume & Revenue, By Region, 2017 – 2022 (Kilo Tons) (USD Million) 76

14.3.2. Global Food & Beverages Limonin Market Volume & Revenue, By Region, 2017 – 2022 (Kilo Tons) (USD Million) 76

14.4. Chemical Manufacturing 77

14.4.1. Global Chemical Manufacturing  Limonin Market Volume & Revenue, By Region, 2017 – 2022 (Kilo Tons) (USD Million) 78

14.4.2. Global Chemical Manufacturing  Limonin Market Volume & Revenue, By Region, 2017 – 2022 (Kilo Tons) (USD Million) 78

14.5. Cosmetics 79

14.5.1. Global Cosmetics Limonin Market Volume & Revenue, By Region, 2017 – 2022 (Kilo Tons) (USD Million) 80

14.5.2. Global Cosmetics Limonin Market Volume & Revenue, By Region, 2017 – 2022 (Kilo Tons) (USD Million) 80

14.6. Others 81

14.6.1. Global Others Limonin Market Volume & Revenue, By Region, 2017 – 2022 (Kilo Tons) (USD Million) 82

14.6.2. Global Others Limonin Market Volume & Revenue, By Region, 2017 – 2022 (Kilo Tons) (USD Million) 82


CHAPTER NO. 15 : LIMONIN MARKET – BY NATURE SEGMENT ANALYSIS 83

15.1. Limonin Market Overview, by Nature Segment 83

15.1.1. Limonin Market Volume Share, By Nature, 2022 & 2030 84

15.1.2. Limonin Market Revenue Share, By Nature, 2022 & 2030 84

15.1.3. Limonin Market Attractiveness Analysis, By Nature 85

15.1.4. Incremental Revenue Growth Opportunity, by Nature, 2023 – 2030 85

15.1.5. Limonin Market Revenue, By Nature, 2017, 2022, 2026 & 2030 86

15.2. Organic 87

15.2.1. Global Organic Limonin Market Volume & Revenue, By Region, 2017 – 2022 (Kilo Tons) (USD Million) 88

15.2.2. Global Organic Limonin Market Volume & Revenue, By Region, 2023 – 2030 (Kilo Tons) (USD Million) 88

15.3. Conventional 89

15.3.1. Global Conventional Limonin Market Volume & Revenue, By Region, 2017 – 2022 (Kilo Tons) (USD Million) 90

15.3.2. Global Conventional Limonin Market Volume & Revenue, By Region, 2023 – 2030 (Kilo Tons) (USD Million) 90


CHAPTER NO. 16 : LIMONIN MARKET – BY SALES CHANNEL SEGMENT ANALYSIS 91

16.1. Limonin Market Overview, by Sales Channel Segment 91

16.1.1. Limonin Market Revenue Share, By Sales Channel, 2022 & 2030 92

16.1.2. Limonin Market Revenue Share, By Sales Channel, 2022 & 2030 92

16.1.3. Limonin Market Attractiveness Analysis, By Sales Channel 93

16.1.4. Incremental Revenue Growth Opportunity, by Sales Channel, 2023 – 2030 93

16.1.5. Limonin Market Revenue, By Sales Channel, 2017, 2022, 2026 & 2030 94

16.2. Direct 95

16.2.1. Global Direct Limonin Market Volume & Revenue, By Region, 2017 – 2022 (Kilo Tons) (USD Million) 96

16.2.2. Global Direct Limonin Market Volume & Revenue, By Region, 2023 – 2030 (Kilo Tons) (USD Million) 96

16.3. Distributors 97

16.3.1. Global Distributors Limonin Market Volume & Revenue, By Region, 2017 – 2022 (Kilo Tons) (USD Million) 98

16.3.2. Global Distributors Limonin Market Volume & Revenue, By Region, 2023 – 2030 (Kilo Tons) (USD Million) 98


CHAPTER NO. 17 : LIMONIN MARKET – REGIONAL ANALYSIS 99

17.1. Limonin Market Overview, by Regional Segments 99

17.2. Region 100

17.2.1. Global Limonin Market Volume Share, By Region, 2022 & 2030 100

17.2.2. Global Limonin Market Revenue Share, By Region, 2022 & 2030 100

17.2.3. Limonin Market Attractiveness Analysis, By Region 101

17.2.4. Incremental Revenue Growth Opportunity, by Region, 2023 – 2030 101

17.2.5. Limonin Market Revenue, By Region, 2017, 2022, 2026 & 2030 102

17.2.6. Global Limonin Market Volume & Revenue, By Region, 2017 – 2022 (Kilo Tons) (USD Million) 103

17.2.7. Global Limonin Market Volume & Revenue, By Region, 2023 – 2030 (Kilo Tons) (USD Million) 103

17.3. Type 104

17.3.1. Global Limonin Market Volume & Revenue, By Type, 2017 – 2022 (Kilo Tons) (USD Million) 104

17.3.2. Global Limonin Market Volume & Revenue, By Type, 2023 – 2030 (Kilo Tons) (USD Million) 104

17.4. Application 105

17.4.1. Global Limonin Market Volume & Revenue, By Application, 2017 – 2022 (Kilo Tons) (USD Million) 105

17.4.2. Global Limonin Market Volume & Revenue, By Application, 2023 – 2030 (Kilo Tons) (USD Million) 105

17.5. Nature 106

17.5.1. Global Limonin Market Volume & Revenue, By Nature, 2017 – 2022 (Kilo Tons) (USD Million) 106

17.5.2. Global Limonin Market Volume & Revenue, By Nature, 2023 – 2030 (Kilo Tons) (USD Million) 106

17.6. Sales Channel 107

17.6.1. Global Limonin Market Volume & Revenue, By Sales Channel, 2017 – 2022 (Kilo Tons) (USD Million) 107

17.6.2. Global Limonin Market Volume & Revenue, By Sales Channel, 2023 – 2030 (Kilo Tons) (USD Million) 107


CHAPTER NO. 18 : LIMONIN MARKET – NORTH AMERICA 108

18.1. North America 108

18.1. Key Highlights 108

18.1.1. North America Limonin Market Volume, By Country, 2017 – 2022 (Kilo Tons) 109

18.1.2. North America Limonin Market Revenue, By Country, 2017 – 2022 (USD Million) 110

18.1.2.1. North America Limonin Market Volume, By Type, 2017 – 2022 (Kilo Tons) 111

18.1.3. North America Limonin Market Revenue, By Type, 2017 – 2022 (USD Million) 112

18.1.4. North America Limonin Market Volume, By Application, 2017 – 2022 (Kilo Tons) 113

18.1.5. North America Limonin Market Revenue, By Application, 2017 – 2022 (USD Million) 114

18.1.6. North America Limonin Market Volume, By Nature, 2017 – 2022 (Kilo Tons) 115

18.1.7. North America Limonin Market Revenue, By Nature, 2017 – 2022 (USD Million) 116

18.1.8. North America Limonin Market Volume, By Sales Channel, 2017 – 2022 (Kilo Tons) 117

18.1.9. North America Limonin Market Revenue, By Sales Channel, 2017 – 2022 (USD Million) 118

18.1.10. U.S. 119

18.1.11. Canada 119

18.1.12. Mexico 119


CHAPTER NO. 19 : LIMONIN MARKET – EUROPE 120

19.1. Europe 120

19.2. Key Highlights 120

19.2.1. Europe Limonin Market Volume, By Country, 2017 – 2022 (Kilo Tons) 121

19.2.2. Europe Limonin Market Revenue, By Country, 2017 – 2022 (USD Million) 122

19.2.3. Europe Limonin Market Volume, By Type, 2017 – 2022 (Kilo Tons) 123

19.2.4. Europe Limonin Market Revenue, By Type, 2017 – 2022 (USD Million) 124

19.2.5. Europe Limonin Market Volume, By Application, 2017 – 2022 (Kilo Tons) 125

19.2.6. Europe Limonin Market Revenue, By Application, 2017 – 2022 (USD Million) 126

19.2.7. Europe Limonin Market Volume, By Nature, 2017 – 2022 (Kilo Tons) 127

19.2.8. Europe Limonin Market Revenue, By Nature, 2017 – 2022 (USD Million) 128

19.2.9. Europe Limonin Market Volume, By Sales Channel, 2017 – 2022 (Kilo Tons) 129

19.2.10. Europe Limonin Market Revenue, By Sales Channel, 2017 – 2022 (USD Million) 130

19.2.11. UK 131

19.2.12. France 131

19.2.13. Germany 131

19.2.14. Italy 131

19.2.15. Spain 131

19.2.16. Russia 131

19.2.17. BENELUX 131

19.2.18. Sweden 131

19.2.19. Denmark 131

19.2.20. Poland 131

19.2.21. Austria 131

19.2.22. Rest of Europe 131


CHAPTER NO. 20 : LIMONIN MARKET – ASIA PACIFIC 132

20.1. Asia Pacific 132

20.2. Key Highlights 132

20.2.1. Asia Pacific Limonin Market Volume, By Country, 2017 – 2022 (Kilo Tons) 133

20.2.2. Asia Pacific Limonin Market Revenue, By Country, 2017 – 2022 (USD Million) 134

20.2.3. Asia Pacific Limonin Market Volume, By Type, 2017 – 2022 (Kilo Tons) 135

20.2.4. Asia Pacific Limonin Market Revenue, By Type, 2017 – 2022 (USD Million) 136

20.2.5. Asia Pacific Limonin Market Volume, By Application, 2017 – 2022 (Kilo Tons) 137

20.2.6. Asia Pacific Limonin Market Revenue, By Application, 2017 – 2022 (USD Million) 138

20.2.7. Asia Pacific Limonin Market Volume, By Nature, 2017 – 2022 (Kilo Tons) 139

20.2.8. Asia Pacific Limonin Market Revenue, By Nature, 2017 – 2022 (USD Million) 140

20.2.9. Asia Pacific Limonin Market Volume, By Sales Channel, 2017 – 2022 (Kilo Tons) 141

20.2.10. Asia Pacific Limonin Market Revenue, By Sales Channel, 2017 – 2022 (USD Million) 142

20.2.11. China 143

20.2.12. Japan 143

20.2.13. South Korea 143

20.2.14. India 143

20.2.15. Thailand 143

20.2.16. Indonesia 143

20.2.17. Vietnam 143

20.2.18. Malaysia 143

20.2.19. Philippines 143

20.2.20. Taiwan 143

20.2.21. Rest of Asia Pacific 143


CHAPTER NO. 21 : LIMONIN MARKET – LATIN AMERICA 144

21.1. Latin America 144

21.2. Key Highlights 144

21.2.1. Latin America Limonin Market Volume, By Country, 2017 – 2022 (Kilo Tons) 145

21.2.2. Latin America Limonin Market Revenue, By Country, 2017 – 2022 (USD Million) 146

21.2.3. Latin America Limonin Market Volume, By Type, 2017 – 2022 (Kilo Tons) 147

21.2.4. Latin America Limonin Market Revenue, By Type, 2017 – 2022 (USD Million) 148

21.2.5. Latin America Limonin Market Volume, By Application, 2017 – 2022 (Kilo Tons) 149

21.2.6. Latin America Limonin Market Revenue, By Application, 2017 – 2022 (USD Million) 150

21.2.7. Latin America Limonin Market Volume, By Nature, 2017 – 2022 (Kilo Tons) 151

21.2.8. Latin America Limonin Market Revenue, By Nature, 2017 – 2022 (USD Million) 152

21.2.9. Latin America Limonin Market Volume, By Sales Channel, 2017 – 2022 (Kilo Tons) 153

21.2.10. Latin America Limonin Market Revenue, By Sales Channel, 2017 – 2022 (USD Million) 154

21.2.11. Brazil 155

21.2.12. Argentina 155

21.2.13. Colombia 155

21.2.14. Chile 155

21.2.15. Peru 155

21.2.16. Rest of Latin America 155


CHAPTER NO. 22 : LIMONIN MARKET – MIDDLE EAST 156

22.1. The Middle-East 156

22.2. Key Highlights 156

22.2.1. Middle East Limonin Market Volume, By Country, 2017 – 2022 (Kilo Tons) 157

22.2.2. Middle East Limonin Market Revenue, By Country, 2017 – 2022 (USD Million) 158

22.2.3. Middle East Limonin Market Volume, By Type, 2017 – 2022 (Kilo Tons) 159

22.2.4. Middle East Limonin Market Revenue, By Type, 2017 – 2022 (USD Million) 160

22.2.5. Middle East Limonin Market Volume, By Application, 2017 – 2022 (Kilo Tons) 161

22.2.6. Middle East Limonin Market Revenue, By Application, 2017 – 2022 (USD Million) 162

22.2.7. Middle East Limonin Market Volume, By Nature, 2017 – 2022 (Kilo Tons) 163

22.2.8. Middle East Limonin Market Revenue, By Nature, 2017 – 2022 (USD Million) 164

22.2.9. Middle East Limonin Market Volume, By Sales Channel, 2017 – 2022 (Kilo Tons) 165

22.2.10. Middle East Limonin Market Revenue, By Sales Channel, 2017 – 2022 (USD Million) 166

22.2.11. GCC Countries 167

22.2.12. Israel 167

22.2.13. Turkey 167

22.2.14. Iran 167

22.2.15. Rest of Middle East & Africa 167


CHAPTER NO. 23 : LIMONIN MARKET – AFRICA 168

23.1. Africa 168

23.2. Key Highlights 168

23.2.1. Africa Limonin Market Volume, By Country, 2017 – 2022 (Kilo Tons) 169

23.2.2. Africa Limonin Market Revenue, By Country, 2017 – 2022 (USD Million) 170

23.2.3. Africa Limonin Market Volume, By Type, 2017 – 2022 (Kilo Tons) 171

23.2.4. Africa Limonin Market Revenue, By Type, 2017 – 2022 (USD Million) 172

23.2.5. Africa Limonin Market Volume, By Application, 2017 – 2022 (Kilo Tons) 173

23.2.6. Africa Limonin Market Revenue, By Application, 2017 – 2022 (USD Million) 174

23.2.7. Africa Limonin Market Volume, By Nature, 2017 – 2022 (Kilo Tons) 175

23.2.8. Africa Limonin Market Revenue, By Nature, 2017 – 2022 (USD Million) 176

23.2.9. Africa Limonin Market Volume, By Sales Channel, 2017 – 2022 (Kilo Tons) 177

23.2.10. Africa Limonin Market Revenue, By Sales Channel, 2017 – 2022 (USD Million) 178

23.2.11. South Africa 179

23.2.12. Egypt 179

23.2.13. Nigeria 179

23.2.14. Algeria 179

23.2.15. Morocco 179

23.2.16. Rest of Africa 179


CHAPTER NO. 24 : COMPANY PROFILES 180

24.1. Chemodex Ltd 180

24.1.1. Company Overview 180

24.1.2. Product Portfolio 180

24.1.3. Swot Analysis 180

24.1.4. Business Strategy 181

24.1.5. Financial Overview 181

24.2. ChemScene, LLC 182

24.3. Toronto Research Chemicals 182

24.4. Cayman Chemical 182

24.5. TCI America 182

24.6. ALB Technology 182

24.7. Carbosynth 182

24.8. Changsha Natural-ex Inc. 182

24.9. Aktin Chemical Inc 182

24.10. Naturex 182

24.11. Indena S.p.A. 182

24.12. Sabinsa Corporation 182

24.13. Martin Bauer Group 182

24.14. Nutra Green Biotechnology Co., Ltd. 182

24.15. Xi’an Pincredit Bio-Tech Co., Ltd. 182

24.16. Hunan Nutramax Inc. 182

24.17. Changsha Vigorous-Tech Co., Ltd. 182

24.18. Xi’an SR Bio-Engineering Co., Ltd. 182


CHAPTER NO. 25 : RESEARCH METHODOLOGY 183

25.1. Research Methodology 183

25.2. Phase I – Secondary Research 184

25.3. Phase II – Data Modeling 184

25.3.1. Company Share Analysis Model 185

25.3.2. Revenue Based Modeling 185

25.4. Phase III – Primary Research 186

25.5. Research Limitations 187

25.5.1. Assumptions 187


List of Figures

FIG NO. 1. Global Limonin Market Volume & Revenue, 2017 – 2022 (Kilo Tons) (USD Million) 34

FIG NO. 2. Porter’s Five Forces Analysis for Global Limonin Market 42

FIG NO. 3. Value Chain Analysis for Global Limonin Market 43

FIG NO. 4. Global Limonin Market Import Volume/Revenue, By Region, 2017 – 2022 45

FIG NO. 5. Global Limonin Market Export Volume/Revenue, By Region, 2017 – 2022 46

FIG NO. 6. Global Limonin Market Demand Volume/Revenue, By Region, 2017 – 2022 47

FIG NO. 7. Global Limonin Market Supply Volume/Revenue, By Region, 2017 – 2022 48

FIG NO. 8. Global Limonin Market Production, By Region, 2017 – 2022 49

FIG NO. 9. Global Limonin Market Price, By Region, 2017 – 2022 50

FIG NO. 10. Global Limonin Market Price, By Type, 2017 – 2022 51

FIG NO. 11. Raw Materials Price Trend Analysis, 2017 – 2022 52

FIG NO. 12. Manufacturing Cost Analysis 53

FIG NO. 13. Manufacturing Process 53

FIG NO. 14. Company Share Analysis, 2022 54

FIG NO. 15. Company Share Analysis, 2022 54

FIG NO. 16. Company Share Analysis, 2022 55

FIG NO. 17. Company Share Analysis, 2022 55

FIG NO. 18. Limonin Market – Company Volume  Market Share, 2022 56

FIG NO. 19. Limonin Market – Company Revenue Market Share, 2022 57

FIG NO. 20. Limonin Market Volume Share, By Type, 2022 & 2030 63

FIG NO. 21. Limonin Market Revenue Share, By Type, 2022 & 2030 63

FIG NO. 22. Market Attractiveness Analysis, By Type 64

FIG NO. 23. Incremental Revenue Growth Opportunity by Type 64

FIG NO. 24. Limonin Market Revenue, By Type, 2017, 2022, 2026 & 2030 65

FIG NO. 25. Global Limonin Market for Purity 98%, Volume & Revenue (Kilo Tons) (USD Million) 2017 – 2030 66

FIG NO. 26. Global Limonin Market for Purity 95%, Volume & Revenue (Kilo Tons) (USD Million) 2017 – 2030 68

FIG NO. 27. Limonin Market Volume Share, By Application, 2022 & 2030 71

FIG NO. 28. Limonin Market Revenue Share, By Application, 2022 & 2030 71

FIG NO. 29. Market Attractiveness Analysis, By Application 72

FIG NO. 30. Incremental Revenue Growth Opportunity by Application 72

FIG NO. 31. Limonin Market Revenue, By Application, 2017, 2022, 2026 & 2030 73

FIG NO. 32. Global Limonin Market for Healthcare & Pharmaceuticals, Volume & Revenue (Kilo Tons) (USD Million) 2017 – 2030 74

FIG NO. 33. Global Limonin Market for Food & Beverages, Volume & Revenue (Kilo Tons) (USD Million) 2017 – 2030 76

FIG NO. 34. Global Limonin Market for Chemical Manufacturing , Volume & Revenue (Kilo Tons) (USD Million) 2017 – 2030 78

FIG NO. 35. Global Limonin Market for Cosmetics, Volume & Revenue (Kilo Tons) (USD Million) 2017 – 2030 80

FIG NO. 36. Global Limonin Market for Others, Volume & Revenue (Kilo Tons) (USD Million) 2017 – 2030 82

FIG NO. 37. Limonin Market Volume Share, By Nature, 2022 & 2030 85

FIG NO. 38. Limonin Market Revenue Share, By Nature, 2022 & 2030 85

FIG NO. 39. Market Attractiveness Analysis, By Nature 86

FIG NO. 40. Incremental Revenue Growth Opportunity by Nature 86

FIG NO. 41. Limonin Market Revenue, By Nature, 2017, 2022, 2026 & 2030 87

FIG NO. 42. Global Limonin Market for Organic, Volume & Revenue (Kilo Tons) (USD Million) 2017 – 2030 88

FIG NO. 43. Global Limonin Market for Conventional, Volume & Revenue (Kilo Tons) (USD Million) 2017 – 2030 90

FIG NO. 44. Limonin Market Revenue Share, By Sales Channel, 2022 & 2030 93

FIG NO. 45. Limonin Market Revenue Share, By Sales Channel, 2022 & 2030 93

FIG NO. 46. Market Attractiveness Analysis, By Sales Channel 94

FIG NO. 47. Incremental Revenue Growth Opportunity by Sales Channel 94

FIG NO. 48. Limonin Market Revenue, By Sales Channel, 2017, 2022, 2026 & 2030 95

FIG NO. 49. Global Limonin Market for Direct, Volume & Revenue (Kilo Tons) (USD Million) 2017 – 2030 96

FIG NO. 50. Global Limonin Market for Distributors, Volume & Revenue (Kilo Tons) (USD Million) 2017 – 2030 98

FIG NO. 51. Global Limonin Market Volume Share, By Region, 2022 & 2030 101

FIG NO. 52. Global Limonin Market Revenue Share, By Region, 2022 & 2030 101

FIG NO. 53. Market Attractiveness Analysis, By Region 102

FIG NO. 54. Incremental Revenue Growth Opportunity by Region 102

FIG NO. 55. Limonin Market Revenue, By Region, 2017, 2022, 2026 & 2030 103

FIG NO. 56. North America Limonin Market Volume & Revenue, 2017 – 2022 (Kilo Tons) (USD Million) 109

FIG NO. 57. Europe Limonin Market Volume & Revenue, 2017 – 2022 (Kilo Tons) (USD Million) 121

FIG NO. 58. Asia Pacific Limonin Market Volume & Revenue, 2017 – 2022 (Kilo Tons) (USD Million) 133

FIG NO. 59. Latin America Limonin Market Volume & Revenue, 2017 – 2022 (Kilo Tons) (USD Million) 145

FIG NO. 60. The Middle-East Limonin Market Volume & Revenue, 2017 – 2022 (Kilo Tons) (USD Million) 157

FIG NO. 61. Africa Limonin Market Volume & Revenue, 2017 – 2022 (Kilo Tons) (USD Million) 169

FIG NO. 62. Research Methodology – Detailed View 184

FIG NO. 63. Research Methodology 185

List of Tables

TABLE NO. 1. : Global Limonin Market: Snapshot 31

TABLE NO. 2. : Drivers for the Limonin Market: Impact Analysis 37

TABLE NO. 3. : Restraints for the Limonin Market: Impact Analysis 39

TABLE NO. 4. : Global Limonin Market Volume & Revenue, By Region, 2017 – 2022 (Kilo Tons) 48

TABLE NO. 5. : Global Limonin Market Volume & Revenue, By Region, 2017 – 2022 49

TABLE NO. 6. : Global Limonin Market Volume & Revenue, By Type, 2017 – 2022 50

TABLE NO. 7. : Key Raw Materials & Suppliers 51

TABLE NO. 8. : Global Purity 98% Limonin Market Volume & Revenue, By Region, 2017 – 2022 (Kilo Tons) (USD Million) 66

TABLE NO. 9. : Global Purity 98% Limonin Market Volume & Revenue, By Region, 2023– 2030 (Kilo Tons) (USD Million) 66

TABLE NO. 10. : Global Purity 95% Limonin Market Volume & Revenue, By Region, 2017 – 2022 (Kilo Tons) (USD Million) 68

TABLE NO. 11. : Global Purity 95% Limonin Market Volume & Revenue, By Region, 2023– 2030 (Kilo Tons) (USD Million) 68

TABLE NO. 12. : Global Healthcare & Pharmaceuticals Limonin Market Volume & Revenue, By Region, 2017 – 2022 (Kilo Tons) (USD Million) 74

TABLE NO. 13. : Global Healthcare & Pharmaceuticals Limonin Market Volume & Revenue, By Region, 2023– 2030 (Kilo Tons) (USD Million) 74

TABLE NO. 14. : Global Food & Beverages Limonin Market Volume & Revenue, By Region, 2017 – 2022 (Kilo Tons) (USD Million) 76

TABLE NO. 15. : Global Food & Beverages Limonin Market Volume & Revenue, By Region, 2023– 2030 (Kilo Tons) (USD Million) 76

TABLE NO. 16. : Global Chemical Manufacturing  Limonin Market Volume & Revenue, By Region, 2017 – 2022 (Kilo Tons) (USD Million) 78

TABLE NO. 17. : Global Chemical Manufacturing  Limonin Market Volume & Revenue, By Region, 2023– 2030 (Kilo Tons) (USD Million) 78

TABLE NO. 18. : Global Cosmetics Limonin Market Volume & Revenue, By Region, 2017 – 2022 (Kilo Tons) (USD Million) 80

TABLE NO. 19. : Global Cosmetics Limonin Market Volume & Revenue, By Region, 2023– 2030 (Kilo Tons) (USD Million) 80

TABLE NO. 20. : Global Others Limonin Market Volume & Revenue, By Region, 2017 – 2022 (Kilo Tons) (USD Million) 82

TABLE NO. 21. : Global Others Limonin Market Volume & Revenue, By Region, 2023– 2030 (Kilo Tons) (USD Million) 82

TABLE NO. 22. : Global Organic Limonin Market Volume & Revenue, By Region, 2017 – 2022 (Kilo Tons) (USD Million) 88

TABLE NO. 23. : Global Organic Limonin Market Volume & Revenue, By Region, 2023– 2030 (Kilo Tons) (USD Million) 88

TABLE NO. 24. : Global Conventional Limonin Market Volume & Revenue, By Region, 2017 – 2022 (Kilo Tons) (USD Million) 90

TABLE NO. 25. : Global Conventional Limonin Market Volume & Revenue, By Region, 2023– 2030 (Kilo Tons) (USD Million) 90

TABLE NO. 26. : Global Direct Limonin Market Volume & Revenue, By Region, 2017 – 2022 (Kilo Tons) (USD Million) 96

TABLE NO. 27. : Global Direct Limonin Market Volume & Revenue, By Region, 2023– 2030 (Kilo Tons) (USD Million) 96

TABLE NO. 28. : Global Distributors Limonin Market Volume & Revenue, By Region, 2017 – 2022 (Kilo Tons) (USD Million) 98

TABLE NO. 29. : Global Distributors Limonin Market Volume & Revenue, By Region, 2023– 2030 (Kilo Tons) (USD Million) 98

TABLE NO. 30. : Global Limonin Market Volume & Revenue, By Region, 2017 – 2022 (Kilo Tons) (USD Million) 103

TABLE NO. 31. : Global Limonin Market Volume & Revenue, By Region, 2023– 2030 (Kilo Tons) (USD Million) 103

TABLE NO. 32. : Global Limonin Market Volume & Revenue, By Type, 2017 – 2022 (Kilo Tons) (USD Million) 104

TABLE NO. 33. : Global Limonin Market Volume & Revenue, By Type, 2023– 2030 (Kilo Tons) (USD Million) 104

TABLE NO. 34. : Global Limonin Market Volume & Revenue, By Application, 2017 – 2022 (Kilo Tons) (USD Million) 105

TABLE NO. 35. : Global Limonin Market Volume & Revenue, By Application, 2023– 2030 (Kilo Tons) (USD Million) 105

TABLE NO. 36. : Global Limonin Market Volume & Revenue, By Nature, 2017 – 2022 (Kilo Tons) (USD Million) 106

TABLE NO. 37. : Global Limonin Market Volume & Revenue, By Nature, 2023– 2030 (Kilo Tons) (USD Million) 106

TABLE NO. 38. : Global Limonin Market Volume & Revenue, By Sales Channel, 2017 – 2022 (Kilo Tons) (USD Million) 107

TABLE NO. 39. : Global Limonin Market Volume & Revenue, By Sales Channel, 2023– 2030 (Kilo Tons) (USD Million) 107

TABLE NO. 40. : North America Limonin Market Volume, By Country, 2017 – 2022 (Kilo Tons) 109

TABLE NO. 41. : North America Limonin Market Volume, By Country, 2023– 2030 (Kilo Tons) 109

TABLE NO. 42. : North America Limonin Market Revenue, By Country, 2017 – 2022 (USD Million) 110

TABLE NO. 43. : North America Limonin Market Revenue, By Country, 2023– 2030 (USD Million) 110

TABLE NO. 44. : North America Limonin Market Volume, By Type, 2017 – 2022 (Kilo Tons) 111

TABLE NO. 45. : North America Limonin Market Volume, By Type, 2023– 2030 (Kilo Tons) 111

TABLE NO. 46. : North America Limonin Market Revenue, By Type, 2017 – 2022 (USD Million) 112

TABLE NO. 47. : North America Limonin Market Revenue, By Type, 2023– 2030 (USD Million) 112

TABLE NO. 48. : North America Limonin Market Volume, By Application, 2017 – 2022 (Kilo Tons) 113

TABLE NO. 49. : North America Limonin Market Volume, By Application, 2023– 2030 (Kilo Tons) 113

TABLE NO. 50. : North America Limonin Market Revenue, By Application, 2017 – 2022 (USD Million) 114

TABLE NO. 51. : North America Limonin Market Revenue, By Application, 2023– 2030 (USD Million) 114

TABLE NO. 52. : North America Limonin Market Volume, By Nature, 2017 – 2022 (Kilo Tons) 115

TABLE NO. 53. : North America Limonin Market Volume, By Nature, 2023– 2030 (Kilo Tons) 115

TABLE NO. 54. : North America Limonin Market Revenue, By Nature, 2017 – 2022 (USD Million) 116

TABLE NO. 55. : North America Limonin Market Revenue, By Nature, 2023– 2030 (USD Million) 116

TABLE NO. 56. : North America Limonin Market Volume, By Sales Channel, 2017 – 2022 (Kilo Tons) 117

TABLE NO. 57. : North America Limonin Market Volume, By Sales Channel, 2023– 2030 (Kilo Tons) 117

TABLE NO. 58. : North America Limonin Market Revenue, By Sales Channel, 2017 – 2022 (USD Million) 118

TABLE NO. 59. : North America Limonin Market Revenue, By Sales Channel, 2023– 2030 (USD Million) 118

TABLE NO. 60. : Europe Limonin Market Volume, By Country, 2017 – 2022 (Kilo Tons) 121

TABLE NO. 61. : Europe Limonin Market Volume, By Country, 2023– 2030 (Kilo Tons) 121

TABLE NO. 62. : Europe Limonin Market Revenue, By Country, 2017 – 2022 (USD Million) 122

TABLE NO. 63. : Europe Limonin Market Revenue, By Country, 2023– 2030 (USD Million) 122

TABLE NO. 64. : Europe Limonin Market Volume, By Type, 2017 – 2022 (Kilo Tons) 123

TABLE NO. 65. : Europe Limonin Market Volume, By Type, 2023– 2030 (Kilo Tons) 123

TABLE NO. 66. : Europe Limonin Market Revenue, By Type, 2017 – 2022 (USD Million) 124

TABLE NO. 67. : Europe Limonin Market Revenue, By Type, 2023– 2030 (USD Million) 124

TABLE NO. 68. : Europe Limonin Market Volume, By Application, 2017 – 2022 (Kilo Tons) 125

TABLE NO. 69. : Europe Limonin Market Volume, By Application, 2023– 2030 (Kilo Tons) 125

TABLE NO. 70. : Europe Limonin Market Revenue, By Application, 2017 – 2022 (USD Million) 126

TABLE NO. 71. : Europe Limonin Market Revenue, By Application, 2023– 2030 (USD Million) 126

TABLE NO. 72. : Europe Limonin Market Volume, By Nature, 2017 – 2022 (Kilo Tons) 127

TABLE NO. 73. : Europe Limonin Market Volume, By Nature, 2023– 2030 (Kilo Tons) 127

TABLE NO. 74. : Europe Limonin Market Revenue, By Nature, 2017 – 2022 (USD Million) 128

TABLE NO. 75. : Europe Limonin Market Revenue, By Nature, 2023– 2030 (USD Million) 128

TABLE NO. 76. : Europe Limonin Market Volume, By Sales Channel, 2017 – 2022 (Kilo Tons) 129

TABLE NO. 77. : Europe Limonin Market Volume, By Sales Channel, 2023– 2030 (Kilo Tons) 129

TABLE NO. 78. : Europe Limonin Market Revenue, By Sales Channel, 2017 – 2022 (USD Million) 130

TABLE NO. 79. : Europe Limonin Market Revenue, By Sales Channel, 2023– 2030 (USD Million) 130

TABLE NO. 80. : Asia Pacific Limonin Market Volume, By Country, 2017 – 2022 (Kilo Tons) 133

TABLE NO. 81. : Asia Pacific Limonin Market Volume, By Country, 2023– 2030 (Kilo Tons) 133

TABLE NO. 82. : Asia Pacific Limonin Market Revenue, By Country, 2017 – 2022 (USD Million) 134

TABLE NO. 83. : Asia Pacific Limonin Market Revenue, By Country, 2023– 2030 (USD Million) 134

TABLE NO. 84. : Asia Pacific Limonin Market Volume, By Type, 2017 – 2022 (Kilo Tons) 135

TABLE NO. 85. : Asia Pacific Limonin Market Volume, By Type, 2023– 2030 (Kilo Tons) 135

TABLE NO. 86. : Asia Pacific Limonin Market Revenue, By Type, 2017 – 2022 (USD Million) 136

TABLE NO. 87. : Asia Pacific Limonin Market Revenue, By Type, 2023– 2030 (USD Million) 136

TABLE NO. 88. : Asia Pacific Limonin Market Volume, By Application, 2017 – 2022 (Kilo Tons) 137

TABLE NO. 89. : Asia Pacific Limonin Market Volume, By Application, 2023– 2030 (Kilo Tons) 137

TABLE NO. 90. : Asia Pacific Limonin Market Revenue, By Application, 2017 – 2022 (USD Million) 138

TABLE NO. 91. : Asia Pacific Limonin Market Revenue, By Application, 2023– 2030 (USD Million) 138

TABLE NO. 92. : Asia Pacific Limonin Market Volume, By Nature, 2017 – 2022 (Kilo Tons) 139

TABLE NO. 93. : Asia Pacific Limonin Market Volume, By Nature, 2023– 2030 (Kilo Tons) 139

TABLE NO. 94. : Asia Pacific Limonin Market Revenue, By Nature, 2017 – 2022 (USD Million) 140

TABLE NO. 95. : Asia Pacific Limonin Market Revenue, By Nature, 2023– 2030 (USD Million) 140

TABLE NO. 96. : Asia Pacific Limonin Market Volume, By Sales Channel, 2017 – 2022 (Kilo Tons) 141

TABLE NO. 97. : Asia Pacific Limonin Market Volume, By Sales Channel, 2023– 2030 (Kilo Tons) 141

TABLE NO. 98. : Asia Pacific Limonin Market Revenue, By Sales Channel, 2017 – 2022 (USD Million) 142

TABLE NO. 99. : Asia Pacific Limonin Market Revenue, By Sales Channel, 2023– 2030 (USD Million) 142

TABLE NO. 100. : Latin America Limonin Market Volume, By Country, 2017 – 2022 (Kilo Tons) 145

TABLE NO. 101. : Latin America Limonin Market Volume, By Country, 2023– 2030 (Kilo Tons) 145

TABLE NO. 102. : Latin America Limonin Market Revenue, By Country, 2017 – 2022 (USD Million) 146

TABLE NO. 103. : Latin America Limonin Market Revenue, By Country, 2023– 2030 (USD Million) 146

TABLE NO. 104. : Latin America Limonin Market Volume, By Type, 2017 – 2022 (Kilo Tons) 147

TABLE NO. 105. : Latin America Limonin Market Volume, By Type, 2023– 2030 (Kilo Tons) 147

TABLE NO. 106. : Latin America Limonin Market Revenue, By Type, 2017 – 2022 (USD Million) 148

TABLE NO. 107. : Latin America Limonin Market Revenue, By Type, 2023– 2030 (USD Million) 148

TABLE NO. 108. : Latin America Limonin Market Volume, By Application, 2017 – 2022 (Kilo Tons) 149

TABLE NO. 109. : Latin America Limonin Market Volume, By Application, 2023– 2030 (Kilo Tons) 149

TABLE NO. 110. : Latin America Limonin Market Revenue, By Application, 2017 – 2022 (USD Million) 150

TABLE NO. 111. : Latin America Limonin Market Revenue, By Application, 2023– 2030 (USD Million) 150

TABLE NO. 112. : Latin America Limonin Market Volume, By Nature, 2017 – 2022 (Kilo Tons) 151

TABLE NO. 113. : Latin America Limonin Market Volume, By Nature, 2023– 2030 (Kilo Tons) 151

TABLE NO. 114. : Latin America Limonin Market Revenue, By Nature, 2017 – 2022 (USD Million) 152

TABLE NO. 115. : Latin America Limonin Market Revenue, By Nature, 2023– 2030 (USD Million) 152

TABLE NO. 116. : Latin America Limonin Market Volume, By Sales Channel, 2017 – 2022 (Kilo Tons) 153

TABLE NO. 117. : Latin America Limonin Market Volume, By Sales Channel, 2023– 2030 (Kilo Tons) 153

TABLE NO. 118. : Latin America Limonin Market Revenue, By Sales Channel, 2017 – 2022 (USD Million) 154

TABLE NO. 119. : Latin America Limonin Market Revenue, By Sales Channel, 2023– 2030 (USD Million) 154

TABLE NO. 120. : Middle East Limonin Market Volume, By Country, 2017 – 2022 (Kilo Tons) 157

TABLE NO. 121. : Middle East Limonin Market Volume, By Country, 2023– 2030 (Kilo Tons) 157

TABLE NO. 122. : Middle East Limonin Market Revenue, By Country, 2017 – 2022 (USD Million) 158

TABLE NO. 123. : Middle East Limonin Market Revenue, By Country, 2023– 2030 (USD Million) 158

TABLE NO. 124. : Middle East Limonin Market Volume, By Type, 2017 – 2022 (Kilo Tons) 159

TABLE NO. 125. : Middle East Limonin Market Volume, By Type, 2023– 2030 (Kilo Tons) 159

TABLE NO. 126. : Middle East Limonin Market Revenue, By Type, 2017 – 2022 (USD Million) 160

TABLE NO. 127. : Middle East Limonin Market Revenue, By Type, 2023– 2030 (USD Million) 160

TABLE NO. 128. : Middle East Limonin Market Volume, By Application, 2017 – 2022 (Kilo Tons) 161

TABLE NO. 129. : Middle East Limonin Market Volume, By Application, 2023– 2030 (Kilo Tons) 161

TABLE NO. 130. : Middle East Limonin Market Revenue, By Application, 2017 – 2022 (USD Million) 162

TABLE NO. 131. : Middle East Limonin Market Revenue, By Application, 2023– 2030 (USD Million) 162

TABLE NO. 132. : Middle East Limonin Market Volume, By Nature, 2017 – 2022 (Kilo Tons) 163

TABLE NO. 133. : Middle East Limonin Market Volume, By Nature, 2023– 2030 (Kilo Tons) 163

TABLE NO. 134. : Middle East Limonin Market Revenue, By Nature, 2017 – 2022 (USD Million) 164

TABLE NO. 135. : Middle East Limonin Market Revenue, By Nature, 2023– 2030 (USD Million) 164

TABLE NO. 136. : Middle East Limonin Market Volume, By Sales Channel, 2017 – 2022 (Kilo Tons) 165

TABLE NO. 137. : Middle East Limonin Market Volume, By Sales Channel, 2023– 2030 (Kilo Tons) 165

TABLE NO. 138. : Middle East Limonin Market Revenue, By Sales Channel, 2017 – 2022 (USD Million) 166

TABLE NO. 139. : Middle East Limonin Market Revenue, By Sales Channel, 2023– 2030 (USD Million) 166

TABLE NO. 140. : Africa Limonin Market Volume, By Country, 2017 – 2022 (Kilo Tons) 169

TABLE NO. 141. : Africa Limonin Market Volume, By Country, 2023– 2030 (Kilo Tons) 169

TABLE NO. 142. : Africa Limonin Market Revenue, By Country, 2017 – 2022 (USD Million) 170

TABLE NO. 143. : Africa Limonin Market Revenue, By Country, 2023– 2030 (USD Million) 170

TABLE NO. 144. : Africa Limonin Market Volume, By Type, 2017 – 2022 (Kilo Tons) 171

TABLE NO. 145. : Africa Limonin Market Volume, By Type, 2023– 2030 (Kilo Tons) 171

TABLE NO. 146. : Africa Limonin Market Revenue, By Type, 2017 – 2022 (USD Million) 172

TABLE NO. 147. : Africa Limonin Market Revenue, By Type, 2023– 2030 (USD Million) 172

TABLE NO. 148. : Africa Limonin Market Volume, By Application, 2017 – 2022 (Kilo Tons) 173

TABLE NO. 149. : Africa Limonin Market Volume, By Application, 2023– 2030 (Kilo Tons) 173

TABLE NO. 150. : Africa Limonin Market Revenue, By Application, 2017 – 2022 (USD Million) 174

TABLE NO. 151. : Africa Limonin Market Revenue, By Application, 2023– 2030 (USD Million) 174

TABLE NO. 152. : Africa Limonin Market Volume, By Nature, 2017 – 2022 (Kilo Tons) 175

TABLE NO. 153. : Africa Limonin Market Volume, By Nature, 2023– 2030 (Kilo Tons) 175

TABLE NO. 154. : Africa Limonin Market Revenue, By Nature, 2017 – 2022 (USD Million) 176

TABLE NO. 155. : Africa Limonin Market Revenue, By Nature, 2023– 2030 (USD Million) 176

TABLE NO. 156. : Africa Limonin Market Volume, By Sales Channel, 2017 – 2022 (Kilo Tons) 177

TABLE NO. 157. : Africa Limonin Market Volume, By Sales Channel, 2023– 2030 (Kilo Tons) 177

TABLE NO. 158. : Africa Limonin Market Revenue, By Sales Channel, 2017 – 2022 (USD Million) 178

TABLE NO. 159. : Africa Limonin Market Revenue, By Sales Channel, 2023– 2030 (USD Million) 178

Frequently Asked Questions

What is Limonin, and where is it derived from?

Limonin is a naturally occurring compound categorized as a limonoid, primarily found in citrus fruits like oranges, lemons, and grapefruits. It is concentrated in various parts of these fruits, including the seeds, peels, and pulp.

What are the key applications of Limonin?

Limonin exhibits versatility in its applications. In the pharmaceutical industry, it is sought after for its potential health benefits, such as antioxidant and anti-inflammatory properties. Limonin is a natural flavor enhancer and preservative in the food and beverage sector due to its bitter taste and antimicrobial characteristics. Additionally, it is utilized in the cosmetics and skincare industry, where it is appreciated for its skin-friendly attributes and possible anti-aging effects.

What are the health benefits associated with Limonin consumption?

Limonin has garnered attention for its potential health benefits, which include its role as an antioxidant, aiding in combating free radicals within the body and reducing oxidative stress. It also exhibits anti-inflammatory properties, which could have applications in various health conditions. Furthermore, some studies suggest that Limonin may be beneficial in managing cholesterol levels.

Which industry consumes the most Limonin?

The healthcare and pharmaceuticals industry stands as the largest consumer of Limonin. This is primarily due to the compound’s medicinal properties, which make it valuable for research and the development of pharmaceutical products, including potential drugs and dietary supplements.

What is the purity level of Limonin that leads to market growth?

Within the Limonin market, the segment with the highest purity level, specifically the 98% purity segment, leads in growth. With this level of purity, Limonin is in high demand due to its effectiveness and applicability across a wide range of sectors, including pharmaceuticals and cosmetics.

What challenges does the Limonin market face in terms of regulations?

Regulatory challenges within the Limonin market arise from the need to adhere to strict standards and regulations, particularly in the pharmaceutical and food industries. Ensuring consistent quality and safety is imperative, necessitating complex and time-consuming processes.

Why is the Limonin market subject to seasonal variability?

Limonin’s availability experiences seasonal fluctuations due to its natural derivation from citrus fruits. The production of citrus fruits varies throughout the year, impacting Limonin-containing products’ supply chain and pricing.

What opportunities are emerging in the Limonin market?

Several promising opportunities are emerging within the Limonin market. These include expanding the natural cosmetics market, where Limonin finds use due to its skin-friendly properties. Additionally, functional beverages enriched with Limonin are gaining popularity among health-conscious consumers. Increased investments in research and development are expected to unveil new applications and benefits of Limonin. Collaborations between different industries, such as food and pharmaceuticals, hold the potential to lead to innovative product developments, thus expanding the Limonin market’s reach and versatility.

Which regions dominate the Limonin market?

North America emerges as the leading market for Limonin, contributing over 35% of the market share in 2022. However, substantial growth is anticipated in Europe, Asia Pacific, and other regions due to increasing health awareness and a growing demand for natural ingredients.

What is the expected growth rate of the Limonin market in the coming years?

The Limonin market is projected to experience steady growth, with a Compound Annual Growth Rate (CAGR) of 3.32% from 2023 to 2030. This growth trajectory is expected to increase revenue, with the market reaching USD 542.87 million in 2030 from USD 431.86 million in 2022.

Chemical

Petrochemical Processing Equipment Market

Published Date: Sept 2023
Category: Chemicals
Report ID: 61354
Report Format: PDF
No of Pages: 234

Chemical

Ethanol To Jet Fuel (ETJ) Processing Technology Market

Published Date: Sept 2023
Category: Chemicals
Report ID: 61344
Report Format: PDF
No of Pages: 214

Chemical

Chemical Processing Catalysts Market

Published Date: Sep. 2023
Category: Chemicals
Report ID: 61338
Report Format: PDF
No of Pages: 248

Chemical

Encapsulated Lactic Acid Market

Published Date: Sep 2023
Category: Chemicals
Report ID: 61118
Report Format: PDF
No of Pages: 218

Chemical

Metaraminol Bitartrate Market

Published Date: Sep 2023
Category: Chemicals
Report ID: 62106
Report Format: PDF
No of Pages: 227

Chemical

TCD Alcohol DM Market

Published Date: Sep 2023
Category: Chemicals
Report ID: 62105
Report Format: PDF
No of Pages: 227

Chemical

Sodium Hexametaphosphate (SHMP) Market

Published Date: Sep 2023
Category: Chemicals
Report ID: 62104
Report Format: PDF
No of Pages: 245

Chemical

Aluminum Isopropoxide Market

Published Date: Sep 2023
Category: Chemicals
Report ID:60595
Report Format: PDF
No of Pages: 233

Chemical

Lactic Acid Market

Published Date: August 2023
Category: Chemicals
Report ID: 57759
Report Format: PDF
No of Pages: 234

Chemical

Polybutene Market

Published Date: Aug 2023
Category: Chemicals
Report ID: 58038
Report Format: PDF
No of Pages: 235

Chemical

Polychlorotrifluoroethylene (PCTFE) Market

Published Date: Aug 2023
Category: Chemicals
Report ID:62084
Report Format: PDF
No of Pages: 230

Chemical

Polyisocyanurate Insulation Market

Published Date: August 2023
Category: Chemicals
Report ID: 62082
Report Format: PDF
No of Pages: 243

Download Sample Report


Have a question?

User Profile

Don’t settle for less – trust Mitul to help you find the best solution.

Report delivery within 24 to 48 hours

– Other Info –

What people say?-

User Review

I am very impressed with the information in this report. The author clearly did their research when they came up with this product and it has already given me a lot of ideas.

Jana Schmidt
CEDAR CX Technologies

– Connect with us –

Phone

+91 6232 49 3207


support

24/7 Research Support


sales@credenceresearch.com

– Research Methodology –

Going beyond the basics: advanced techniques in research methodology

– Trusted By –

Pepshi, LG, Nestle
Motorola, Honeywell, Johnson and johnson
LG Chem, SIEMENS, Pfizer
Unilever, Samsonite, QIAGEN
WhatsApp Now