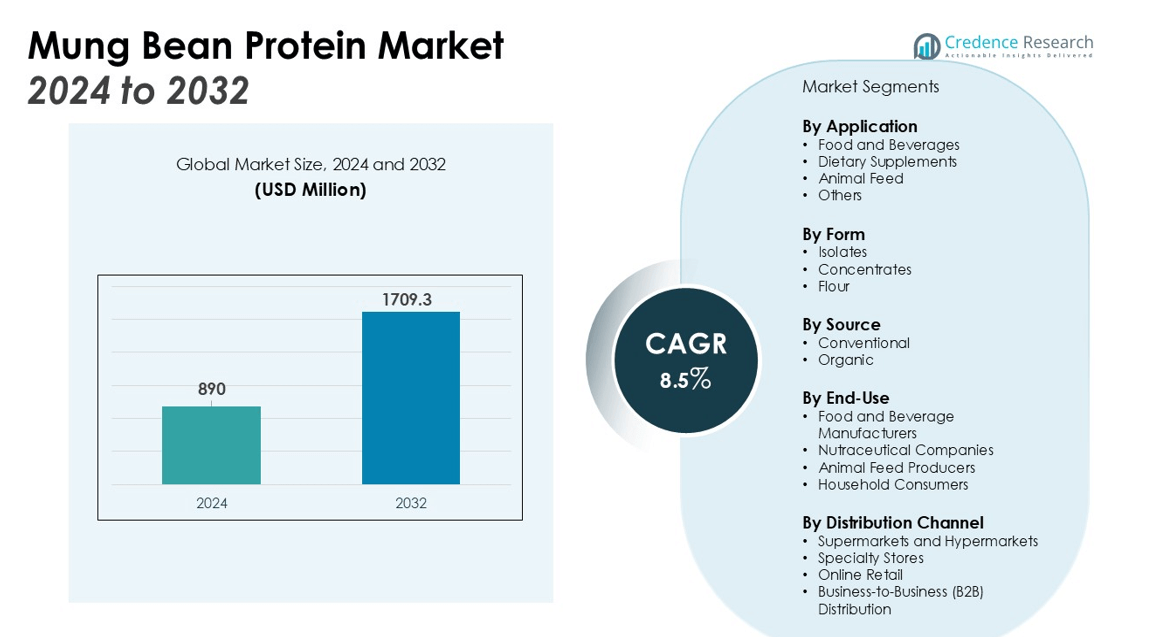
Home » Food & Beverage » Mung Beans Market

Mung Beans Market By Type (Non-GMO Seed, GMO Seed); By Application (Online Sale, Offline Sale); By Geography (Region) – Growth, Share, Opportunities & Competitive Analysis, 2024 – 2032

Price: $4699

Published: | Report ID: 14280 | Report Format : PDF
REPORT ATTRIBUTE DETAILS
Historical Period 2019-2022
Base Year 2023
Forecast Period 2024-2032
Global Mung Beans Market Size 2023 USD 3,987.61 million
Global Mung Beans Market, CAGR 3.90%
Global Mung Beans Market Size 2032 USD 5,626.69 million

Market Overview

The Global Mung Beans Market is projected to grow from USD 3,987.61 million in 2023 to an estimated USD 5,626.69 million by 2032, with a compound annual growth rate (CAGR) of 3.90% from 2024 to 2032. This growth trajectory underscores the rising demand for mung beans, driven by their nutritional benefits and versatility in culinary applications. Mung beans, known for their high protein content, are increasingly favored in various dietary regimes, including vegan and vegetarian diets. The market size reflects a robust interest in these legumes across different regions, indicating their expanding footprint in global food markets.

The growth of the mung beans market is primarily driven by increasing consumer awareness regarding health and nutrition. Mung beans are rich in essential nutrients such as protein, fiber, and vitamins, making them a popular choice among health-conscious consumers. The rising popularity of plant-based diets further propels the demand for mung beans, as they serve as an excellent meat alternative. Additionally, the trend towards organic and sustainable farming practices enhances the market’s appeal, with more consumers opting for organic mung beans. Innovations in food processing and packaging also contribute to market expansion, offering convenient and appealing mung bean products to a broad consumer base.

Geographically, the Asia-Pacific region dominates the mung beans market, accounting for the largest share due to the high consumption of mung beans in countries like China, India, and Thailand. These countries have a long-standing tradition of incorporating mung beans into their diets, driven by cultural and culinary preferences. North America and Europe are also significant markets, experiencing steady growth as mung beans gain popularity among health-conscious consumers and those seeking plant-based protein sources. Key players in the global mung beans market include companies such as Anhui Wanken, ADM, and Barry Farm Foods, which are focusing on expanding their product portfolios and enhancing distribution networks to capture a larger market share.

Design Element 2

Access crucial information at unmatched prices!

Request your free sample report today & start making informed decisions powered by Credence Research!

Download Free Sample

CTA Design Element 3

Market Drivers

Growing Health and Nutritional Awareness

One of the primary drivers of the global mung beans market is the increasing consumer awareness regarding health and nutrition. According to a survey, more individuals are becoming conscious of their dietary choices and their impact on overall health. As more individuals become conscious of their dietary choices and their impact on overall health, the demand for nutrient-rich foods has surged. Mung beans, renowned for their high protein, fiber, vitamins, and mineral content, fit perfectly into this trend. They are considered a superfood, providing essential nutrients without the high-calorie count associated with many other protein sources. The rise in lifestyle-related diseases such as obesity, diabetes, and cardiovascular conditions has further propelled the consumption of mung beans, as they are often recommended by nutritionists and health experts for their low glycemic index and ability to aid in weight management. The global movement towards healthier eating habits continues to boost the market, with consumers increasingly incorporating mung beans into their diets through various forms such as sprouts, soups, salads, and snacks.

Surge in Plant-Based Diets

The global shift towards plant-based diets has significantly impacted the mung beans market. With an increasing number of people adopting vegetarian and vegan lifestyles, the demand for plant-based protein sources has skyrocketed. Mung beans, being a versatile legume, offer an excellent alternative to animal-based proteins. They are not only a staple in traditional Asian cuisines but have also gained popularity in Western diets due to their adaptability in various culinary applications. The trend is further driven by the growing concerns about animal welfare, environmental sustainability, and the desire to reduce meat consumption. Mung beans’ ability to provide a complete protein profile, along with their rich nutrient content, makes them an attractive option for those looking to diversify their protein intake. Food manufacturers and restaurants are increasingly incorporating mung beans into their product offerings and menus, respectively, to cater to this burgeoning market segment.

Advancements in Food Processing and Packaging

Innovations in food processing and packaging have played a crucial role in the expansion of the global mung beans market. Advances in technology have enabled the development of various mung bean-based products, enhancing their appeal and convenience for consumers. Ready-to-eat mung bean meals, snacks, and protein supplements are becoming more prevalent, catering to the busy lifestyles of modern consumers who seek nutritious and quick meal options. Additionally, improvements in packaging solutions have extended the shelf life of mung bean products, ensuring that they retain their freshness and nutritional value over time. These advancements have made mung beans more accessible to a broader audience, including those who may not have the time or expertise to prepare traditional mung bean dishes from scratch. The growing trend of clean label and minimally processed foods also aligns with the natural and wholesome image of mung beans, further driving their popularity.

Increasing Demand for Organic and Sustainable Products

The rising demand for organic and sustainably sourced food products has significantly influenced the mung beans market. Consumers are becoming more environmentally conscious and are seeking out foods that are produced using sustainable agricultural practices. Organic mung beans, grown without the use of synthetic pesticides and fertilizers, are perceived as healthier and more environmentally friendly options. This preference for organic products is driven by concerns about food safety, environmental impact, and the desire to support sustainable farming communities. The market for organic mung beans is expanding, with retailers and food brands highlighting the organic and non-GMO attributes of their mung bean products to attract discerning consumers. Furthermore, initiatives and certifications promoting sustainable agriculture are gaining traction, encouraging farmers to adopt eco-friendly practices that enhance soil health, biodiversity, and resource efficiency. The alignment of mung beans with these sustainability trends reinforces their position in the market, appealing to a growing segment of consumers committed to making ethical and sustainable food choices.

Market Trends

Rise in Plant-Based and Vegan Diets

A notable trend in the global mung beans market is the increasing adoption of plant-based and vegan diets. According to a report, more and more people are shifting towards plant-based diets for reasons relating to health, as well as ethical considerations about climate change and animal welfare. Consumers are turning to plant-based proteins as a healthier and more sustainable alternative to animal products. Mung beans, with their high protein content and versatility, are becoming a popular choice in vegan and vegetarian meals, contributing significantly to market growth.

Growing Popularity of Organic Mung Beans

The demand for organic food products is surging globally, and mung beans are no exception. Consumers are becoming more health-conscious and environmentally aware, leading to a preference for organic mung beans that are free from synthetic pesticides and fertilizers. This trend is bolstered by the perception that organic products are healthier and more sustainable, encouraging farmers and producers to adopt organic farming practices.

Expansion of Ready-to-Eat and Convenience Foods

The modern consumer’s busy lifestyle has fueled the demand for convenient and ready-to-eat food options. In response, the food industry has introduced a variety of mung bean-based convenience foods, such as ready-to-eat soups, salads, and snacks. These products cater to health-conscious consumers who seek quick and nutritious meal solutions, driving the growth of the mung beans market.

Innovations in Food Processing and Packaging

Technological advancements in food processing and packaging are shaping the mung beans market. Innovations have led to the development of new mung bean products, such as mung bean pasta, flour, and protein isolates. Improved packaging solutions extend the shelf life of mung bean products, ensuring they remain fresh and retain their nutritional value. These innovations make mung beans more accessible and appealing to a wider audience.

Increasing Use in Functional Foods and Beverages

Mung beans are increasingly being incorporated into functional foods and beverages, which are designed to provide health benefits beyond basic nutrition. The high nutrient content of mung beans, including antioxidants, vitamins, and minerals, makes them ideal for functional food products. This trend is driven by the growing consumer interest in foods that support overall health and wellness, including immune support, digestive health, and weight management.

Growing Awareness and Adoption in Western Markets

Traditionally consumed in Asia, mung beans are gaining popularity in Western markets due to their health benefits and versatility. Western consumers are becoming more familiar with mung beans through various channels, including health blogs, cooking shows, and social media. This growing awareness is translating into increased adoption and demand for mung beans in Western cuisines.

Focus on Sustainable and Ethical Sourcing

Sustainability and ethical sourcing are becoming increasingly important to consumers. Many are now looking for products that are produced in an environmentally friendly and socially responsible manner. The mung beans market is responding to this trend by emphasizing sustainable farming practices, fair trade certifications, and transparent supply chains. Companies that prioritize sustainability are likely to attract more consumers and build stronger brand loyalty.

Market Restraints and Challenges

Climate and Environmental Dependence

One of the significant challenges facing the global mung beans market is its dependence on favorable climatic and environmental conditions. Mung beans require specific weather patterns and soil conditions to thrive. Adverse weather events, such as droughts, floods, and unseasonal rains, can severely impact crop yields. Climate change exacerbates these issues, leading to unpredictable growing seasons and increased vulnerability of mung bean crops. Farmers face challenges in maintaining consistent production levels, which can result in supply shortages and price volatility in the market.

Limited Awareness and Consumption in Some Regions

While mung beans are well-known and widely consumed in Asian countries, their popularity and consumption in other regions, such as Europe and North America, remain relatively low. Limited consumer awareness about the nutritional benefits and culinary versatility of mung beans poses a challenge to market growth. Additionally, traditional dietary habits and preferences for other protein sources can impede the adoption of mung beans. Efforts to educate consumers and promote the benefits of mung beans are essential to overcoming this restraint and expanding market reach.

Supply Chain and Logistics Challenges

The mung beans market faces significant supply chain and logistics challenges, particularly in ensuring the timely and efficient distribution of products. Mung beans are perishable, and maintaining their quality during transportation and storage is critical. Inadequate infrastructure, especially in developing regions, can lead to post-harvest losses and reduced product quality. Efficient supply chain management, including proper storage facilities and transportation networks, is crucial to minimizing losses and ensuring a steady supply of high-quality mung beans to the market.

Competition from Other Protein Sources

Mung beans face stiff competition from a variety of other protein sources, both plant-based and animal-based. The market for plant-based proteins is diverse, including options such as lentils, chickpeas, soybeans, and quinoa. These alternatives often compete for the same consumer segment focused on health and sustainability. Additionally, animal-based proteins, which have a well-established presence in many diets, continue to dominate the protein market. To differentiate mung beans and capture market share, it is necessary to highlight their unique nutritional benefits and versatile culinary applications.

Price Fluctuations and Market Volatility

Price volatility is another significant restraint in the mung beans market. Factors such as fluctuating demand, inconsistent supply due to climatic conditions, and changes in global trade policies can lead to significant price swings. For example, tariffs and trade barriers can impact the import and export of mung beans, affecting their availability and cost in various markets. Price instability can create challenges for both producers and consumers, making it difficult to plan and budget effectively.

Market Segmentation Analysis

By Type

Non-GMO seeds dominate the mung beans market due to increasing consumer preference for natural and organic products. Health-conscious consumers are wary of GMOs, driving demand for non-GMO mung beans, which are often linked with organic farming practices, appealing to those prioritizing sustainability and environmental stewardship. This segment is particularly popular in regions with stringent food safety regulations and strong organic market presence, supported by the perception that non-GMO mung beans are healthier and safer. Conversely, while GMO mung beans hold a smaller market share, they are gaining traction in regions prioritizing agricultural efficiency and yield. Engineered for traits like pest resistance and higher productivity, GMO seeds attract large-scale farmers for their cost efficiency, potentially lowering prices for consumers in price-sensitive regions. However, the GMO segment faces regulatory hurdles and consumer skepticism, especially in markets with strict GMO labeling laws and anti-GMO sentiments, necessitating transparent communication about their safety and benefits.

By Application

The online sale of mung beans is expanding rapidly, driven by the growing popularity of e-commerce platforms and the convenience they offer, allowing consumers to purchase specialty items like mung beans easily. Online sales enable producers and retailers to reach a broader audience, including remote or underserved areas, benefiting niche products and health food markets. E-commerce platforms also provide opportunities to educate consumers about the benefits of mung beans through detailed descriptions, reviews, and nutritional information, enhancing consumer confidence and driving sales. Conversely, offline sales through supermarkets, health food stores, and local markets remain significant, allowing consumers to inspect and select products physically, which can be critical for many shoppers. Physical stores facilitate impulse purchases, with in-store promotions, samples, and displays driving sales. Offline sales are crucial in regions with limited internet access or where traditional shopping habits prevail, ensuring market penetration and brand recognition across diverse consumer segments.

Segments

Based on Type

  • Non-GMO Seed
  • GMO Seed

Based on Application

  • Online Sale
  • Offline Sale

Based on the Geography:

  • North America
    • The U.S.
    • Canada
    • Mexico
  • Europe
    • Germany
    • France
    • The U.K.
    • Italy
    • Spain
    • Rest of Europe
  • Asia Pacific
    • China
    • Japan
    • India
    • South Korea
    • South-east Asia
    • Rest of Asia Pacific
  • Latin America
    • Brazil
    • Argentina
    • Rest of Latin America
  • Middle East & Africa
    • GCC Countries
    • South Africa
    • Rest of the Middle East and Africa

Regional Analysis

Asia-Pacific (55%):

The Asia-Pacific region dominates the global mung beans market, accounting for approximately 55% of the total market share. This dominance is driven by the deep-rooted cultural and dietary significance of mung beans in countries such as China, India, Thailand, and the Philippines. In these countries, mung beans are a staple ingredient used in a variety of traditional dishes, including soups, desserts, and savory snacks. The region’s favorable climatic conditions and well-established agricultural practices further bolster mung bean production. Additionally, the rising health consciousness among consumers in Asia-Pacific has spurred demand for mung beans, known for their nutritional benefits. Governments and agricultural bodies in the region are also promoting the cultivation of mung beans to support food security and sustainable farming practices.

North America (15%):

North America holds around 15% of the global mung beans market share. The growing popularity of plant-based diets and the increasing awareness of the health benefits associated with mung beans have significantly contributed to market growth in this region. The United States, in particular, has seen a surge in demand for mung beans as more consumers seek protein-rich, low-fat alternatives to meat. Mung beans are being incorporated into a variety of health food products, including plant-based protein powders, snacks, and ready-to-eat meals. The expanding ethnic food market and the rising number of health-conscious consumers are key factors driving the market in North America.

Europe (12%):

Europe accounts for approximately 12% of the global mung beans market share. The market in this region is growing steadily as consumers increasingly adopt healthier eating habits and seek out plant-based protein sources. Countries such as Germany, the United Kingdom, and France are leading the demand for mung beans, driven by the trend towards veganism and vegetarianism. The European market is also influenced by the growing ethnic food segment, with mung beans being a popular ingredient in Asian and Middle Eastern cuisines. Additionally, the emphasis on organic and sustainable food products in Europe has led to increased demand for organic mung beans.

Shape Your Report to Specific Countries or Regions & Enjoy 30% Off!

Key players

  • Gaurav International Limited
  • Arkar Oo Co., Ltd.
  • Geo Agrotech
  • YC Consumer Goods Private Limited
  • Llc Agrochiminvest
  • Pulses Exp. Co., Ltd.
  • Shanxi Xinfei Agriculture Development Co. Ltd.
  • AsiaTrade
  • Yesraj Agro Exports Pvt. Ltd.

Competitive Analysis

The global mung beans market is characterized by intense competition among key players, each striving to expand their market share through innovation, quality, and strategic distribution. Gaurav International Limited and Yesraj Agro Exports Pvt. Ltd. leverage their extensive networks and experience in the agricultural sector to maintain a strong market presence. Arkar Oo Co., Ltd. and Shanxi Xinfei Agriculture Development Co. Ltd. focus on high-quality production and sustainable practices, catering to the growing demand for organic mung beans. Companies like Geo Agrotech and Llc Agrochiminvest emphasize technological advancements in processing and packaging to enhance product shelf life and appeal. Pulses Exp. Co., Ltd. and YC Consumer Goods Private Limited capitalize on their robust supply chains to ensure consistent product availability. Asia-Trade stands out by targeting niche markets and expanding its product portfolio to meet diverse consumer needs. This competitive landscape drives continuous improvement and innovation within the mung beans market.

Recent Developments

In March 2023, Gaurav International Limited launched a new line of organic mung beans, targeting health-conscious consumers and expanding their product portfolio. This initiative aligns with the growing demand for organic and sustainably sourced food products. The company invested in advanced farming techniques to ensure high-quality yields and promote environmental sustainability. This move is part of their broader strategy to strengthen their market position and meet the rising consumer preference for organic foods.

In July 2022, Arkar Oo Co., Ltd. announced the completion of their state-of-the-art processing facility in Myanmar. This facility is designed to enhance the quality and efficiency of mung bean processing, enabling the company to meet the increasing global demand. The new plant features advanced sorting and packaging technology, which improves product consistency and extends shelf life. This development supports Arkar Oo Co., Ltd.’s commitment to delivering premium mung beans and expanding their international market reach.

In September 2023, Geo Agrotech introduced a new sustainable farming initiative aimed at reducing the environmental impact of mung bean cultivation. The program includes the adoption of water-efficient irrigation systems and organic fertilizers. This initiative is expected to improve soil health and increase crop yields, aligning with the company’s goals of sustainability and innovation. Geo Agrotech’s efforts demonstrate their dedication to environmental stewardship and their proactive approach to addressing climate change impacts on agriculture.

In February 2024, Yesraj Agro Exports Pvt. Ltd. expanded their export operations to include new markets in Europe and North America. This expansion was facilitated by the establishment of strategic partnerships with local distributors and the launch of a dedicated export division. The move aims to capitalize on the growing demand for mung beans in these regions and enhance the company’s global footprint. Yesraj Agro Exports Pvt. Ltd.’s expansion reflects their commitment to growth and adaptation in a dynamic global market.

Market Concentration and Characteristics

The global mung beans market exhibits a moderate level of market concentration, characterized by the presence of several key players who hold significant market shares, such as Gaurav International Limited, Arkar Oo Co., Ltd., and Yesraj Agro Exports Pvt. Ltd. This market is marked by intense competition, with companies striving to differentiate themselves through product quality, organic certifications, and sustainable farming practices. The market is also distinguished by its diverse application segments, including food, pharmaceuticals, and cosmetics, and is driven by increasing consumer demand for plant-based proteins and health foods. Innovations in food processing and the rising popularity of online sales platforms further shape the market dynamics, ensuring continuous growth and development.

Report Coverage

The research report offers an in-depth analysis based on Type and Application. It details leading market players, providing an overview of their business, product offerings, investments, revenue streams, and key applications. Additionally, the report includes insights into the competitive environment, SWOT analysis, current market trends, as well as the primary drivers and constraints. Furthermore, it discusses various factors that have driven market expansion in recent years. The report also explores market dynamics, regulatory scenarios, and technological advancements that are shaping the industry. It assesses the impact of external factors and global economic changes on market growth. Lastly, it provides strategic recommendations for new entrants and established companies to navigate the complexities of the market.

Future Outlook

  1. The shift towards plant-based and vegan diets is expected to sustain, driving higher demand for mung beans as a versatile protein source.
  1. Consumer preference for organic and non-GMO mung beans will grow, encouraging farmers to adopt organic farming practices and boosting market share.
  1. Increasing health awareness in emerging markets, particularly in Africa and Latin America, will lead to a rise in mung bean consumption and market expansion.
  1. Innovations in farming technology, such as precision agriculture and improved irrigation systems, will enhance mung bean yields and production efficiency.
  1. Companies will continue to develop new mung bean-based products, including snacks, protein supplements, and ready-to-eat meals, catering to diverse consumer preferences.
  1. Expansion of distribution channels, both online and offline, will make mung beans more accessible to a broader audience, supporting market growth.
  1. Increased emphasis on sustainable agricultural practices and eco-friendly packaging will attract environmentally conscious consumers and strengthen market positioning.
  1. Governments will likely implement policies and programs to support mung bean cultivation, research, and development, promoting food security and rural development.
  1. The incorporation of mung beans into functional foods and beverages designed for health benefits will gain traction, appealing to health-focused consumers.
  1. Investment in R&D will lead to the discovery of new applications and benefits of mung beans, driving innovation and opening new market opportunities.

CHAPTER NO. 1 : INTRODUCTION 20

1.1.1. Report Description 20

Purpose of the Report 20

USP & Key Offerings 20

1.1.2. Key Benefits for Stakeholders 20

1.1.3. Target Audience 21

1.1.4. Report Scope 21

1.1.5. Regional Scope 22

CHAPTER NO. 2 : EXECUTIVE SUMMARY 23

2.1. Mung Beans Market Snapshot 23

2.1.1. Global Mung Beans Market, 2018 – 2032 (Kilograms) (USD Million) 24

2.2. Insights from Primary Respondents 25

CHAPTER NO. 3 : GEOPOLITICAL CRISIS IMPACT ANALYSIS 26

3.1. Russia-Ukraine and Israel-Palestine War Impacts 26

CHAPTER NO. 4 : MUNG BEANS MARKET – INDUSTRY ANALYSIS 27

4.1. Introduction 27

4.2. Market Drivers 28

4.2.1. Driving Factor 1 Analysis 28

4.2.2. Driving Factor 2 Analysis 29

4.3. Market Restraints 30

4.3.1. Restraining Factor Analysis 30

4.4. Market Opportunities 31

4.4.1. Market Opportunity Analysis 31

4.5. Porter’s Five Forces Analysis 32

CHAPTER NO. 5 : ANALYSIS COMPETITIVE LANDSCAPE 33

5.1. Company Market Share Analysis – 2023 33

5.1.1. Global Mung Beans Market: Company Market Share, by Volume, 2023 33

5.1.2. Global Mung Beans Market: Company Market Share, by Revenue, 2023 34

5.1.3. Global Mung Beans Market: Top 6 Company Market Share, by Revenue, 2023 34

5.1.4. Global Mung Beans Market: Top 3 Company Market Share, by Revenue, 2023 35

5.2. Global Mung Beans Market Company Volume Market Share, 2023 36

5.3. Global Mung Beans Market Company Revenue Market Share, 2023 37

5.4. Company Assessment Metrics, 2023 38

5.4.1. Stars 38

5.4.2. Emerging Leaders 38

5.4.3. Pervasive Players 38

5.4.4. Participants 38

5.5. Start-ups /SMEs Assessment Metrics, 2023 38

5.5.1. Progressive Companies 38

5.5.2. Responsive Companies 38

5.5.3. Dynamic Companies 38

5.5.4. Starting Blocks 38

5.6. Strategic Developments 39

5.6.1. Acquisitions & Mergers 39

New Product Launch 39

Regional Expansion 39

5.7. Key Players Product Matrix 40

CHAPTER NO. 6 : PESTEL & ADJACENT MARKET ANALYSIS 41

6.1. PESTEL 41

6.1.1. Political Factors 41

6.1.2. Economic Factors 41

6.1.3. Social Factors 41

6.1.4. Technological Factors 41

6.1.5. Environmental Factors 41

6.1.6. Legal Factors 41

6.2. Adjacent Market Analysis 41

CHAPTER NO. 7 : MUNG BEANS MARKET – BY TYPE SEGMENT ANALYSIS 42

7.1. Mung Beans Market Overview, by Type Segment 42

7.1.1. Mung Beans Market Volume Share, By Type, 2023 & 2032 43

7.1.2. Mung Beans Market Revenue Share, By Type, 2023 & 2032 43

7.1.3. Mung Beans Market Attractiveness Analysis, By Type 44

7.1.4. Incremental Revenue Growth Opportunity, by Type, 2024 – 2032 44

7.1.5. Mung Beans Market Revenue, By Type, 2018, 2023, 2027 & 2032 45

7.2. Non-GMO Seed 46

7.2.1. Global Non-GMO Seed Mung Beans Market Volume & Revenue, By Region, 2018 – 2023 (Kilograms) (USD Million) 47

7.2.2. Global Non-GMO Seed Mung Beans Market Volume & Revenue, By Region, 2024 – 2032 (Kilograms) (USD Million) 47

7.3. GMO Seed 48

7.3.1. Global GMO Seed Mung Beans Market Volume & Revenue, By Region, 2018 – 2023 (Kilograms) (USD Million) 49

7.3.2. Global GMO Seed Mung Beans Market Volume & Revenue, By Region, 2024 – 2032 (Kilograms) (USD Million) 49

CHAPTER NO. 8 : MUNG BEANS MARKET – BY APPLICATION SEGMENT ANALYSIS 50

8.1. Mung Beans Market Overview, by Application Segment 50

8.1.1. Mung Beans Market Volume Share, By Application, 2023 & 2032 51

8.1.2. Mung Beans Market Revenue Share, By Application, 2023 & 2032 51

8.1.3. Mung Beans Market Attractiveness Analysis, By Application 52

8.1.4. Incremental Revenue Growth Opportunity, by Application, 2024 – 2032 52

8.1.5. Mung Beans Market Revenue, By Application, 2018, 2023, 2027 & 2032 53

8.2. Online Sale 54

8.2.1. Global Online Sale Mung Beans Market Volume & Revenue, By Region, 2018 – 2023 (Kilograms) (USD Million) 55

8.2.2. Global Online Sale Mung Beans Market Volume & Revenue, By Region, 2024 – 2032 (Kilograms) (USD Million) 55

8.3. Offline Sale 56

8.3.1. Global Offline Sale Mung Beans Market Volume & Revenue, By Region, 2018 – 2023 (Kilograms) (USD Million) 57

8.3.2. Global Offline Sale Mung Beans Market Volume & Revenue, By Region, 2024 – 2032 (Kilograms) (USD Million) 57

CHAPTER NO. 9 : MUNG BEANS MARKET – REGIONAL ANALYSIS 58

9.1. Mung Beans Market Overview, by Regional Segments 58

9.2. Region 59

9.2.1. Global Mung Beans Market Volume Share, By Region, 2023 & 2032 59

9.2.2. Global Mung Beans Market Revenue Share, By Region, 2023 & 2032 59

9.2.3. Mung Beans Market Attractiveness Analysis, By Region 60

9.2.4. Incremental Revenue Growth Opportunity, by Region, 2024 – 2032 60

9.2.5. Mung Beans Market Revenue, By Region, 2018, 2023, 2027 & 2032 61

9.2.6. Global Mung Beans Market Volume & Revenue, By Region, 2018 – 2023 (Kilograms) (USD Million) 62

9.2.7. Global Mung Beans Market Volume & Revenue, By Region, 2024 – 2032 (Kilograms) (USD Million) 62

9.3. Type 63

9.3.1. Global Mung Beans Market Volume & Revenue, By Type, 2018 – 2023 (Kilograms) (USD Million) 63

9.3.2. Global Mung Beans Market Volume & Revenue, By Type, 2024 – 2032 (Kilograms) (USD Million) 63

9.4. Application 64

9.4.1. Global Mung Beans Market Volume & Revenue, By Application, 2018 – 2023 (Kilograms) (USD Million) 64

9.4.2. Global Mung Beans Market Volume & Revenue, By Application, 2024 – 2032 (Kilograms) (USD Million) 64

CHAPTER NO. 10 : MUNG BEANS MARKET – NORTH AMERICA 65

10.1. North America 65

10.1.1. Key Highlights 65

10.1.2. North America Mung Beans Market Volume, By Country, 2018 – 2032 (Kilograms) 66

10.1.3. North America Mung Beans Market Revenue, By Country, 2018 – 2023 (USD Million) 67

10.1.4. North America Mung Beans Market Volume, By Type, 2018 – 2023 (Kilograms) 68

10.1.5. North America Mung Beans Market Revenue, By Type, 2018 – 2023 (USD Million) 69

10.1.6. North America Mung Beans Market Volume, By Application, 2018 – 2023 (Kilograms) 70

10.1.7. North America Mung Beans Market Revenue, By Application, 2018 – 2023 (USD Million) 71

10.2. U.S. 72

10.3. Canada 72

10.4. Mexico 72

CHAPTER NO. 11 : MUNG BEANS MARKET – EUROPE 73

11.1. Europe 73

11.1.1. Key Highlights 73

11.1.2. Europe Mung Beans Market Volume, By Country, 2018 – 2032 (Kilograms) 74

11.1.3. Europe Mung Beans Market Revenue, By Country, 2018 – 2023 (USD Million) 75

11.1.4. Europe Mung Beans Market Volume, By Type, 2018 – 2023 (Kilograms) 76

11.1.5. Europe Mung Beans Market Revenue, By Type, 2018 – 2023 (USD Million) 77

11.1.6. Europe Mung Beans Market Volume, By Application, 2018 – 2023 (Kilograms) 78

11.1.7. Europe Mung Beans Market Revenue, By Application, 2018 – 2023 (USD Million) 79

11.2. UK 80

11.3. France 80

11.4. Germany 80

11.5. Italy 80

11.6. Spain 80

11.7. Russia 80

11.8. Belgium 80

11.9. Netherland 80

11.10. Austria 80

11.11. Sweden 80

11.12. Poland 80

11.13. Denmark 80

11.14. Switzerland 80

11.15. Rest of Europe 80

CHAPTER NO. 12 : MUNG BEANS MARKET – ASIA PACIFIC 81

12.1. Asia Pacific 81

12.1.1. Key Highlights 81

12.1.2. Asia Pacific Mung Beans Market Volume, By Country, 2018 – 2032 (Kilograms) 82

12.1.3. Asia Pacific Mung Beans Market Revenue, By Country, 2018 – 2023 (USD Million) 83

12.1.4. Asia Pacific Mung Beans Market Volume, By Type, 2018 – 2023 (Kilograms) 84

12.1.5. Asia Pacific Mung Beans Market Revenue, By Type, 2018 – 2023 (USD Million) 85

12.1.6. Asia Pacific Mung Beans Market Volume, By Application, 2018 – 2023 (Kilograms) 86

12.1.7. Asia Pacific Mung Beans Market Revenue, By Application, 2018 – 2023 (USD Million) 87

12.2. China 88

12.3. Japan 88

12.4. South Korea 88

12.5. India 88

12.6. Australia 88

12.7. Thailand 88

12.8. Indonesia 88

12.9. Vietnam 88

12.10. Malaysia 88

12.11. Philippines 88

12.12. Taiwan 88

12.13. Rest of Asia Pacific 88

CHAPTER NO. 13 : MUNG BEANS MARKET – LATIN AMERICA 89

13.1. Latin America 89

13.1.1. Key Highlights 89

13.1.2. Latin America Mung Beans Market Volume, By Country, 2018 – 2032 (Kilograms) 90

13.1.3. Latin America Mung Beans Market Revenue, By Country, 2018 – 2023 (USD Million) 91

13.1.4. Latin America Mung Beans Market Volume, By Type, 2018 – 2023 (Kilograms) 92

13.1.5. Latin America Mung Beans Market Revenue, By Type, 2018 – 2023 (USD Million) 93

13.1.6. Latin America Mung Beans Market Volume, By Application, 2018 – 2023 (Kilograms) 94

13.1.7. Latin America Mung Beans Market Revenue, By Application, 2018 – 2023 (USD Million) 95

13.2. Brazil 96

13.3. Argentina 96

13.4. Peru 96

13.5. Chile 96

13.6. Colombia 96

13.7. Rest of Latin America 96

CHAPTER NO. 14 : MUNG BEANS MARKET – MIDDLE EAST 97

14.1. Middle East 97

14.1.1. Key Highlights 97

14.1.2. Middle East Mung Beans Market Volume, By Country, 2018 – 2032 (Kilograms) 98

14.1.3. Middle East Mung Beans Market Revenue, By Country, 2018 – 2023 (USD Million) 99

14.1.4. Middle East Mung Beans Market Volume, By Type, 2018 – 2023 (Kilograms) 100

14.1.5. Middle East Mung Beans Market Revenue, By Type, 2018 – 2023 (USD Million) 101

14.1.6. Middle East Mung Beans Market Volume, By Application, 2018 – 2023 (Kilograms) 102

14.1.7. Middle East Mung Beans Market Revenue, By Application, 2018 – 2023 (USD Million) 103

14.2. UAE 104

14.3. KSA 104

14.4. Israel 104

14.5. Turkey 104

14.6. Iran 104

14.7. Rest of Middle East 104

CHAPTER NO. 15 : MUNG BEANS MARKET – AFRICA 105

15.1. Africa 105

15.1.1. Key Highlights 105

15.1.2. Africa Mung Beans Market Volume, By Country, 2018 – 2032 (Kilograms) 106

15.1.3. Africa Mung Beans Market Revenue, By Country, 2018 – 2023 (USD Million) 107

15.1.4. Africa Mung Beans Market Volume, By Type, 2018 – 2023 (Kilograms) 108

15.1.5. Africa Mung Beans Market Revenue, By Type, 2018 – 2023 (USD Million) 109

15.1.6. Africa Mung Beans Market Volume, By Application, 2018 – 2023 (Kilograms) 110

15.1.7. Africa Mung Beans Market Revenue, By Application, 2018 – 2023 (USD Million) 111

15.2. Egypt 112

15.3. Nigeria 112

15.4. Algeria 112

15.5. Morocco 112

15.6. Rest of Africa 112

CHAPTER NO. 16 : COMPANY PROFILES 113

16.1. Australian Mungbean Company 113

16.1.1. Company Overview 113

16.1.2. Product Portfolio 113

16.1.3. Swot Analysis 113

16.1.4. Business Strategy 113

16.1.5. Financial Overview 114

16.2. Gaurav International Limited 115

16.3. Arkar Oo Co., Ltd. 115

16.4. Geo Agrotech 115

16.5. YC Consumer Goods Private Limited 115

16.6. Llc Agrochiminvest 115

16.7. Pulses Exp. Co., Ltd. 115

16.8. Shanxi Xinfei Agriculture Development Co.ltd 115

16.9. Asia-Trade 115

16.10. Yesraj Agro Exports Pvt. Ltd. 115

CHAPTER NO. 17 : RESEARCH METHODOLOGY 116

17.1. Research Methodology 116

17.1.1. Phase I – Secondary Research 117

17.1.2. Phase II – Data Modeling 117

Company Share Analysis Model 118

Revenue Based Modeling 118

17.1.3. Phase III – Primary Research 119

17.1.4. Research Limitations 120

Assumptions 120

List of Figures

FIG NO. 1. Global Mung Beans Market Volume & Revenue, 2018 – 2032 (Kilograms) (USD Million) 24

FIG NO. 2. Porter’s Five Forces Analysis for Global Mung Beans Market 32

FIG NO. 3. Company Share Analysis, 2023 33

FIG NO. 4. Company Share Analysis, 2023 34

FIG NO. 5. Company Share Analysis, 2023 34

FIG NO. 6. Company Share Analysis, 2023 35

FIG NO. 7. Mung Beans Market – Company Volume  Market Share, 2023 36

FIG NO. 8. Mung Beans Market – Company Revenue Market Share, 2023 37

FIG NO. 9. Mung Beans Market Volume Share, By Type, 2023 & 2032 43

FIG NO. 10. Mung Beans Market Revenue Share, By Type, 2023 & 2032 43

FIG NO. 11. Market Attractiveness Analysis, By Type 44

FIG NO. 12. Incremental Revenue Growth Opportunity by Type, 2024 – 2032 44

FIG NO. 13. Mung Beans Market Revenue, By Type, 2018, 2023, 2027 & 2032 45

FIG NO. 14. Global Mung Beans Market for Non-GMO Seed, Volume & Revenue (Kilograms) (USD Million) 2018 – 2032 46

FIG NO. 15. Global Mung Beans Market for GMO Seed, Volume & Revenue (Kilograms) (USD Million) 2018 – 2032 48

FIG NO. 16. Mung Beans Market Volume Share, By Application, 2023 & 2032 51

FIG NO. 17. Mung Beans Market Revenue Share, By Application, 2023 & 2032 51

FIG NO. 18. Market Attractiveness Analysis, By Application 52

FIG NO. 19. Incremental Revenue Growth Opportunity by Application, 2024 – 2032 52

FIG NO. 20. Mung Beans Market Revenue, By Application, 2018, 2023, 2027 & 2032 53

FIG NO. 21. Global Mung Beans Market for Online Sale, Volume & Revenue (Kilograms) (USD Million) 2018 – 2032 54

FIG NO. 22. Global Mung Beans Market for Offline Sale, Volume & Revenue (Kilograms) (USD Million) 2018 – 2032 56

FIG NO. 23. Global Mung Beans Market Volume Share, By Region, 2023 & 2032 59

FIG NO. 24. Global Mung Beans Market Revenue Share, By Region, 2023 & 2032 59

FIG NO. 25. Market Attractiveness Analysis, By Region 60

FIG NO. 26. Incremental Revenue Growth Opportunity by Region, 2024 – 2032 60

FIG NO. 27. Mung Beans Market Revenue, By Region, 2018, 2023, 2027 & 2032 61

FIG NO. 28. North America Mung Beans Market Volume & Revenue, 2018 – 2032 (Kilograms) (USD Million) 65

FIG NO. 29. Europe Mung Beans Market Volume & Revenue, 2018 – 2032 (Kilograms) (USD Million) 73

FIG NO. 30. Asia Pacific Mung Beans Market Volume & Revenue, 2018 – 2032 (Kilograms) (USD Million) 81

FIG NO. 31. Latin America Mung Beans Market Volume & Revenue, 2018 – 2032 (Kilograms) (USD Million) 89

FIG NO. 32. Middle East Mung Beans Market Volume & Revenue, 2018 – 2032 (Kilograms) (USD Million) 97

FIG NO. 33. Africa Mung Beans Market Volume & Revenue, 2018 – 2032 (Kilograms) (USD Million) 105

FIG NO. 34. Research Methodology – Detailed View 116

FIG NO. 35. Research Methodology 117

List of Tables

TABLE NO. 1. : Global Mung Beans Market: Snapshot 23

TABLE NO. 2. : Drivers for the Mung Beans Market: Impact Analysis 28

TABLE NO. 3. : Restraints for the Mung Beans Market: Impact Analysis 30

TABLE NO. 4. : Global Non-GMO Seed Mung Beans Market Volume & Revenue, By Region, 2018 – 2023 (Kilograms) (USD Million) 47

TABLE NO. 5. : Global Non-GMO Seed Mung Beans Market Volume & Revenue, By Region, 2024 – 2032 (Kilograms) (USD Million) 47

TABLE NO. 6. : Global GMO Seed Mung Beans Market Volume & Revenue, By Region, 2018 – 2023 (Kilograms) (USD Million) 49

TABLE NO. 7. : Global GMO Seed Mung Beans Market Volume & Revenue, By Region, 2024 – 2032 (Kilograms) (USD Million) 49

TABLE NO. 8. : Global Online Sale Mung Beans Market Volume & Revenue, By Region, 2018 – 2023 (Kilograms) (USD Million) 55

TABLE NO. 9. : Global Online Sale Mung Beans Market Volume & Revenue, By Region, 2024 – 2032 (Kilograms) (USD Million) 55

TABLE NO. 10. : Global Offline Sale Mung Beans Market Volume & Revenue, By Region, 2018 – 2023 (Kilograms) (USD Million) 57

TABLE NO. 11. : Global Offline Sale Mung Beans Market Volume & Revenue, By Region, 2024 – 2032 (Kilograms) (USD Million) 57

TABLE NO. 12. : Global Mung Beans Market Volume & Revenue, By Region, 2018 – 2023 (Kilograms) (USD Million) 62

TABLE NO. 13. : Global Mung Beans Market Volume & Revenue, By Region, 2024 – 2032 (Kilograms) (USD Million) 62

TABLE NO. 14. : Global Mung Beans Market Volume & Revenue, By Type, 2018 – 2023 (Kilograms) (USD Million) 63

TABLE NO. 15. : Global Mung Beans Market Volume & Revenue, By Type, 2024 – 2032 (Kilograms) (USD Million) 63

TABLE NO. 16. : Global Mung Beans Market Volume & Revenue, By Application, 2018 – 2023 (Kilograms) (USD Million) 64

TABLE NO. 17. : Global Mung Beans Market Volume & Revenue, By Application, 2024 – 2032 (Kilograms) (USD Million) 64

TABLE NO. 18. : North America Mung Beans Market Volume, By Country, 2018 – 2023 (Kilograms) 66

TABLE NO. 19. : North America Mung Beans Market Volume, By Country, 2024 – 2032 (Kilograms) 66

TABLE NO. 20. : North America Mung Beans Market Revenue, By Country, 2018 – 2023 (USD Million) 67

TABLE NO. 21. : North America Mung Beans Market Revenue, By Country, 2024 – 2032 (USD Million) 67

TABLE NO. 22. : North America Mung Beans Market Volume, By Type, 2018 – 2023 (Kilograms) 68

TABLE NO. 23. : North America Mung Beans Market Volume, By Type, 2024 – 2032 (Kilograms) 68

TABLE NO. 24. : North America Mung Beans Market Revenue, By Type, 2018 – 2023 (USD Million) 69

TABLE NO. 25. : North America Mung Beans Market Revenue, By Type, 2024 – 2032 (USD Million) 69

TABLE NO. 26. : North America Mung Beans Market Volume, By Application, 2018 – 2023 (Kilograms) 70

TABLE NO. 27. : North America Mung Beans Market Volume, By Application, 2024 – 2032 (Kilograms) 70

TABLE NO. 28. : North America Mung Beans Market Revenue, By Application, 2018 – 2023 (USD Million) 71

TABLE NO. 29. : North America Mung Beans Market Revenue, By Application, 2024 – 2032 (USD Million) 71

TABLE NO. 30. : Europe Mung Beans Market Volume, By Country, 2018 – 2023 (Kilograms) 74

TABLE NO. 31. : Europe Mung Beans Market Volume, By Country, 2024 – 2032 (Kilograms) 74

TABLE NO. 32. : Europe Mung Beans Market Revenue, By Country, 2018 – 2023 (USD Million) 75

TABLE NO. 33. : Europe Mung Beans Market Revenue, By Country, 2024 – 2032 (USD Million) 75

TABLE NO. 34. : Europe Mung Beans Market Volume, By Type, 2018 – 2023 (Kilograms) 76

TABLE NO. 35. : Europe Mung Beans Market Volume, By Type, 2024 – 2032 (Kilograms) 76

TABLE NO. 36. : Europe Mung Beans Market Revenue, By Type, 2018 – 2023 (USD Million) 77

TABLE NO. 37. : Europe Mung Beans Market Revenue, By Type, 2024 – 2032 (USD Million) 77

TABLE NO. 38. : Europe Mung Beans Market Volume, By Application, 2018 – 2023 (Kilograms) 78

TABLE NO. 39. : Europe Mung Beans Market Volume, By Application, 2024 – 2032 (Kilograms) 78

TABLE NO. 40. : Europe Mung Beans Market Revenue, By Application, 2018 – 2023 (USD Million) 79

TABLE NO. 41. : Europe Mung Beans Market Revenue, By Application, 2024 – 2032 (USD Million) 79

TABLE NO. 42. : Asia Pacific Mung Beans Market Volume, By Country, 2018 – 2023 (Kilograms) 82

TABLE NO. 43. : Asia Pacific Mung Beans Market Volume, By Country, 2024 – 2032 (Kilograms) 82

TABLE NO. 44. : Asia Pacific Mung Beans Market Revenue, By Country, 2018 – 2023 (USD Million) 83

TABLE NO. 45. : Asia Pacific Mung Beans Market Revenue, By Country, 2024 – 2032 (USD Million) 83

TABLE NO. 46. : Asia Pacific Mung Beans Market Volume, By Type, 2018 – 2023 (Kilograms) 84

TABLE NO. 47. : Asia Pacific Mung Beans Market Volume, By Type, 2024 – 2032 (Kilograms) 84

TABLE NO. 48. : Asia Pacific Mung Beans Market Revenue, By Type, 2018 – 2023 (USD Million) 85

TABLE NO. 49. : Asia Pacific Mung Beans Market Revenue, By Type, 2024 – 2032 (USD Million) 85

TABLE NO. 50. : Asia Pacific Mung Beans Market Volume, By Application, 2018 – 2023 (Kilograms) 86

TABLE NO. 51. : Asia Pacific Mung Beans Market Volume, By Application, 2024 – 2032 (Kilograms) 86

TABLE NO. 52. : Asia Pacific Mung Beans Market Revenue, By Application, 2018 – 2023 (USD Million) 87

TABLE NO. 53. : Asia Pacific Mung Beans Market Revenue, By Application, 2024 – 2032 (USD Million) 87

TABLE NO. 54. : Latin America Mung Beans Market Volume, By Country, 2018 – 2023 (Kilograms) 90

TABLE NO. 55. : Latin America Mung Beans Market Volume, By Country, 2024 – 2032 (Kilograms) 90

TABLE NO. 56. : Latin America Mung Beans Market Revenue, By Country, 2018 – 2023 (USD Million) 91

TABLE NO. 57. : Latin America Mung Beans Market Revenue, By Country, 2024 – 2032 (USD Million) 91

TABLE NO. 58. : Latin America Mung Beans Market Volume, By Type, 2018 – 2023 (Kilograms) 92

TABLE NO. 59. : Latin America Mung Beans Market Volume, By Type, 2024 – 2032 (Kilograms) 92

TABLE NO. 60. : Latin America Mung Beans Market Revenue, By Type, 2018 – 2023 (USD Million) 93

TABLE NO. 61. : Latin America Mung Beans Market Revenue, By Type, 2024 – 2032 (USD Million) 93

TABLE NO. 62. : Latin America Mung Beans Market Volume, By Application, 2018 – 2023 (Kilograms) 94

TABLE NO. 63. : Latin America Mung Beans Market Volume, By Application, 2024 – 2032 (Kilograms) 94

TABLE NO. 64. : Latin America Mung Beans Market Revenue, By Application, 2018 – 2023 (USD Million) 95

TABLE NO. 65. : Latin America Mung Beans Market Revenue, By Application, 2024 – 2032 (USD Million) 95

TABLE NO. 66. : Middle East Mung Beans Market Volume, By Country, 2018 – 2023 (Kilograms) 98

TABLE NO. 67. : Middle East Mung Beans Market Volume, By Country, 2024 – 2032 (Kilograms) 98

TABLE NO. 68. : Middle East Mung Beans Market Revenue, By Country, 2018 – 2023 (USD Million) 99

TABLE NO. 69. : Middle East Mung Beans Market Revenue, By Country, 2024 – 2032 (USD Million) 99

TABLE NO. 70. : Middle East Mung Beans Market Volume, By Type, 2018 – 2023 (Kilograms) 100

TABLE NO. 71. : Middle East Mung Beans Market Volume, By Type, 2024 – 2032 (Kilograms) 100

TABLE NO. 72. : Middle East Mung Beans Market Revenue, By Type, 2018 – 2023 (USD Million) 101

TABLE NO. 73. : Middle East Mung Beans Market Revenue, By Type, 2024 – 2032 (USD Million) 101

TABLE NO. 74. : Middle East Mung Beans Market Volume, By Application, 2018 – 2023 (Kilograms) 102

TABLE NO. 75. : Middle East Mung Beans Market Volume, By Application, 2024 – 2032 (Kilograms) 102

TABLE NO. 76. : Middle East Mung Beans Market Revenue, By Application, 2018 – 2023 (USD Million) 103

TABLE NO. 77. : Middle East Mung Beans Market Revenue, By Application, 2024 – 2032 (USD Million) 103

TABLE NO. 78. : Africa Mung Beans Market Volume, By Country, 2018 – 2023 (Kilograms) 106

TABLE NO. 79. : Africa Mung Beans Market Volume, By Country, 2024 – 2032 (Kilograms) 106

TABLE NO. 80. : Africa Mung Beans Market Revenue, By Country, 2018 – 2023 (USD Million) 107

TABLE NO. 81. : Africa Mung Beans Market Revenue, By Country, 2024 – 2032 (USD Million) 107

TABLE NO. 82. : Africa Mung Beans Market Volume, By Type, 2018 – 2023 (Kilograms) 108

TABLE NO. 83. : Africa Mung Beans Market Volume, By Type, 2024 – 2032 (Kilograms) 108

TABLE NO. 84. : Africa Mung Beans Market Revenue, By Type, 2018 – 2023 (USD Million) 109

TABLE NO. 85. : Africa Mung Beans Market Revenue, By Type, 2024 – 2032 (USD Million) 109

TABLE NO. 86. : Africa Mung Beans Market Volume, By Application, 2018 – 2023 (Kilograms) 110

TABLE NO. 87. : Africa Mung Beans Market Volume, By Application, 2024 – 2032 (Kilograms) 110

TABLE NO. 88. : Africa Mung Beans Market Revenue, By Application, 2018 – 2023 (USD Million) 111

TABLE NO. 89. : Africa Mung Beans Market Revenue, By Application, 2024 – 2032 (USD Million) 111

Frequently asked questions

What is the projected growth of the global mung beans market?

The Global Mung Beans Market is projected to grow from USD 3,987.61 million in 2023 to USD 5,626.69 million by 2032, with a CAGR of 3.90% from 2024 to 2032.

What are the primary drivers of the mung beans market?

The primary drivers include increasing health and nutritional awareness, the rise in plant-based diets, and the demand for organic and sustainable food products.

Which region holds the largest market share in the global mung beans market?

The Asia-Pacific region holds the largest market share, accounting for approximately 55% of the global market, driven by high consumption in countries like China, India, and Thailand.

What challenges does the mung beans market face?

The mung beans market faces challenges such as dependence on favorable climatic conditions, limited awareness in some regions, supply chain and logistics issues, and competition from other protein sources.

Who are some key players in the global mung beans market?

Key players include Gaurav International Limited, Arkar Oo Co., Ltd., Geo Agrotech, YC Consumer Goods Private Limited, and Yesraj Agro Exports Pvt. Ltd. These companies focus on product innovation, quality, and strategic distribution.

Non-Alcoholic Malt Beverages Market

Published:
Report ID: 69473

Non-GMO Verified Sports Drinks Market

Published:
Report ID: 69467

Ammonium Chloride Food Grade market

Published:
Report ID: 69137

Beverage Processing Polymers market

Published:
Report ID: 69111

Natural Food and Beverage Preservatives Market

Published:
Report ID: 68874

Food and Beverages Color Fixing Agents Market

Published:
Report ID: 68769

Lactose Free Probiotic Yogurt Market

Published:
Report ID: 68399

Pre-Mixed RTD Alcoholic Drinks Market

Published:
Report ID: 68315

Fortified Milk and Milk Products Market

Published:
Report ID: 68299

Food and Beverage Air Filtration Market

Published:
Report ID: 68292

Microparticulated Whey Protein Market

Published:
Report ID: 68176

Artificial Preservative Market

Published:
Report ID: 67877

Purchase Options

The report comes as a view-only PDF document, optimized for individual clients. This version is recommended for personal digital use and does not allow printing.
$4699

To meet the needs of modern corporate teams, our report comes in two formats: a printable PDF and a data-rich Excel sheet. This package is optimized for internal analysis and multi-location access, making it an excellent choice for organizations with distributed workforce.
$5699

The report will be delivered in printable PDF format along with the report’s data Excel sheet. This license offers 100 Free Analyst hours where the client can utilize Credence Research Inc.’s research team. It is highly recommended for organizations seeking to execute short, customized research projects related to the scope of the purchased report.
$7699

Smallform of Sample request

Have a question?

User Profile

Don’t settle for less – trust Mitul to help you find the best solution.

Report delivery within 24 to 48 hours

– Other Info –

What people say?-

User Review

I am very impressed with the information in this report. The author clearly did their research when they came up with this product and it has already given me a lot of ideas.

Jana Schmidt
CEDAR CX Technologies

– Connect with us –

Phone

+91 6232 49 3207


support

24/7 Research Support


sales@credenceresearch.com

– Research Methodology –

Going beyond the basics: advanced techniques in research methodology

– Trusted By –

Pepshi, LG, Nestle
Motorola, Honeywell, Johnson and johnson
LG Chem, SIEMENS, Pfizer
Unilever, Samsonite, QIAGEN