
Natural Gas Filter Market Overview:
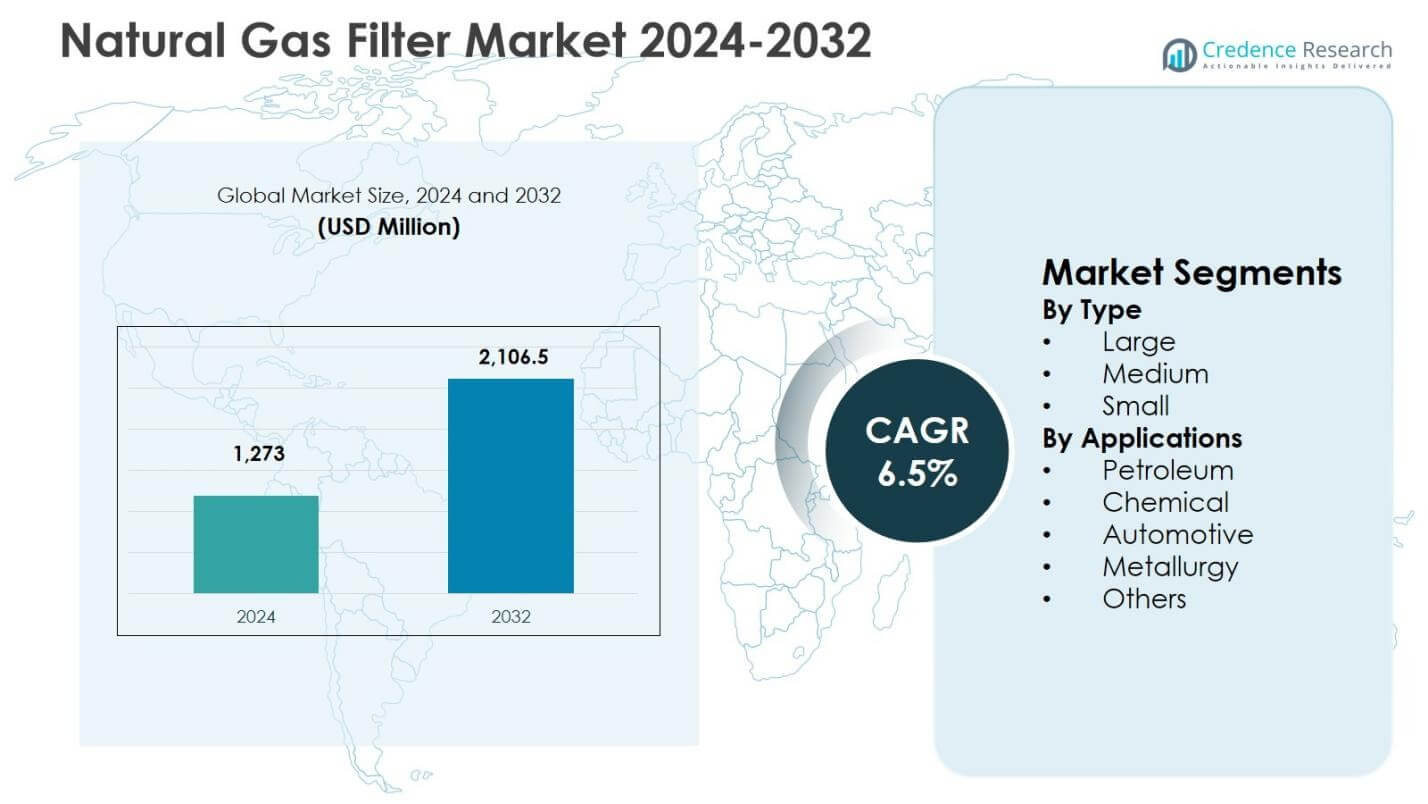
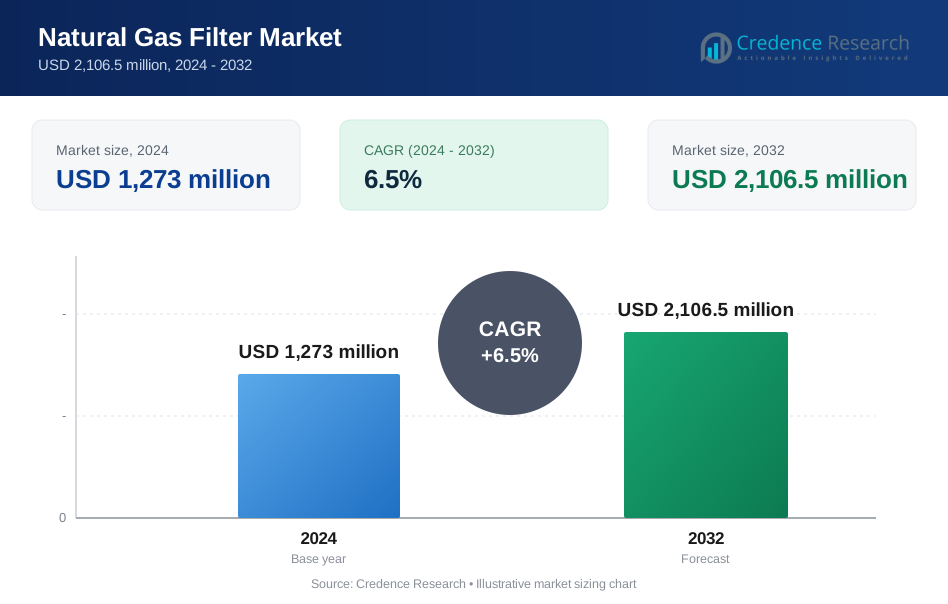
Natural Gas Filter Market size was valued at USD 1,273 million in 2024 and is anticipated to reach USD 2,106.5 million by 2032, registering a CAGR of 6.5% during the forecast period.
| REPORT ATTRIBUTE | DETAILS |
|---|---|
| Historical Period | 2020-2023 |
| Base Year | 2024 |
| Forecast Period | 2025-2032 |
| Natural Gas Filter Market Size 2024 | USD 1,273 million |
| Natural Gas Filter Market, CAGR | 6.5% |
| Natural Gas Filter Market Size 2032 | USD 2,106.5 million |
Natural Gas Filter Market Insights
- Market growth is driven by expansion of natural gas pipelines, LNG terminals, and city gas distribution networks, increasing demand for filtration systems to protect compressors, turbines, and metering equipment and ensure gas quality compliance.
- Large filters dominated the market with a 2% segment share in 2024, followed by medium filters at 34.5% and small filters at 19.3%, reflecting higher adoption of high-capacity filtration systems in gas processing and transmission applications.
- Leading manufacturers focus on advanced filter media, coalescing technologies, and high-pressure systems, while cost pressures and customization complexity remain key restraints affecting adoption among small and mid-scale operators.
- North America led with 6% regional share in 2024, followed by Europe at 26.1%, Asia Pacific at 24.8%, Latin America at 8.7%, and Middle East & Africa at 5.8%, driven by infrastructure development and industrial gas usage.
Natural Gas Filter Market Segmentation Analysis:
By Type:
The Natural Gas Filter Market by type is led by Large filters, which accounted for 46.2% market share in 2024, driven by their extensive deployment in gas processing plants, transmission pipelines, and large-scale industrial facilities requiring high-capacity filtration and contaminant removal. Large filters support higher flow rates and longer service intervals, making them cost-effective for continuous operations. Medium filters held 34.5% share, supported by rising adoption across midstream infrastructure and regional distribution networks. Small filters captured 19.3% share, primarily used in localized applications and compact systems where space constraints and lower throughput requirements dominate.
- For instance, Donaldson Company provides medium pressure spin-on filters like Duramax®, rated up to 2,000 psi for in-line cartridge applications in gas processing systems, ensuring reliable performance in midstream operations with flows up to 30 gpm.
By Applications:
By application, the Petroleum segment dominated with a 38.7% market share in 2024, supported by stringent gas quality requirements across upstream, midstream, and downstream operations to protect compressors, turbines, and metering equipment. The Chemical segment followed with 24.9% share, driven by growing use of natural gas as a feedstock and fuel in process industries. Automotive applications accounted for 16.8%, supported by expanding natural gas vehicle infrastructure. Metallurgy held 11.2% share, while Others contributed 8.4%, reflecting diversified industrial usage.
- For instance, Axens supplies TEG absorption and molecular sieve solutions for chemical plants processing sweet and sour natural gases onshore and offshore. These systems handle varying CO2/H2S levels to ensure dry gas quality for reactions without corrosion risks.
Key Growth Drivers
Expansion of Natural Gas Infrastructure
The rapid expansion of global natural gas infrastructure strongly drives demand in the Natural Gas Filter Market. Rising investments in gas transmission pipelines, LNG terminals, gas storage facilities, and city gas distribution networks increase the need for high-efficiency filtration systems to remove particulates, liquids, and contaminants. Filters play a critical role in protecting compressors, turbines, meters, and valves, ensuring uninterrupted operations and reducing equipment failure. Emerging economies are accelerating pipeline development and gas grid expansion to support energy security and cleaner fuel adoption, directly stimulating sustained demand for advanced natural gas filtration solutions.
- For instance, Enbridge is expanding its Aitken Creek gas storage facility in British Columbia with a C$0.3-billion investment, adding 40 billion cubic feet of capacity to aid LNG exports like Cedar LNG.
Stringent Quality and Safety Regulations
Strict regulatory frameworks governing natural gas quality and industrial safety significantly boost market growth. Regulatory bodies mandate precise filtration standards to control moisture, solid particles, and corrosive elements before gas enters processing units or end-use systems. Compliance requirements across petroleum refining, chemical processing, power generation, and gas distribution compel operators to deploy reliable filtration systems. Increasing enforcement of safety norms and operational efficiency standards encourages upgrades from conventional filters to high-performance designs, supporting consistent replacement demand and long-term adoption across regulated industrial environments.
- For instance, Alto Garda Power upgraded their LM6000 gas turbine filtration to a 2-stage static system to meet environmental and operational regulations.
Rising Industrial Consumption of Natural Gas
Growing industrial reliance on natural gas as a primary fuel and feedstock drives the Natural Gas Filter Market. Industries such as chemicals, metallurgy, automotive manufacturing, and power generation favor natural gas due to its lower emissions, cost efficiency, and stable supply. Increased usage heightens the need for effective filtration to prevent equipment damage and maintain process efficiency. As industrial plants expand capacity and modernize systems, demand for durable and high-capacity filters rises, reinforcing steady market growth across both developed and developing industrial regions.
Key Trends & Opportunities
Technological Advancements in Filtration Systems
Continuous innovation in filtration technologies creates significant growth opportunities in the Natural Gas Filter Market. Manufacturers increasingly develop high-efficiency coalescing filters, advanced media materials, and multi-stage filtration systems capable of handling higher pressures and flow rates. Smart monitoring features integrated with sensors and predictive maintenance tools enhance operational reliability and reduce downtime. These advancements allow end users to optimize performance, extend filter life, and lower maintenance costs, making technologically advanced filtration solutions increasingly attractive across large-scale and midstream applications.
- For instance, Parker Hannifin’s P3X and Finite series filters utilize advanced microfiber coalescing elements that achieve up to 99.99% removal efficiency for oil aerosols and particulates, even in demanding gas processing environments.
Growth of LNG and Clean Energy Transition
The expanding liquefied natural gas sector and the global shift toward cleaner energy sources present strong opportunities for market expansion. LNG processing and transportation require stringent filtration to maintain gas purity and protect sensitive cryogenic equipment. Simultaneously, government initiatives promoting natural gas as a transition fuel accelerate investments in gas-based power plants and distribution networks. This trend increases demand for specialized filtration systems, positioning the Natural Gas Filter Market to benefit from long-term clean energy and decarbonization strategies.
- For instance, Filtration Group supplied PuraGrid carbon filters and Drop Safe moisture barrier prefilters to CYDSA's co-generation power plant, eliminating over 90% of contaminants and raising uptime to 92-94% from prior failures.
Key Challenges
High Installation and Maintenance Costs
High initial installation and ongoing maintenance costs pose a notable challenge for the Natural Gas Filter Market. Advanced filtration systems require specialized materials, precision engineering, and regular replacement of filter elements, increasing total ownership costs. Small and mid-scale operators often face budget constraints, limiting adoption of high-performance filters. Additionally, maintenance downtime during filter replacement can impact operational efficiency, prompting end users to delay upgrades or opt for lower-cost alternatives, which may restrict market penetration in cost-sensitive regions.
Operational Complexity and Customization Requirements
The need for application-specific customization creates operational challenges for filter manufacturers and end users. Natural gas composition varies significantly across sources and regions, requiring tailored filtration solutions to address specific contaminants. Designing and deploying customized systems increases engineering complexity and lead times. Improper filter selection or integration can result in performance inefficiencies and equipment damage. These challenges demand strong technical expertise and collaboration, which can slow decision-making and adoption, particularly among operators lacking in-house technical capabilities.
Regional Analysis
North America
North America held 34.6% market share in 2024, supported by extensive natural gas production, mature pipeline networks, and high adoption of advanced filtration technologies. Strong shale gas activities across the United States and Canada drive consistent demand for natural gas filters to protect compressors, turbines, and metering systems. Stringent safety and gas quality regulations further reinforce filter replacement and upgrade cycles. The region also benefits from high investments in LNG export terminals and gas-fired power plants, sustaining demand for large-capacity and high-efficiency filtration systems across upstream, midstream, and downstream operations.
Europe
Europe accounted for 26.1% market share in 2024, driven by strict environmental regulations and growing focus on energy security. Countries across Western and Northern Europe emphasize gas quality compliance to support industrial processes, power generation, and residential distribution networks. Expansion of LNG import infrastructure and cross-border pipeline interconnections increases filtration demand across transmission systems. Industrial sectors such as chemicals, metallurgy, and manufacturing further contribute to steady adoption. Continuous modernization of aging gas infrastructure and strong regulatory enforcement support sustained demand for reliable and high-performance natural gas filtration solutions across the region.
Asia Pacific
Asia Pacific captured 24.8% market share in 2024, reflecting rapid industrialization, urban expansion, and increasing natural gas consumption. Countries such as China, India, Japan, and South Korea are expanding gas distribution networks and LNG import capacity to meet rising energy demand. Industrial growth across chemicals, automotive manufacturing, and metallurgy increases the need for effective filtration to ensure operational efficiency. Government initiatives promoting cleaner fuels accelerate gas-based power generation and city gas projects, strengthening demand for natural gas filters across large, medium, and small-scale installations throughout the region.
Latin America
Latin America represented 8.7% market share in 2024, supported by expanding gas exploration and infrastructure development in countries such as Brazil, Argentina, and Mexico. Growth in offshore gas production and pipeline expansion projects drives demand for filtration systems to maintain gas quality and equipment reliability. Industrial applications across petroleum refining and chemicals further support market growth. Increasing investments in gas-fired power plants and regional energy diversification strategies enhance adoption. However, market expansion remains influenced by investment cycles and regulatory stability across individual countries within the region.
Middle East & Africa
The Middle East & Africa held 5.8% market share in 2024, driven by large-scale natural gas production and processing activities. Countries across the Middle East focus on gas processing, LNG exports, and industrial diversification, creating strong demand for high-capacity filtration systems. Filtration plays a critical role in protecting processing equipment under harsh operating conditions. In Africa, gradual expansion of gas infrastructure and power generation projects supports steady growth. Ongoing investments in upstream and midstream developments continue to drive long-term demand across the region.
Natural Gas Filter Market Segmentations:
By Type
- Large
- Medium
- Small
By Applications
- Petroleum
- Chemical
- Automotive
- Metallurgy
- Others
By Geography
- North America
- U.S.
- Canada
- Mexico
- Europe
- Germany
- France
- U.K.
- Italy
- Spain
- Rest of Europe
- Asia Pacific
- China
- Japan
- India
- South Korea
- South-east Asia
- Rest of Asia Pacific
- Latin America
- Brazil
- Argentina
- Rest of Latin America
- Middle East & Africa
- GCC Countries
- South Africa
- Rest of the Middle East and Africa
Competitive Landscape
Competitive landscape of the Natural Gas Filter Market is characterized by the presence of Parker Hannifin Corporation, Donaldson Company, Inc., MANN+HUMMEL Group, Camfil AB, Filtration Group Corporation, Eaton Corporation plc, Honeywell International Inc., AAF International, Pall Corporation, and 3M Company. The market remains moderately consolidated, with leading players focusing on product reliability, filtration efficiency, and lifecycle performance to strengthen their positions. Companies invest heavily in advanced filter media, coalescing technologies, and high-pressure filtration systems to address evolving gas quality standards across upstream, midstream, and downstream operations. Strategic initiatives such as capacity expansion, product customization, and long-term supply contracts with gas processors and pipeline operators enhance competitive strength. Regional players compete through cost-effective solutions and localized service support, while global manufacturers leverage strong distribution networks and technical expertise. Continuous innovation, compliance with safety regulations, and aftermarket service capabilities remain critical factors shaping competition in the global market.
Key Player Analysis
- Parker Hannifin Corporation
- Donaldson Company, Inc
- MANN+HUMMEL Group
- Camfil AB
- Filtration Group Corporation
- AAF International
- 3M Company
- Eaton Corporation plc
- Honeywell International Inc.
- Pall Corporation
Recent Developments
- In October 2025, Cleanova launched its new PFAS-Free Media Coalescing Filters, offering high-efficiency gas and compressed air filtration with an environmentally friendly PFAS-free construction, marking a notable sustainable product introduction in gas filtration technology.
- In October 2025, Desco Infratech Limited signed an MoU with KPI Green Hydrogen and Ammonia Pvt. Ltd. and Naveriya Gas Pvt. Ltd. to launch India’s first Hydrogen-Natural Gas Blending Projects in the city gas distribution sector, indicating a strategic partnership toward cleaner gas applications.
- In January 2025, Rensa Filtration acquired Air Filtration Co., Inc., expanding its operations in California and Iowa with a focus on air filter products for industrial markets including those relevant to natural gas applications.
- In July 2024, Cleanova acquired Sidco Filter Company and Shawndra Products Inc., strengthening its position in clean tech filtration for air and gas markets, including natural gas wellheads and pipelines.
Report Coverage
The research report offers an in-depth analysis based on Type, Application and Geography. It details leading market players, providing an overview of their business, product offerings, investments, revenue streams, and key applications. Additionally, the report includes insights into the competitive environment, SWOT analysis, current market trends, as well as the primary drivers and constraints. Furthermore, it discusses various factors that have driven market expansion in recent years. The report also explores market dynamics, regulatory scenarios, and technological advancements that are shaping the industry. It assesses the impact of external factors and global economic changes on market growth. Lastly, it provides strategic recommendations for new entrants and established companies to navigate the complexities of the market.
Future Outlook
- The market will benefit from continued expansion of natural gas pipelines and transmission infrastructure across developed and emerging regions.
- Rising investments in LNG processing, storage, and export facilities will support sustained demand for high-efficiency filtration systems.
- Stricter gas quality and safety regulations will accelerate replacement and upgrade cycles for existing filtration installations.
- Industrial shift toward cleaner fuels will increase natural gas usage across chemicals, metallurgy, and manufacturing sectors.
- Technological advancements will improve filter media efficiency, durability, and performance under high-pressure conditions.
- Adoption of smart filtration systems with monitoring and predictive maintenance capabilities will increase across large-scale operations.
- Growth in city gas distribution networks will expand demand for medium and small-capacity filters.
- Increasing focus on equipment protection and reduced downtime will drive preference for premium filtration solutions.
- Emerging economies will witness faster adoption due to industrialization and energy infrastructure development.
- Strategic collaborations and product customization will strengthen supplier relationships with gas operators and utilities.
Request a Free Sample
Fill in your details and we'll send you a free sample report.
- Sample data tables & charts
- Research methodology
Need a Custom Version of This Report?
Tailor the scope, geography, or segments to your exact requirements.
- Custom geography or segment scope
- Direct access to our analyst team
Frequently Asked Questions
What is the current market size for the Natural Gas Filter Market, and what is its projected size in 2032?
At what Compound Annual Growth Rate is the Natural Gas Filter Market projected to grow between 2024 and 2032?
Which Natural Gas Filter Market segment held the largest share in 2024?
What are the primary factors fueling the growth of the Natural Gas Filter Market?
Who are the leading companies in the Natural Gas Filter Market?
Which region commanded the largest share of the Natural Gas Filter Market in 2024?
Table of Content
Chapter 1. Report Introduction
- 1.1 Report Description & Purpose
- 1.1.1 Report Title & Market Definition
- 1.1.2 Unique Selling Propositions (USP) & Key Differentiators
- 1.1.3 Value Proposition for Stakeholders
- 1.2 Research Objectives
- 1.2.1 Market Sizing Objectives (Volume & Revenue)
- 1.2.2 Segmentation Objectives
- 1.2.3 Competitive Intelligence Objectives
- 1.2.4 Forecast & Scenario Objectives
- 1.3 Report Scope
- 1.3.1 Natural Gas Filter Scope – Types & Subtypes Covered
- 1.3.2 Geographic Scope – Regions & Countries Covered
- 1.3.3 Historical Period, Base Year & Forecast Period (2024; forecast to 2032)
- 1.3.4 Inclusions & Exclusions
- 1.4 HS Code & Classification Framework
- 1.5 Currency, Units & Pricing Basis
- 1.6 Target Stakeholders
- 1.7 Limitations & Assumptions
Chapter 2. Executive Summary
- 2.1 Global Natural Gas Filter Market Snapshot
- 2.1.1 Market Size – Historical (2024) & Forecast (2024-2032) (2024: USD 1,273 million → 2032: USD 2,106.5 million)
- 2.1.2 Volume & Revenue – Global Totals
- 2.1.3 Key Market Highlights – Top Five Facts
- 2.2 Natural Gas Filter Market Segmentation Snapshot
- 2.2.1 Market Split by Region – 2024 vs. 2032
- 2.3 Competitive Snapshot
- 2.3.1 Top 10 Players by Revenue Share – 2024
- 2.3.2 Top 10 Players by Volume Share – 2024
- 2.3.3 Recent Strategic Developments (18-Month Summary)
- 2.4 Key Investment Highlights & Strategic Conclusions
Chapter 3. Natural Gas Filter Market Dynamics & Industry Analysis
- 3.1 Market Overview & Context
- 3.1.1 Natural Gas Filter Market Position in the Broader Automotive Value Chain
- 3.1.2 OEM vs. Replacement Market Dynamics
- 3.1.3 Market Maturity & Development Stage by Region
- 3.2 Natural Gas Filter Market Drivers
- 3.3 Natural Gas Filter Market Restraints & Challenges
- 3.4 Natural Gas Filter Market Opportunities
- 3.5 Porter's Five Forces Analysis
- 3.5.1 Threat of New Entrants
- 3.5.2 Bargaining Power of Suppliers
- 3.5.3 Bargaining Power of Buyers
- 3.5.4 Threat of Substitutes
- 3.5.5 Competitive Rivalry – Intensity Assessment
- 3.6 Natural Gas Filter Value Chain Analysis
- 3.6.1 Upstream – Raw Material/Input Suppliers
- 3.6.1.1 Raw Material/Input 1
- 3.6.1.2 Raw Material/Input 2
- 3.6.1.3 Raw Material/Input 3
- 3.6.2 Midstream – Production/Manufacturing/Service Delivery
- 3.6.2.1 Production/Process Overview
- 3.6.2.2 Key Facility Locations & Capacity by Manufacturer
- 3.6.3 Downstream – Distribution & End Consumer
- 3.6.3.1 Primary Channel – B2B/OEM
- 3.6.3.2 Secondary Channels – Dealer, Retail, Online, Direct
- 3.6.4 Value Chain Profitability Analysis
- 3.6.1 Upstream – Raw Material/Input Suppliers
- 3.7 PESTEL Analysis
- 3.7.1 Political Factors
- 3.7.2 Economic Factors
- 3.7.3 Social Factors
- 3.7.4 Technological Factors
- 3.7.5 Environmental Factors
- 3.7.6 Legal Factors
- 3.8 Natural Gas Filter Supply Chain Analysis
- 3.8.1 Raw Material/Input Supply Risk Assessment
- 3.8.2 Manufacturing Concentration Risk (Geographic Exposure)
- 3.8.3 Trade Disruption Impact Analysis
- 3.9 Regulatory & Policy Landscape
Note: The regulatory and policy landscape section covers regulations based on their applicability to the market, Natural Gas Filter category, geography, and scope of the study. Only regulatory frameworks with a material impact on operations, compliance, trade, sustainability, or market access are analyzed in detail.
Chapter 4. Key Investment Pockets & Opportunity Analysis
- 4.1 Natural Gas Filter Market Attractiveness Analysis
- 4.1.1 By Region – Investment Attractiveness Matrix (Volume × CAGR)
- 4.2 Absolute Revenue Growth Opportunity
- 4.2.1 By Region – Absolute USD Growth Through 2032
- 4.3 Incremental Volume Opportunity
- 4.3.1 By Region – Incremental Volume Through 2032
- 4.3.2 Segment – Incremental Volume
- 4.4 Emerging Submarket Opportunity Deep Dive (Subject to Applicability)
- 4.5 Emerging Market Opportunity Scorecards
- 4.5.1 United States
- 4.5.2 Europe
- 4.5.3 Asia
- 4.5.4 Middle East & Africa
Note: Emerging Market Opportunity Scorecards will be included based on relevance and strategic importance. Regions listed are indicative and may vary depending on data availability and market dynamics.
Chapter 5. Natural Gas Filter Import-Export Analysis & Trade Flows
- 5.1 Global Trade Overview
- 5.1.1 Global Export Value by Country (2024)
- 5.1.2 Global Export Volume by Country (2024)
- 5.1.3 Global Import Value by Country (2024)
- 5.1.4 Global Import Volume by Country (2024)
- 5.1.5 Net Trade Balance by Country (2024)
- 5.2 Export Analysis – Segment
- 5.2.1 Type 1 (HS Code)
- 5.2.2 Type 2 (HS Code)
- 5.2.3 Type 3 (HS Code)
- 5.2.4 Type 4 (HS Code)
- 5.2.5 Type 5 (HS Code)
- 5.3 Import Analysis – Segment
- 5.3.1 Type 1 (HS Code)
- 5.3.2 Type 2 (HS Code)
- 5.3.3 Type 3 (HS Code)
- 5.3.4 Type 4 (HS Code)
- 5.3.5 Type 5 (HS Code)
- 5.4 Average Unit Trade Prices
- 5.4.1 Average Export Price – Segment & Country
- 5.4.2 Average Import Price – Segment & Source Country
- 5.4.3 Price Trends (2024)
- 5.5 Key Trade Route Analysis
- 5.5.1 Trade Route 1
- 5.5.2 Trade Route 2
- 5.5.3 Trade Route 3
- 5.5.4 Trade Route 4
- 5.5.5 Trade Route 5
- 5.6 Trade Policy Impact Assessment
- 5.6.1 US Anti-Dumping & Section 301 Tariffs
- 5.6.2 EU Customs Union Impact
- 5.6.3 Major Free Trade Agreements
- 5.6.4 USMCA Rules of Origin
Note: Trade policy analysis will be included only where relevant to the Natural Gas Filter market.
Chapter 6. Competitive Landscape & Company Benchmarking
- 6.1 Natural Gas Filter Market Concentration & Structure
- 6.1.1 Herfindahl-Hirschman Index (HHI) – vs. 2024
- 6.1.2 Tier 1, Tier 2 & Tier 3 Market Structure
- 6.1.3 Global, Regional & Local Player Dynamics
- 6.2 Natural Gas Filter Market Share Analysis – 2024
- 6.2.1 Global Revenue Share by Company
- 6.2.2 Global Volume Share by Company
- 6.2.3 Regional Revenue Share
- 6.2.4 Market Share Evolution ( vs. 2024)
- 6.2.5 OEM Segment Share by Company
- 6.2.6 Replacement Segment Share by Company
- 6.3 Production/Delivery Capacity & Facility Analysis
- 6.3.1 Global Installed Capacity
- 6.3.2 Capacity Utilization Rates
- 6.3.3 Production/Output Volume
- 6.3.4 Facility Locations & Capacity Map
- 6.3.5 Planned Capacity Additions
- 6.4 Natural Gas Filter Competitive Benchmarking Matrix
- 6.4.1 Revenue, Volume, CAGR & Profitability Comparison
- 6.4.2 Channel Revenue Mix
- 6.4.3 Geographic Revenue Exposure
- 6.4.4 R&D Intensity
- 6.4.5 Sustainability Maturity
- 6.5 Strategic Developments in Natural Gas Filter (Last 24 Months)
- 6.5.1 Mergers, Acquisitions & Divestments
- 6.5.2 New Natural Gas Filter Launches
- 6.5.3 Facility Expansions
- 6.5.4 Strategic Alliances, Joint Ventures & Partnerships
- 6.5.5 Distribution Expansion & Market Entry
- 6.5.6 Sustainability & ESG Initiatives
- 6.6 Competitive Strategy Mapping
- 6.6.1 Leader, Challenger, Follower & Niche Classification
- 6.6.2 Pricing Strategy Comparison
- 6.6.3 Channel Strategy Matrix
Note: Strategic developments are included based on their materiality and the availability of reliable information.
Chapter 7. Global Natural Gas Filter Market – By Distribution Channel
- 7.1 Segment Overview
- 7.1.1 Volume & Revenue Split by Channel (2024 & 2032)
- 7.1.2 Channel Mix Evolution (2024-2032)
Chapter 8. Regional Market Analysis – Global Overview
- 8.1 Global Regional Overview
- 8.1.1 Regional Volume Share
- 8.1.2 Regional Revenue Share
- 8.1.3 Regional Volume by Region
- 8.1.4 Regional Revenue by Region
- 8.1.5 Regional Forecast Through 2032
- 8.2 Cross-Regional Segment Analysis
- 8.2.1 By Distribution Channel
- 8.2.2 By Brand/Price Tier
Chapter 9. North America Natural Gas Filter Market
- 9.1 United States
- 9.2 Canada
- 9.3 Mexico
Chapter 10. Europe Natural Gas Filter Market
- 10.1 Germany
- 10.2 France
- 10.3 Italy
- 10.4 United Kingdom
- 10.5 Spain
- 10.6 Poland
- 10.7 Russia
- 10.8 Netherlands
- 10.9 Belgium
- 10.10 Sweden
- 10.11 Denmark
- 10.12 Norway
- 10.13 Rest of Europe
Chapter 11. Asia Pacific Natural Gas Filter Market
- 11.1 China
- 11.2 India
- 11.3 Japan
- 11.4 South Korea
- 11.5 Thailand
- 11.6 Indonesia
- 11.7 Vietnam
- 11.8 Malaysia
- 11.9 Australia
- 11.10 Rest of Asia Pacific
Chapter 12. Latin America Natural Gas Filter Market
- 12.1 Brazil
- 12.2 Argentina
- 12.3 Colombia
- 12.4 Chile
- 12.5 Rest of Latin America
Chapter 13. Middle East Natural Gas Filter Market
- 13.1 Saudi Arabia
- 13.2 United Arab Emirates
- 13.3 Turkey
- 13.4 Israel
- 13.5 Iran
- 13.6 Rest of the Middle East
Chapter 14. Africa Natural Gas Filter Market
- 14.1 South Africa
- 14.2 Egypt
- 14.3 Nigeria
- 14.4 Morocco
- 14.5 Rest of Africa
Chapter 15. Natural Gas Filter Company Profiles
- 15.1 [Company 01]
- 15.1.1 Company Overview
- 15.1.2 Key Management Personnel
- 15.1.3 Products & Services Portfolio
- 15.1.4 Financial Performance
- 15.1.5 Key Market Focus & Geographic Presence
- 15.1.6 Recent Developments & Strategic Initiatives
Note: The company profile list is preliminary and may change based on research findings, market developments, data availability, and client requirements.
Chapter 16. Appendices
- Appendix A – List of Abbreviations & Acronyms
- Appendix B – Industry Classification Code Reference – Full Series
- Appendix C – Production & Capacity Data Tables
- Appendix D – End-Use & Demand Base Tables
- Appendix E – Consumption & Replacement Rate Assumptions
- Appendix F – ASP Reference Tables
- Appendix G – Manufacturing & Facility Database
- Appendix H – Import-Export Data Tables
- Appendix I – Regulatory Summary Tables
- Appendix J – Primary Research Participant List (Anonymized)
- Appendix K – Primary Research Questionnaire Framework
- Appendix L – Data Sources & Bibliography
- Appendix M – Market Size Divergence & Source Comparison
Chapter 17. Research Methodology
- 17.1 Research Framework & Philosophy
- 17.2 Secondary Research – Sources, Hierarchy & Data Extraction
- 17.3 Data Modeling – Bottom-Up & Top-Down Market Sizing
- 17.4 Primary Research – Stakeholder Framework, LOI & Sample Sizes
- 17.5 Forecast Methodology – Regression, Scenario & Sensitivity Analysis
- 17.6 Quality Control – Four-Layer Validation Framework
- 17.7 Limitations & Standard Assumptions
- 17.8 Disclaimer
