
Market Overview
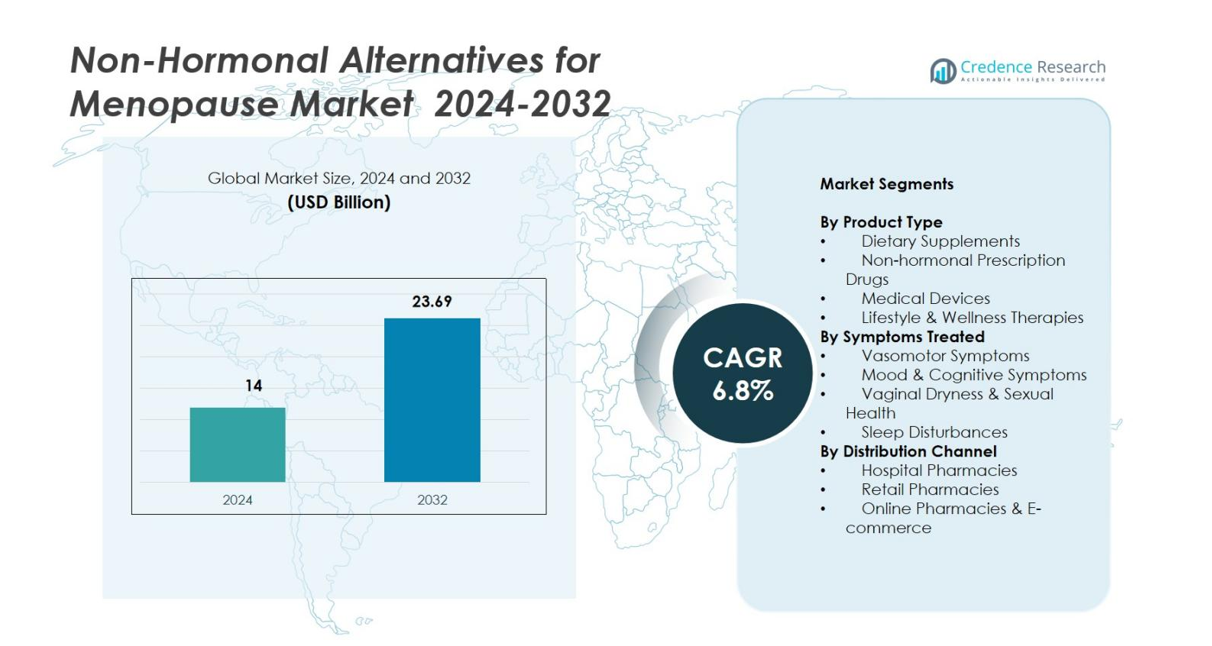
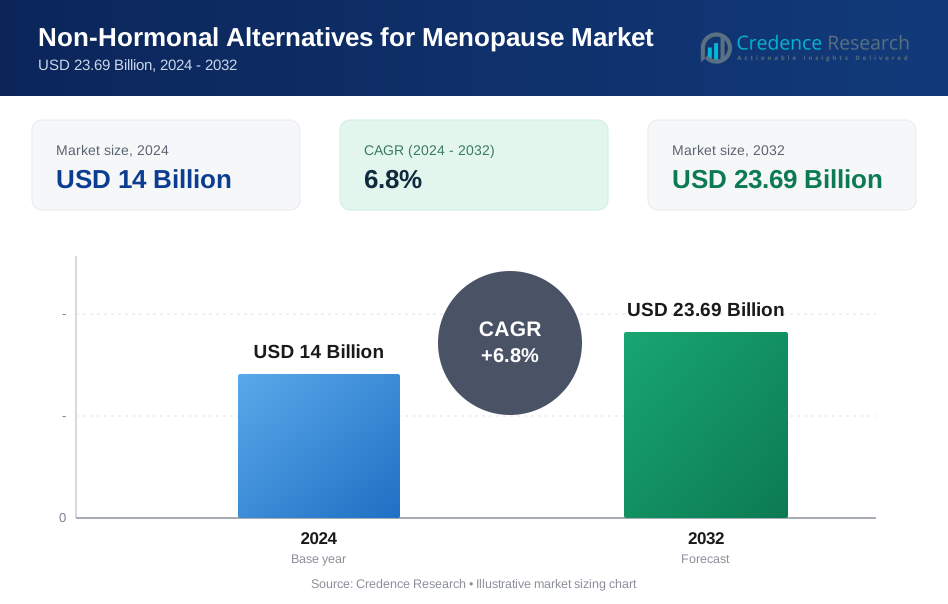
Non-Hormonal Alternatives for Menopause Market size was valued USD 14 Billion in 2024 and is anticipated to reach USD 23.69 Billion by 2032, at a CAGR of 6.8% during the forecast period.
| REPORT ATTRIBUTE | DETAILS |
|---|---|
| Historical Period | 2020-2023 |
| Base Year | 2024 |
| Forecast Period | 2025-2032 |
|
|
USD 14 Billion |
|
|
6.8% |
|
|
USD 23.69 Billion |
Non-Hormonal Alternatives for Menopause Market is shaped by a diverse group of leading players, including ASCEND Therapeutics US, LLC., Merck & Co., Inc., Bayer AG, Novo Nordisk A/S, AbbVie Inc., Pfizer Inc., Eli Lilly and Company, Noven Pharmaceuticals, Inc., Viatris Inc., and Hoffmann-La Roche Ltd., each advancing non-hormonal solutions through supplements, prescription drugs, and device-based therapies. These companies focus on innovation, clinical validation, and expanded distribution to meet rising demand for hormone-free symptom relief. Regionally, North America leads the market with a 38.4% share, supported by high awareness and strong healthcare access, while Europe follows with a 29.7% share driven by strong nutraceutical adoption and regulatory support for evidence-based non-hormonal therapies.
Market Insights
- The Non-Hormonal Alternatives for Menopause Market was valued at USD 14 Billion in 2024 and is projected to reach USD 23.69 Billion by 2032, registering a CAGR of 6.8% during the forecast period.
- Demand rises as women increasingly prefer natural, hormone-free solutions, with dietary supplements holding the largest share at 42.6%, supported by safety concerns surrounding traditional hormone therapies.
- Key trends include accelerating adoption of digital menopause platforms, wearable cooling devices, and growing clinical research on botanicals such as soy isoflavones, ashwagandha, and black cohosh.
- Major players such as Merck & Co., Bayer AG, Novo Nordisk, Pfizer, AbbVie, Viatris, and Eli Lilly focus on product innovation, expanding supplement portfolios, and developing non-hormonal prescription therapies.
- Regionally, North America leads with a 38.4% share, followed by Europe at 29.7%, while Asia-Pacific captures 21.5% driven by strong demand for natural supplements and increasing e-commerce penetration.
Market Segmentation Analysis
By Product Type
The Non-Hormonal Alternatives for Menopause Market is led by dietary supplements, accounting for 42.6% share in 2024, driven by strong consumer preference for botanicals, phytoestrogens, and nutraceutical solutions with minimal side effects. Non-hormonal prescription drugs gain steady adoption for clinically validated symptom relief, while medical devices, such as cooling wearables and neurostimulation tools, expand due to rising interest in technology-enabled therapies. Lifestyle and wellness therapies also grow as holistic approaches rise. Dietary supplements dominate due to OTC accessibility, affordability, and increasing trust in natural formulations.
- For instance, Veozah (active ingredient fezolinetant) in the Phase 3 SKYLIGHT trials women taking 45 mg daily saw a significant drop in moderate-to-severe hot flashes by 12 weeks, with further sustained benefits over 52 weeks.
By Symptoms Treated
Vasomotor symptoms hold the dominant position with 48.3% share, as hot flashes and night sweats remain the most common menopausal concerns and the primary reasons women seek treatment. Non-hormonal alternatives targeting thermoregulation, including herbal supplements, neurokinin pathway drugs, and cooling devices, support strong market uptake. Mood and cognitive symptoms show increased adoption as awareness of menopause-related anxiety and brain fog improves, while vaginal dryness and sleep disturbances contribute to expanding therapy portfolios. Vasomotor treatments lead due to high prevalence and strong demand for safe, hormone-free relief options.
- For instance, fezolinetant (VEOZAH) demonstrated significant reductions in moderate-to-severe hot flashes by week 12 in Phase 3 SKYLIGHT trials, confirming the role of NK3-receptor antagonists in hormone-free symptom relief.
By Distribution Channel
Retail pharmacies command the largest share at 51.2%, supported by strong consumer reliance on OTC availability, pharmacist recommendations, and wide assortments of supplements and non-hormonal therapies. Online pharmacies and e-commerce platforms are rapidly growing as women prefer discreet purchasing, home delivery, and subscription-based wellness solutions. Hospital pharmacies continue to play an important role for prescription non-hormonal drugs and device-related counseling. Retail leadership is reinforced by convenience, immediate product access, and trusted availability of diverse non-hormonal solutions across symptom categories.
Key Growth Drivers
Rising Demand for Safe, Hormone-Free Menopause Therapies
Growing safety concerns surrounding hormone replacement therapy (HRT) significantly accelerate demand for non-hormonal menopause alternatives. Many women seek safer and more natural options to avoid potential risks linked with long-term hormone exposure, including cardiovascular issues and certain cancers. This shift boosts the adoption of dietary supplements, botanical extracts, neurokinin pathway modulators, and device-based therapies such as cooling wearables. Increased awareness from healthcare providers, advocacy groups, and wellness platforms encourages proactive symptom management. With greater social acceptance of menopause discussions, more women openly seek solutions aligned with natural wellness preferences. The availability of OTC products and expanding physician recommendations for non-hormonal methods further strengthen market momentum, making hormone-free therapies a preferred option for long-term relief.
- For instance, the Women’s Health Initiative (WHI) follow-up analyses reported elevated risks of breast cancer and cardiovascular events among certain long-term HRT users, prompting clinicians to increasingly recommend non-hormonal treatments for vasomotor symptoms.
Expanding Product Innovation Across Supplements, Devices, and Prescription Drugs
Innovation across multiple therapeutic categories continues to propel significant market growth. Supplement manufacturers develop advanced botanical blends, phytoestrogens, probiotics, and specialized nutraceutical formulations tailored for vasomotor, cognitive, and sleep-related symptoms. Device manufacturers introduce advanced cooling wearables, neurostimulation technologies, and digital therapeutics supporting real-time symptom relief without pharmaceuticals. Prescription drug developers accelerate progress on non-hormonal mechanisms like neurokinin-3 receptor antagonists, delivering clinically validated results. Increased R&D investment and evidence-backed product launches strengthen credibility among physicians and consumers. Technological advancements expand treatment options and broaden application areas, while targeted formulations increase adoption across diverse symptom profiles. Collectively, these innovations enhance therapeutic efficacy, improve user experience, and expand market reach.
- For instance, the KÜLKUF cooling wrist-band achieved a documented 46% reduction in severe hot flashes in clinical testing, showing strong potential for wearable thermoregulation technologies. Prescription drug developers also advance non-hormonal pathways.
Growing Focus on Women’s Health and Preventive Wellness
Global prioritization of women’s health significantly boosts the adoption of non-hormonal menopause therapies. Wellness frameworks increasingly incorporate menopause support, prompting governments, healthcare bodies, and advocacy organizations to elevate menopause care standards. Corporate wellness programs introduce menopause support tools, driving uptake among working women. Longer life expectancy and growing midlife populations intensify demand for accessible symptom-management approaches. Preventive wellness trends encourage early adoption of supplements, lifestyle therapies, and digital platforms before symptoms escalate. Personalized wellness solutions, including apps and diagnostics, enable women to track symptoms and choose targeted non-hormonal interventions. As menopause becomes more central in women’s health discussions, broader awareness and systemic support enhance accessibility and acceptance.
Key Trends & Opportunities
Increasing Adoption of Digital Health Platforms and Menopause-Focused Wearables
The shift toward digital health creates substantial opportunities across the non-hormonal menopause landscape. Women increasingly use telehealth consultations, mobile apps, AI-driven symptom trackers, and wearable technologies designed for hot flash monitoring and real-time relief. Connected cooling devices, neurostimulation wearables, and digital therapeutic platforms provide personalized, non-pharmacological symptom management. Digital ecosystems support subscription-based supplement programs, virtual coaching, and automated analytics that enhance treatment adherence and outcomes. Collaborations between health-tech innovators, pharmaceutical companies, and insurers improve access and affordability. As digital wellness becomes mainstream, technology-enabled non-hormonal solutions emerge as a transformative growth avenue for modern, health-conscious menopausal women.
- For instance, the MenoLabs app integrates symptom tracking with personalized probiotic and supplement recommendations, using user-generated data to refine non-hormonal wellness programs and improve adherence.
Expanding Research on Botanical Ingredients and Evidence-Based Nutraceuticals
Growing scientific research on non-hormonal botanical ingredients creates significant opportunities for market advancement. Ingredients such as black cohosh, red clover, soy isoflavones, ashwagandha, maca, and adaptogens gain broader acceptance as clinical evidence supports their effectiveness in managing vasomotor, emotional, and cognitive symptoms. Standardized extracts, enhanced bioavailability technologies, and targeted formulations drive superior product outcomes and consumer trust. Nutraceutical brands increasingly invest in clinical trials to validate claims and strengthen physician confidence. Partnerships among biotech companies, universities, and supplement manufacturers accelerate R&D activities. With rising consumer demand for scientifically backed natural solutions, evidence-based botanical products are positioned for strong long-term growth.
Key Challenges
Limited Clinical Evidence and Regulatory Variability Across Regions
Despite rising demand, inconsistent clinical validation across supplements, botanicals, and device-based therapies poses a major challenge. Many non-hormonal products lack large-scale clinical trials, leading to reluctance among physicians and regulatory authorities. Global regulatory standards differ significantly for nutraceutical health claims, ingredient approvals, and formulations, creating fragmented pathways that complicate international market expansion. Prescription non-hormonal drugs face lengthy and costly approval cycles, slowing commercialization. This regulatory inconsistency reduces uniform adoption and delays innovation momentum. Without stronger scientific evidence and harmonized global frameworks, manufacturers struggle to build universal trust and achieve broad market penetration.
Strong Presence of Hormonal Therapies and Low Awareness in Emerging Markets
Hormonal therapies remain the predominant treatment choice in many countries due to long-standing physician familiarity, perceived high efficacy, and widespread historical usage. This dominance limits awareness and acceptance of non-hormonal alternatives. In emerging markets, cultural stigma around menopause, limited patient education, and restricted product availability further hinder adoption. Many women avoid seeking treatment altogether, reducing demand for both prescription and OTC non-hormonal solutions. Economic constraints also make premium non-hormonal options less accessible. As hormonal therapies continue to overshadow newer solutions, non-hormonal brands must invest significantly in awareness-building, education campaigns, and distribution expansion to increase visibility and adoption.
Regional Analysis
North America
North America leads the Non-Hormonal Alternatives for Menopause Market with a 38.4% share in 2024, driven by high awareness of hormone-free therapies, strong adoption of supplements, and increasing availability of clinically validated non-hormonal drugs. The region benefits from a well-developed healthcare infrastructure, proactive women’s health initiatives, and rapid adoption of digital menopause platforms. Consumer preference for natural, OTC solutions and rising use of wearable devices strengthen market expansion. Additionally, supportive reimbursement pathways for select non-hormonal therapies and growing employer-driven menopause wellness programs sustain demand across the United States and Canada.
Europe
Europe holds a 29.7% share of the Non-Hormonal Alternatives for Menopause Market, supported by strong demand for botanical supplements, increasing regulatory support for evidence-based nutraceuticals, and high awareness of menopause-related health issues. Countries such as Germany, the U.K., and France show robust uptake of non-hormonal therapies due to established integrative healthcare practices and extensive pharmacy networks. The region’s aging female population and government-backed wellness initiatives further contribute to market growth. Rising clinical research on plant-based ingredients and adoption of digital therapeutic tools strengthen Europe’s position as a key hub for non-hormonal menopause solutions.
Asia-Pacific
Asia-Pacific accounts for 21.5% share, emerging as the fastest-growing region due to rising healthcare awareness, growing acceptance of natural supplements, and large populations entering menopausal age. Markets such as China, Japan, South Korea, and India show increasing demand for herbal formulations rooted in traditional medicine systems as well as modern nutraceuticals. Expanding e-commerce penetration boosts access to OTC non-hormonal solutions. Improving women’s health initiatives and rising disposable incomes further stimulate adoption. As regional manufacturers invest in clinically validated botanical products, Asia-Pacific is expected to gain substantial momentum during the forecast period.
Latin America
Latin America represents a 6.2% share, with growth supported by expanding awareness of menopause management, increasing preference for natural remedies, and improving pharmacy retail networks. Countries such as Brazil, Mexico, and Argentina experience rising adoption of herbal supplements and lifestyle-based non-hormonal therapies. Economic constraints and limited access to prescription non-hormonal drugs slow penetration, but growing digital health engagement boosts product visibility. Cultural acceptance of plant-based medicine and wellness-focused consumer behaviors further support market expansion. As healthcare education improves, the region is expected to witness steady growth in non-hormonal menopause solutions.
Middle East & Africa
The Middle East & Africa region holds a 4.2% share, with demand gradually rising due to improving women’s health awareness, urbanization, and expanding access to OTC supplements. Adoption remains moderate due to cultural barriers, limited healthcare engagement, and lower awareness of non-hormonal alternatives. However, markets such as the UAE, Saudi Arabia, and South Africa show increasing uptake of natural supplements and digital wellness tools. Growing investment in retail pharmacy chains and government-led women’s health initiatives support future growth. As awareness campaigns expand, non-hormonal therapies are expected to gain broader acceptance across the region.
Market Segmentations
By Product Type
- Dietary Supplements
- Non-hormonal Prescription Drugs
- Medical Devices
- Lifestyle & Wellness Therapies
By Symptoms Treated
- Vasomotor Symptoms
- Mood & Cognitive Symptoms
- Vaginal Dryness & Sexual Health
- Sleep Disturbances
By Distribution Channel
- Hospital Pharmacies
- Retail Pharmacies
- Online Pharmacies & E-commerce
By Geography
- North America
- U.S.
- Canada
- Mexico
- Europe
- Germany
- France
- U.K.
- Italy
- Spain
- Rest of Europe
- Asia Pacific
- China
- Japan
- India
- South Korea
- South-east Asia
- Rest of Asia Pacific
- Latin America
- Brazil
- Argentina
- Rest of Latin America
- Middle East & Africa
- GCC Countries
- South Africa
- Rest of the Middle East and Africa
Competitive Landscape
The Non-Hormonal Alternatives for Menopause Market features a diverse and expanding competitive landscape, with companies focusing on supplements, prescription drugs, medical devices, and wellness solutions. Key players such as ASCEND Therapeutics US, LLC., Merck & Co., Inc., Bayer AG, Novo Nordisk A/S, AbbVie Inc., Pfizer Inc., Eli Lilly and Company, Noven Pharmaceuticals, Inc., Viatris Inc., and Hoffmann-La Roche Ltd. increasingly invest in non-hormonal modalities to meet rising demand for safer menopause therapies. Manufacturers emphasize product innovation, clinical research, and strategic partnerships to strengthen market positioning. Leading pharmaceutical companies advance non-hormonal drug candidates targeting vasomotor symptoms, while nutraceutical brands expand botanically derived supplement portfolios. Device innovators introduce cooling wearables and neurostimulation tools, enhancing non-pharmaceutical symptom management. Growing consumer preference for natural, convenient, and clinically validated solutions encourages players to diversify offerings and expand distribution channels across retail, e-commerce, and healthcare networks.
Key Player Analysis
- Hoffmann-La Roche Ltd.
- ASCEND Therapeutics US, LLC.
- Viatris, Inc.
- Pfizer Inc.
- AbbVie, Inc.
- Novo Nordisk A/S
- Merck & Co., Inc.
- Noven Pharmaceuticals, Inc.
- Bayer AG
- Eli Lilly and Company
Recent Developments
- In October 2025, Bayer received FDA approval for Lynkuet (elinzanetant), a non-hormonal therapy for moderate to severe menopause-related hot flashes.
- In October 2025, Astellas Pharma presented real-world data for VEOZAH (fezolinetant), their non-hormonal menopause therapy, at the 2025 meeting of The Menopause Society highlighting ongoing clinical evaluation in real-world settings
- In September 2025, Bonafide Health expanded its menopause-care product availability by launching non-hormonal menopausal wellness products in more than 1,800 stores of Target across the U.S.
Report Coverage
The research report offers an in-depth analysis based on Product Type, Symptoms Treated, Distribution Channel and Geography. It details leading market players, providing an overview of their business, product offerings, investments, revenue streams, and key applications. Additionally, the report includes insights into the competitive environment, SWOT analysis, current market trends, as well as the primary drivers and constraints. Furthermore, it discusses various factors that have driven market expansion in recent years. The report also explores market dynamics, regulatory scenarios, and technological advancements that are shaping the industry. It assesses the impact of external factors and global economic changes on market growth. Lastly, it provides strategic recommendations for new entrants and established companies to navigate the complexities of the market.
Future Outlook
- The market will continue expanding as global awareness and preference for hormone-free menopause solutions increase.
- Clinically validated non-hormonal prescription drugs will enter commercialization, strengthening advanced treatment options.
- Evidence-based botanical and nutraceutical formulations will gain wider acceptance as clinical research grows.
- Wearable cooling technologies and digital therapeutics will become more integral to non-hormonal symptom management.
- Personalized menopause care will advance through AI-driven symptom tracking and tailored therapy recommendations.
- Retail and online pharmacy channels will expand rapidly as women seek convenient OTC access.
- Employer-led wellness programs will increasingly include menopause support, boosting adoption.
- Emerging markets will witness rising demand as awareness, affordability, and digital health penetration improve.
- Regulatory frameworks will evolve to encourage higher clinical validation and product standardization.
- Competition will intensify as pharmaceutical, nutraceutical, and health-tech companies expand into women’s health.
Request a Free Sample
Fill in your details and we'll send you a free sample report.
- Sample data tables & charts
- Research methodology
Need a Custom Version of This Report?
Tailor the scope, geography, or segments to your exact requirements.
- Custom geography or segment scope
- Direct access to our analyst team
Frequently Asked Questions
What is the current market size for the Non Hormonal Alternatives For Menopause Market, and what is its projected size in 2032?
At what Compound Annual Growth Rate is the Non Hormonal Alternatives For Menopause Market projected to grow between 2025 and 2032?
What is the major growth driving factors for global Non-Hormonal Alternatives for Menopause market?
Which is major segment in Non-Hormonal Alternatives for Menopause market by Therapy?
Who are the leading companies in the Non Hormonal Alternatives For Menopause Market?
Table of Content
Chapter 1. Report Introduction
- 1.1 Report Description & Purpose
- 1.1.1 Report Title & Market Definition
- 1.1.2 Unique Selling Propositions (USP) & Key Differentiators
- 1.1.3 Value Proposition for Stakeholders
- 1.2 Research Objectives
- 1.2.1 Market Sizing Objectives (Volume & Revenue)
- 1.2.2 Segmentation Objectives
- 1.2.3 Competitive Intelligence Objectives
- 1.2.4 Forecast & Scenario Objectives
- 1.3 Report Scope
- 1.3.1 Non-Hormonal Alternatives for Menopause Scope – Types & Subtypes Covered
- 1.3.2 Geographic Scope – Regions & Countries Covered
- 1.3.3 Historical Period, Base Year & Forecast Period (2024; forecast to 2032)
- 1.3.4 Inclusions & Exclusions
- 1.4 HS Code & Classification Framework
- 1.5 Currency, Units & Pricing Basis
- 1.6 Target Stakeholders
- 1.7 Limitations & Assumptions
Chapter 2. Executive Summary
- 2.1 Global Non-Hormonal Alternatives for Menopause Market Snapshot
- 2.1.1 Market Size – Historical (2024) & Forecast (2024-2032) (2024: USD 14 Billion → 2032: USD 23.69 Billion)
- 2.1.2 Volume & Revenue – Global Totals
- 2.1.3 Key Market Highlights – Top Five Facts
- 2.2 Non-Hormonal Alternatives for Menopause Market Segmentation Snapshot
- 2.2.1 Market Split by Region – 2024 vs. 2032
- 2.3 Competitive Snapshot
- 2.3.1 Top 10 Players by Revenue Share – 2024
- 2.3.2 Top 10 Players by Volume Share – 2024
- 2.3.3 Recent Strategic Developments (18-Month Summary)
- 2.4 Key Investment Highlights & Strategic Conclusions
Chapter 3. Non-Hormonal Alternatives for Menopause Market Dynamics & Industry Analysis
- 3.1 Market Overview & Context
- 3.1.1 Non-Hormonal Alternatives for Menopause Market Position in the Broader Automotive Value Chain
- 3.1.2 OEM vs. Replacement Market Dynamics
- 3.1.3 Market Maturity & Development Stage by Region
- 3.2 Non-Hormonal Alternatives for Menopause Market Drivers
- 3.3 Non-Hormonal Alternatives for Menopause Market Restraints & Challenges
- 3.4 Non-Hormonal Alternatives for Menopause Market Opportunities
- 3.5 Porter's Five Forces Analysis
- 3.5.1 Threat of New Entrants
- 3.5.2 Bargaining Power of Suppliers
- 3.5.3 Bargaining Power of Buyers
- 3.5.4 Threat of Substitutes
- 3.5.5 Competitive Rivalry – Intensity Assessment
- 3.6 Non-Hormonal Alternatives for Menopause Value Chain Analysis
- 3.6.1 Upstream – Raw Material/Input Suppliers
- 3.6.1.1 Raw Material/Input 1
- 3.6.1.2 Raw Material/Input 2
- 3.6.1.3 Raw Material/Input 3
- 3.6.2 Midstream – Production/Manufacturing/Service Delivery
- 3.6.2.1 Production/Process Overview
- 3.6.2.2 Key Facility Locations & Capacity by Manufacturer
- 3.6.3 Downstream – Distribution & End Consumer
- 3.6.3.1 Primary Channel – B2B/OEM
- 3.6.3.2 Secondary Channels – Dealer, Retail, Online, Direct
- 3.6.4 Value Chain Profitability Analysis
- 3.6.1 Upstream – Raw Material/Input Suppliers
- 3.7 PESTEL Analysis
- 3.7.1 Political Factors
- 3.7.2 Economic Factors
- 3.7.3 Social Factors
- 3.7.4 Technological Factors
- 3.7.5 Environmental Factors
- 3.7.6 Legal Factors
- 3.8 Non-Hormonal Alternatives for Menopause Supply Chain Analysis
- 3.8.1 Raw Material/Input Supply Risk Assessment
- 3.8.2 Manufacturing Concentration Risk (Geographic Exposure)
- 3.8.3 Trade Disruption Impact Analysis
- 3.9 Regulatory & Policy Landscape
Note: The regulatory and policy landscape section covers regulations based on their applicability to the market, Non-Hormonal Alternatives for Menopause category, geography, and scope of the study. Only regulatory frameworks with a material impact on operations, compliance, trade, sustainability, or market access are analyzed in detail.
Chapter 4. Key Investment Pockets & Opportunity Analysis
- 4.1 Non-Hormonal Alternatives for Menopause Market Attractiveness Analysis
- 4.1.1 By Region – Investment Attractiveness Matrix (Volume × CAGR)
- 4.2 Absolute Revenue Growth Opportunity
- 4.2.1 By Region – Absolute USD Growth Through 2032
- 4.3 Incremental Volume Opportunity
- 4.3.1 By Region – Incremental Volume Through 2032
- 4.3.2 Segment – Incremental Volume
- 4.4 Emerging Submarket Opportunity Deep Dive (Subject to Applicability)
- 4.5 Emerging Market Opportunity Scorecards
- 4.5.1 United States
- 4.5.2 Europe
- 4.5.3 Asia
- 4.5.4 Middle East & Africa
Note: Emerging Market Opportunity Scorecards will be included based on relevance and strategic importance. Regions listed are indicative and may vary depending on data availability and market dynamics.
Chapter 5. Non-Hormonal Alternatives for Menopause Import-Export Analysis & Trade Flows
- 5.1 Global Trade Overview
- 5.1.1 Global Export Value by Country (2024)
- 5.1.2 Global Export Volume by Country (2024)
- 5.1.3 Global Import Value by Country (2024)
- 5.1.4 Global Import Volume by Country (2024)
- 5.1.5 Net Trade Balance by Country (2024)
- 5.2 Export Analysis – Segment
- 5.2.1 Type 1 (HS Code)
- 5.2.2 Type 2 (HS Code)
- 5.2.3 Type 3 (HS Code)
- 5.2.4 Type 4 (HS Code)
- 5.2.5 Type 5 (HS Code)
- 5.3 Import Analysis – Segment
- 5.3.1 Type 1 (HS Code)
- 5.3.2 Type 2 (HS Code)
- 5.3.3 Type 3 (HS Code)
- 5.3.4 Type 4 (HS Code)
- 5.3.5 Type 5 (HS Code)
- 5.4 Average Unit Trade Prices
- 5.4.1 Average Export Price – Segment & Country
- 5.4.2 Average Import Price – Segment & Source Country
- 5.4.3 Price Trends (2024)
- 5.5 Key Trade Route Analysis
- 5.5.1 Trade Route 1
- 5.5.2 Trade Route 2
- 5.5.3 Trade Route 3
- 5.5.4 Trade Route 4
- 5.5.5 Trade Route 5
- 5.6 Trade Policy Impact Assessment
- 5.6.1 US Anti-Dumping & Section 301 Tariffs
- 5.6.2 EU Customs Union Impact
- 5.6.3 Major Free Trade Agreements
- 5.6.4 USMCA Rules of Origin
Note: Trade policy analysis will be included only where relevant to the Non-Hormonal Alternatives for Menopause market.
Chapter 6. Competitive Landscape & Company Benchmarking
- 6.1 Non-Hormonal Alternatives for Menopause Market Concentration & Structure
- 6.1.1 Herfindahl-Hirschman Index (HHI) – vs. 2024
- 6.1.2 Tier 1, Tier 2 & Tier 3 Market Structure
- 6.1.3 Global, Regional & Local Player Dynamics
- 6.2 Non-Hormonal Alternatives for Menopause Market Share Analysis – 2024
- 6.2.1 Global Revenue Share by Company
- 6.2.2 Global Volume Share by Company
- 6.2.3 Regional Revenue Share
- 6.2.4 Market Share Evolution ( vs. 2024)
- 6.2.5 OEM Segment Share by Company
- 6.2.6 Replacement Segment Share by Company
- 6.3 Production/Delivery Capacity & Facility Analysis
- 6.3.1 Global Installed Capacity
- 6.3.2 Capacity Utilization Rates
- 6.3.3 Production/Output Volume
- 6.3.4 Facility Locations & Capacity Map
- 6.3.5 Planned Capacity Additions
- 6.4 Non-Hormonal Alternatives for Menopause Competitive Benchmarking Matrix
- 6.4.1 Revenue, Volume, CAGR & Profitability Comparison
- 6.4.2 Channel Revenue Mix
- 6.4.3 Geographic Revenue Exposure
- 6.4.4 R&D Intensity
- 6.4.5 Sustainability Maturity
- 6.5 Strategic Developments in Non-Hormonal Alternatives for Menopause (Last 24 Months)
- 6.5.1 Mergers, Acquisitions & Divestments
- 6.5.2 New Non-Hormonal Alternatives for Menopause Launches
- 6.5.3 Facility Expansions
- 6.5.4 Strategic Alliances, Joint Ventures & Partnerships
- 6.5.5 Distribution Expansion & Market Entry
- 6.5.6 Sustainability & ESG Initiatives
- 6.6 Competitive Strategy Mapping
- 6.6.1 Leader, Challenger, Follower & Niche Classification
- 6.6.2 Pricing Strategy Comparison
- 6.6.3 Channel Strategy Matrix
Note: Strategic developments are included based on their materiality and the availability of reliable information.
Chapter 7. Global Non-Hormonal Alternatives for Menopause Market – By Distribution Channel
- 7.1 Segment Overview
- 7.1.1 Volume & Revenue Split by Channel (2024 & 2032)
- 7.1.2 Channel Mix Evolution (2024-2032)
Chapter 8. Regional Market Analysis – Global Overview
- 8.1 Global Regional Overview
- 8.1.1 Regional Volume Share
- 8.1.2 Regional Revenue Share
- 8.1.3 Regional Volume by Region
- 8.1.4 Regional Revenue by Region
- 8.1.5 Regional Forecast Through 2032
- 8.2 Cross-Regional Segment Analysis
- 8.2.1 By Distribution Channel
- 8.2.2 By Brand/Price Tier
Chapter 9. North America Non-Hormonal Alternatives for Menopause Market
- 9.1 United States
- 9.2 Canada
- 9.3 Mexico
Chapter 10. Europe Non-Hormonal Alternatives for Menopause Market
- 10.1 Germany
- 10.2 France
- 10.3 Italy
- 10.4 United Kingdom
- 10.5 Spain
- 10.6 Poland
- 10.7 Russia
- 10.8 Netherlands
- 10.9 Belgium
- 10.10 Sweden
- 10.11 Denmark
- 10.12 Norway
- 10.13 Rest of Europe
Chapter 11. Asia Pacific Non-Hormonal Alternatives for Menopause Market
- 11.1 China
- 11.2 India
- 11.3 Japan
- 11.4 South Korea
- 11.5 Thailand
- 11.6 Indonesia
- 11.7 Vietnam
- 11.8 Malaysia
- 11.9 Australia
- 11.10 Rest of Asia Pacific
Chapter 12. Latin America Non-Hormonal Alternatives for Menopause Market
- 12.1 Brazil
- 12.2 Argentina
- 12.3 Colombia
- 12.4 Chile
- 12.5 Rest of Latin America
Chapter 13. Middle East Non-Hormonal Alternatives for Menopause Market
- 13.1 Saudi Arabia
- 13.2 United Arab Emirates
- 13.3 Turkey
- 13.4 Israel
- 13.5 Iran
- 13.6 Rest of the Middle East
Chapter 14. Africa Non-Hormonal Alternatives for Menopause Market
- 14.1 South Africa
- 14.2 Egypt
- 14.3 Nigeria
- 14.4 Morocco
- 14.5 Rest of Africa
Chapter 15. Non-Hormonal Alternatives for Menopause Company Profiles
- 15.1 [Company 01]
- 15.1.1 Company Overview
- 15.1.2 Key Management Personnel
- 15.1.3 Products & Services Portfolio
- 15.1.4 Financial Performance
- 15.1.5 Key Market Focus & Geographic Presence
- 15.1.6 Recent Developments & Strategic Initiatives
Note: The company profile list is preliminary and may change based on research findings, market developments, data availability, and client requirements.
Chapter 16. Appendices
- Appendix A – List of Abbreviations & Acronyms
- Appendix B – Industry Classification Code Reference – Full Series
- Appendix C – Production & Capacity Data Tables
- Appendix D – End-Use & Demand Base Tables
- Appendix E – Consumption & Replacement Rate Assumptions
- Appendix F – ASP Reference Tables
- Appendix G – Manufacturing & Facility Database
- Appendix H – Import-Export Data Tables
- Appendix I – Regulatory Summary Tables
- Appendix J – Primary Research Participant List (Anonymized)
- Appendix K – Primary Research Questionnaire Framework
- Appendix L – Data Sources & Bibliography
- Appendix M – Market Size Divergence & Source Comparison
Chapter 17. Research Methodology
- 17.1 Research Framework & Philosophy
- 17.2 Secondary Research – Sources, Hierarchy & Data Extraction
- 17.3 Data Modeling – Bottom-Up & Top-Down Market Sizing
- 17.4 Primary Research – Stakeholder Framework, LOI & Sample Sizes
- 17.5 Forecast Methodology – Regression, Scenario & Sensitivity Analysis
- 17.6 Quality Control – Four-Layer Validation Framework
- 17.7 Limitations & Standard Assumptions
- 17.8 Disclaimer
