Market Overview:
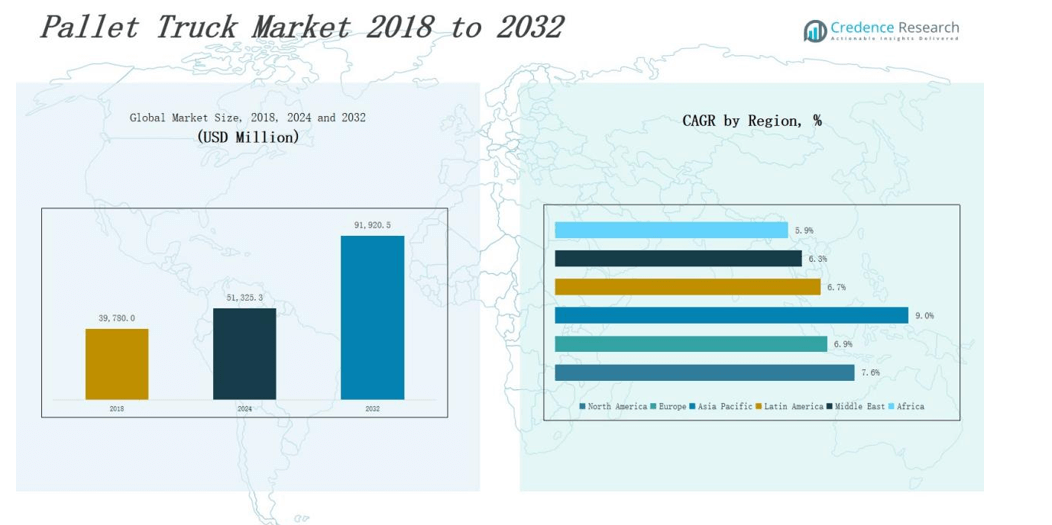
Pallet Truck Market size was valued at USD 39,780.0 million in 2018 to USD 51,325.3 million in 2024 and is anticipated to reach USD 91,920.5 million by 2032, at a CAGR of 7.6% during the forecast period.
| REPORT ATTRIBUTE |
DETAILS |
| Historical Period |
2020-2023 |
| Base Year |
2024 |
| Forecast Period |
2025-2032 |
| Pallet Truck MarketSize 2024 |
USD 51,325.3 million |
| Pallet Truck Market, CAGR |
7.6% |
| Pallet Truck Market Size 2032 |
USD 91,920.5 million |
The Pallet Truck Market is shaped by leading players such as Toyota Material Handling, KION Group, Jungheinrich, Hyster-Yale Materials Handling, Crown Equipment Corporation, Hyundai Heavy Industries, Nilkamal Limited, Nido Machineries, Goscor Lift Trucks, Presto Lifts Inc., Thermote & Vanhalst Group, Liftek FZC, Pr Industrial S.r.l., and Raymond Handling Concepts Corporation. These companies compete through advanced product portfolios, electric and semi-electric innovations, and strong global distribution networks. Strategic investments in automation, IoT integration, and ergonomic designs strengthen their market presence. Regionally, North America leads the Pallet Truck Market with a 33% share in 2024, supported by advanced warehousing infrastructure, high e-commerce penetration, and strong adoption of electric pallet trucks across logistics and manufacturing sectors.
Market Insights
- The Pallet Truck Market grew from USD 39,780.0 million in 2018 to USD 51,325.3 million in 2024, with steady demand across logistics and retail.
- Electric pallet trucks dominate with 42% share, driven by automation, reduced labor costs, and sustainability initiatives in warehousing and distribution centers.
- Standard pallet trucks lead with 48% share, favored for versatility and affordability, while silent and weighing models expand in retail and specialized industries.
- Freight and logistics hold 36% share, supported by global trade flows and e-commerce growth, followed by food and beverage and manufacturing industries.
- North America leads with 33% share in 2024, followed by Europe at 25% and Asia Pacific at 22%, highlighting regional diversification and demand growth.
Access crucial information at unmatched prices!
Request your sample report today & start making informed decisions powered by Credence Research Inc.!
Download Sample
Market Segment Insights
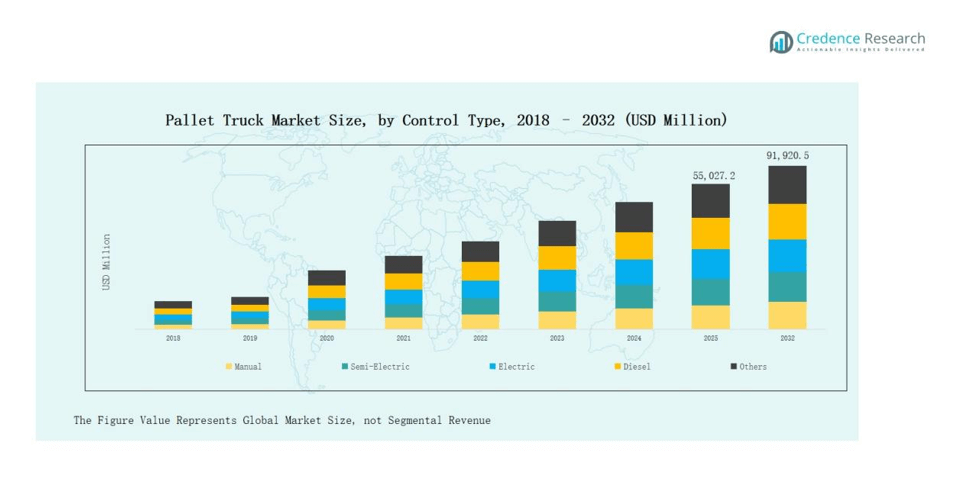
By Control Type
The electric pallet truck segment dominates the control type category with 42% market share. Its growth is supported by rising demand for automation, reduced labor costs, and sustainability goals in logistics. Manual pallet trucks follow closely due to low cost and widespread use in small warehouses. Semi-electric models are gaining traction as a cost-effective middle ground, while diesel and CNG variants serve heavy-duty outdoor applications. Others, including hybrid systems, remain niche but attract interest from specialized industries.
- For instance, Toyota Material Handling launched its lithium-ion powered BT Levio LWI160, which reduces energy use and requires less maintenance than lead-acid models.
By Type
The standard pallet truck leads the market with 48% share, driven by versatility and affordability across industries. Quarter pallet trucks cater to retail and compact storage needs, while silent pallet trucks grow in popularity due to noise restrictions in supermarkets and airports. Weighing pallet trucks see steady adoption in industries requiring accuracy in goods handling. Scissor pallet trucks hold a smaller but vital role in ergonomic applications, supporting worker safety and reducing strain during lifting operations.
By End-Use Industry
The freight and logistics sector holds the largest share at 36%, supported by e-commerce expansion and global trade flows. Food and beverage follow with strong adoption in cold chain and supermarket distribution networks. Retail stores account for significant demand, particularly for silent and quarter pallet trucks suited to in-store handling. Manufacturing industries also remain key users, driven by lean production practices and increased automation. Other industries, including pharmaceuticals and chemicals, adopt pallet trucks to streamline material handling in specialized environments.
- For instance, IKEA has standardized manual and low-noise pallet jacks within its stores to move flat-pack products without disturbing customers.
Market Overview
Rising Demand for Efficient Material Handling
The rapid expansion of e-commerce and global trade drives the need for efficient material handling. Companies prioritize faster order fulfillment, streamlined warehouse operations, and reduced downtime. Pallet trucks provide flexibility for loading, unloading, and intra-warehouse transport, making them indispensable. Their cost-effectiveness compared to larger forklifts further supports adoption. Growing investments in logistics infrastructure and last-mile delivery networks enhance demand. Industries such as retail, food and beverage, and manufacturing continue to adopt pallet trucks to improve productivity and reduce operational bottlenecks.
- For instance, companies like PostNord have used technology-driven sorting improvements alongside efficient material handling equipment to increase capacity and reduce bottlenecks.
Growing Adoption of Electric and Semi-Electric Models
The shift toward electric and semi-electric pallet trucks is a key driver of market growth. Businesses focus on reducing labor fatigue, improving safety, and enhancing energy efficiency. Electric pallet trucks dominate due to their eco-friendly operations and ability to support automation. Semi-electric models attract small and medium businesses that seek affordable solutions with partial mechanization benefits. Sustainability goals, stricter emissions regulations, and rising energy costs encourage industries to transition away from manual and diesel types. This accelerates adoption across warehouses, factories, and distribution centers.
- For instance, Hyster-Yale Group has introduced pallet trucks equipped with regenerative braking, reducing overall energy use and extending battery life—aligning with the warehousing sector’s demand for efficiency and sustainability.
Expansion of Cold Chain and Food Logistics
The rising demand for cold storage facilities and food distribution strengthens pallet truck usage. Food and beverage companies rely on pallet trucks for quick, safe, and precise handling of perishable goods. Growth in supermarket chains, food exports, and frozen food consumption increases dependence on efficient logistics. Pallet trucks designed for cold environments with noise reduction features are particularly favored. With stricter food safety regulations, pallet trucks help ensure timely deliveries and minimal product damage. This expansion of cold chain networks significantly boosts long-term demand.
Key Trends & Opportunities
Integration of IoT and Automation Features
The adoption of IoT-enabled pallet trucks represents a major trend shaping the market. Advanced models integrate sensors, telematics, and fleet management software, allowing operators to track performance and optimize usage. Automation in warehouses drives demand for semi-automated or fully electric pallet trucks that can interact with robotics and conveyors. These smart features reduce downtime, improve asset utilization, and enhance workplace safety. As digitalization spreads across logistics and manufacturing, IoT-equipped pallet trucks create strong opportunities for technology providers and material handling companies.
- For instance, Mirka integrated IoT-enabled RFID sensors on pallets to enhance supply chain visibility, ensuring correct labeling and product tracking, which boosted plant efficiency by freeing staff for other tasks and improving data transparency across its operations.
Rising Demand in Emerging Markets
Emerging markets in Asia Pacific, Latin America, and Africa present strong growth opportunities for pallet trucks. Rapid urbanization, rising disposable incomes, and infrastructure investments fuel expansion of retail, logistics, and manufacturing sectors. Countries such as India, Brazil, and Indonesia are witnessing increased adoption of pallet trucks to streamline warehouse and distribution activities. Government initiatives promoting industrialization and smart logistics hubs further support demand. Lower penetration rates compared to developed markets provide significant room for growth, positioning emerging regions as lucrative opportunities for manufacturers.
- For instance, Indonesia’s state-owned logistics company Pos Indonesia modernized several distribution centers in 2023 by adopting material handling technologies, including pallet trucks, to improve last-mile efficiency in servicing its 192 million customers.
Key Challenges
High Competition and Price Pressure
The pallet truck market faces intense competition from global and regional manufacturers. Companies compete on pricing, product durability, and aftersales support. Low-cost imports from emerging economies put pressure on established players to reduce margins. Price sensitivity among small and medium enterprises adds to the challenge, limiting adoption of advanced models. This competitive environment often results in slower innovation cycles as companies prioritize cost over differentiation. The need to balance affordability with quality remains a major challenge for market players.
Rising Maintenance and Operational Costs
Maintenance costs of pallet trucks, especially electric and semi-electric models, present a growing challenge. Batteries, motors, and electronic components require regular servicing and replacements, increasing overall operational expenses. In industries with intensive usage, downtime due to maintenance can disrupt workflows and affect productivity. Smaller businesses often find it difficult to justify long-term service costs compared to manual trucks. As technology adoption rises, balancing upfront investments with long-term maintenance remains a barrier, particularly in cost-sensitive markets.
Shortage of Skilled Operators and Workforce Training
Despite rising automation, pallet truck operations require trained staff for safe and efficient use. A shortage of skilled operators and insufficient training programs lead to misuse, accidents, and equipment damage. This challenge is pronounced in developing markets, where workforce training is often limited. Companies must invest in upskilling workers, adding to operational costs. Without proper training, the benefits of advanced pallet trucks, including safety and efficiency, remain underutilized. This skills gap slows market adoption and impacts overall operational effectiveness.
Regional Analysis
North America
North America leads the pallet truck market with a 33% share in 2024, reaching USD 18,184.2 million. The region benefits from strong e-commerce penetration, well-established logistics infrastructure, and high adoption of electric pallet trucks. The U.S. dominates due to advanced warehousing systems and demand for automation in retail and logistics. Canada and Mexico contribute through growing manufacturing and cross-border trade activities. With a CAGR of 7.6%, North America is projected to expand to USD 32,514.9 million by 2032, driven by modernization of supply chains and sustainability initiatives across industries.
Europe
Europe accounts for a 25% market share in 2024, valued at USD 14,010.4 million. The region benefits from robust industrial sectors, stringent workplace safety regulations, and demand for noise-free and eco-friendly pallet trucks. Germany, France, and the UK remain leading contributors, supported by large-scale manufacturing and retail operations. Southern Europe shows growing adoption in food and beverage logistics, particularly in Italy and Spain. With a CAGR of 6.9%, Europe is expected to reach USD 23,803.1 million by 2032, highlighting sustained investments in warehouse automation and ergonomic handling solutions.
Asia Pacific
Asia Pacific holds a 22% share in 2024, valued at USD 12,053.5 million, and emerges as the fastest-growing market. The region benefits from rapid urbanization, growth of e-commerce platforms, and manufacturing expansion in China, India, Japan, and Southeast Asia. Increasing adoption of electric pallet trucks, rising infrastructure investments, and demand for efficient warehouse management drive growth. With a CAGR of 9.0%, Asia Pacific is forecasted to reach USD 23,938.9 million by 2032, positioning it as a key global hub for pallet truck production and adoption, supported by favorable government initiatives.
Latin America
Latin America represents a 7% share in 2024, valued at USD 3,623.1 million. Brazil leads the region, followed by Mexico and Argentina, driven by expanding retail and logistics networks. The demand for manual and semi-electric pallet trucks remains strong due to affordability and suitability for small-scale operations. Growth in e-commerce and regional trade further supports adoption. With a CAGR of 6.7%, the market is projected to reach USD 6,074.1 million by 2032, reflecting increasing investments in supply chain modernization and industrial development across the region.
Middle East
The Middle East contributes 5% market share in 2024, worth USD 1,852.5 million. GCC countries dominate due to large-scale logistics hubs, expanding retail sectors, and rising construction activities. Demand for pallet trucks is driven by rapid warehouse automation and import-export activities across key ports. Israel and Turkey also contribute significantly through industrial growth. With a CAGR of 6.3%, the market is expected to reach USD 2,997.1 million by 2032, supported by diversification efforts in non-oil industries and increasing adoption of energy-efficient handling solutions.
Africa
Africa holds an 8% share in 2024, valued at USD 1,601.6 million, with South Africa, Egypt, and Nigeria leading demand. The region benefits from growing investments in logistics, retail, and industrial projects, though adoption remains concentrated in urban centers. Manual pallet trucks dominate due to cost-effectiveness, while demand for electric types is gradually rising. With a CAGR of 5.9%, the market is forecasted to reach USD 2,592.4 million by 2032, supported by regional infrastructure development and expanding trade corridors across East and West Africa.
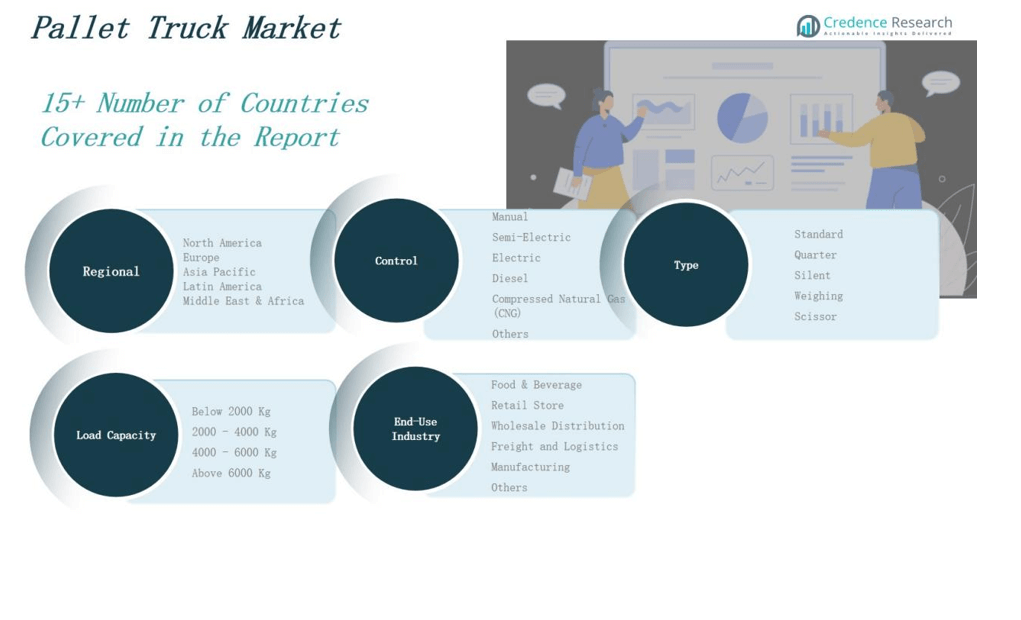
Market Segmentations:
By Control Type
- Manual
- Semi-Electric
- Electric
- Diesel
- Compressed Natural Gas (CNG)
- Others
By Type
- Standard
- Quarter
- Silent
- Weighing
- Scissor
By End-Use Industry
- Food & Beverage
- Retail Store
- Freight and Logistics
- Manufacturing
- Others
By Load Capacity
- Below 2000 Kg
- 2000 – 4000 Kg
- 4000 – 6000 Kg
- Above 6000 Kg
By Region
- North America
- Europe
- Germany
- France
- U.K.
- Italy
- Spain
- Rest of Europe
- Asia Pacific
- China
- Japan
- India
- South Korea
- South-east Asia
- Rest of Asia Pacific
- Latin America
- Brazil
- Argentina
- Rest of Latin America
- Middle East & Africa
- GCC Countries
- South Africa
- Rest of the Middle East and Africa
Competitive Landscape
The pallet truck market is moderately consolidated, with global and regional players competing across pricing, product innovation, and service offerings. Leading companies such as Toyota Material Handling, KION Group, Jungheinrich, Hyster-Yale Materials Handling, and Crown Equipment Corporation dominate through extensive product portfolios and strong global distribution networks. These players invest heavily in automation, electric-powered models, and IoT-enabled solutions to align with sustainability and efficiency goals. Regional companies, including Goscor Lift Trucks, Nilkamal Limited, and Nido Machineries, strengthen their presence by offering cost-effective and customized solutions catering to local industries. Strategic mergers, acquisitions, and partnerships are frequent, enabling firms to expand geographic reach and technological capabilities. Competition is further intensified by low-cost manufacturers from Asia, particularly China, which challenge established brands on price competitiveness. To maintain market leadership, companies emphasize ergonomic designs, aftersales support, and fleet management solutions, addressing rising demand from logistics, manufacturing, and retail sectors worldwide.
Shape Your Report to Specific Countries or Regions & Enjoy 30% Off!
Key Players
- Toyota Material Handling
- KION Group
- Jungheinrich
- Hyster-Yale Materials Handling
- Crown Equipment Corporation
- Goscor Lift Trucks
- Hyundai Heavy Industries
- Thermote & Vanhalst Group
- Liftek FZC
- Nido Machineries Pvt Ltd
- Nilkamal Limited
- Pr Industrial S.r.l.
- Presto Lifts Inc.
- Raymond Handling Concepts Corporation
Recent Developments
- In February 2024, Big Lift LLC completed the acquisition of ePicker LLC, strengthening its electric pallet jack and stacker portfolio while expanding its footprint in the North American market.
- In January 2025, KION Group announced a partnership with NVIDIA and Accenture to integrate “Physical AI” and digital twin solutions, optimizing warehouse automation and efficiency.
- On June 25, 2024, Linde Material Handling (KION North America) introduced two new pallet trucks, the MT15B and MT22, featuring Li-ION batteries, fast charging capability, and ergonomic designs to enhance warehouse efficiency.
- On March 20, 2025, Hangcha unveiled its A Series lithium pallet truck at ProMat, featuring a built-in charger, faster charging capability, and improved warehouse efficiency
Market Concentration & Characteristics
The Pallet Truck Market shows moderate concentration with a mix of global leaders and strong regional players. Large multinational companies dominate through advanced product lines, innovation in electric and semi-electric trucks, and extensive distribution networks. Regional manufacturers compete by offering affordable and customized solutions that suit local industrial needs. The market is characterized by steady technological upgrades, rising demand for ergonomic designs, and integration of digital monitoring features. It reflects a balance between cost-sensitive buyers preferring manual models and advanced users adopting electric pallet trucks for efficiency. Intense competition encourages continuous investment in automation, safety, and sustainability. It highlights the importance of aftersales service, product durability, and operational efficiency as decisive factors for buyer preference. The market demonstrates steady growth momentum supported by expanding logistics, manufacturing, and retail sectors, while competitive pricing from Asian manufacturers continues to influence market dynamics and profitability across global and regional levels.
Report Coverage
The research report offers an in-depth analysis based on Control Type, Type, End User Industry, Load Capacity and Region. It details leading market players, providing an overview of their business, product offerings, investments, revenue streams, and key applications. Additionally, the report includes insights into the competitive environment, SWOT analysis, current market trends, as well as the primary drivers and constraints. Furthermore, it discusses various factors that have driven market expansion in recent years. The report also explores market dynamics, regulatory scenarios, and technological advancements that are shaping the industry. It assesses the impact of external factors and global economic changes on market growth. Lastly, it provides strategic recommendations for new entrants and established companies to navigate the complexities of the market.
Future Outlook
- Electric pallet trucks will expand rapidly, driven by sustainability goals, efficiency improvements, and lower emissions.
- Manual pallet trucks will maintain relevance in cost-sensitive markets, supporting small warehouses and retail operations.
- IoT-enabled pallet trucks will enhance fleet tracking, predictive maintenance, and real-time warehouse performance monitoring.
- Expanding e-commerce sector will accelerate pallet truck demand, supporting efficient logistics, warehousing, and delivery operations.
- Emerging economies will provide growth opportunities, driven by urbanization, infrastructure development, and industrialization expansion.
- Ergonomic pallet truck designs will gain preference, ensuring worker safety, efficiency, and reduced operational fatigue.
- Cold chain expansion will fuel demand for pallet trucks supporting noise-free operations and temperature stability.
- Strategic acquisitions and partnerships will strengthen players’ competitive advantage and expand product portfolios globally.
- Semi-electric pallet trucks will attract SMEs, balancing affordability, labor reduction, and partial mechanization benefits.
- Asian low-cost manufacturers will challenge global players, influencing pricing strategies and market share dynamics worldwide.


