
| REPORT ATTRIBUTE | DETAILS |
|---|---|
| Historical Period | 2019-2022 |
| Base Year | 2023 |
| Forecast Period | 2024-2032 |
| Phenoxyethanol Preservatives Market Size 2024 | USD 269 million |
| Phenoxyethanol Preservatives Market, CAGR | 5.75% |
| Phenoxyethanol Preservatives Market Size 2032 | USD 420.722 million |
Market Overview:
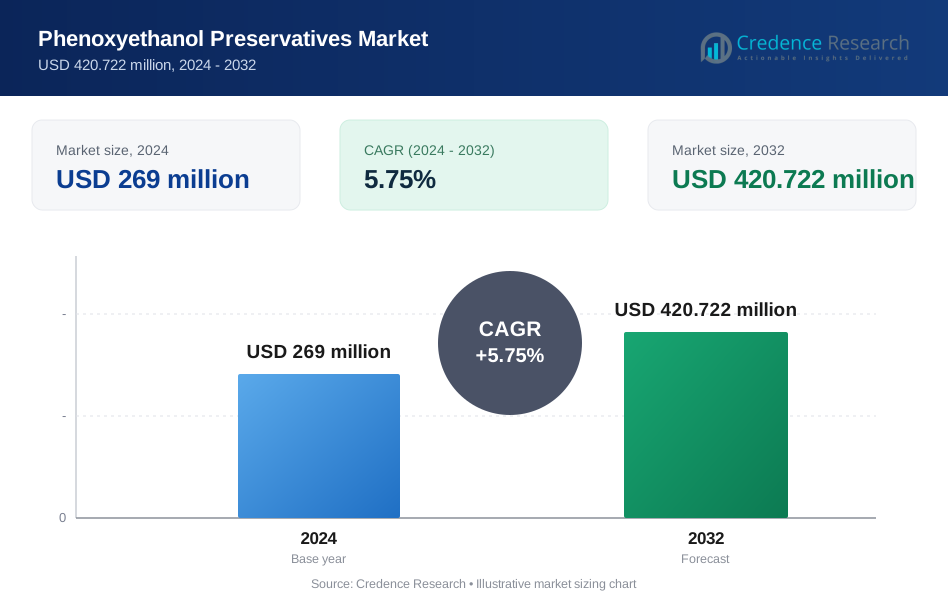
The Phenoxyethanol Preservatives Market is projected to grow from USD 269 million in 2024 to an estimated USD 420.722 million by 2032, with a compound annual growth rate (CAGR) of 5.75% from 2024 to 2032.
Key drivers of the phenoxyethanol preservatives market include the growing demand for safer, non-toxic alternatives to traditional preservatives like parabens in cosmetics and personal care products. Consumers are increasingly prioritizing skin-friendly formulations, pushing manufacturers to adopt phenoxyethanol due to its broad-spectrum antimicrobial properties and lower risk of irritation. The rise in demand for natural and organic personal care products has further fueled the need for preservatives that are both effective and mild, making phenoxyethanol an ideal choice. Additionally, its use in the pharmaceutical sector, especially in vaccines, topical medications, and injectable drugs, underscores its versatility across industries. Regulatory bodies, including the U.S. FDA and the European Commission, approve the use of phenoxyethanol, enhancing market confidence and adoption. Moreover, the growing awareness of personal hygiene and grooming, particularly post-pandemic, has led to a surge in demand for personal care products, further driving the market.
Regionally, North America commands a significant share of the phenoxyethanol preservatives market, led by the U.S., where there is high demand for premium and safer cosmetic products. The region's strict regulatory landscape and consumer shift towards cleaner beauty are encouraging manufacturers to adopt phenoxyethanol as a safer alternative. Europe follows closely, driven by stringent regulations on cosmetic preservatives and increasing consumer awareness of product safety. The Asia Pacific region is poised for the fastest growth, particularly in countries like China, India, and South Korea, where the cosmetics and personal care industries are expanding rapidly. Rising disposable incomes, growing urbanization, and heightened interest in beauty products in these markets contribute to the region’s growth. Meanwhile, Latin America and the Middle East & Africa are emerging markets where increasing consumer awareness, coupled with economic growth, is leading to higher demand for safer, preservative-rich personal care products.
Market Drivers:
Rising Consumer Demand for Paraben-Free Products:
One of the primary drivers of the phenoxyethanol preservatives market is the increasing consumer preference for paraben-free personal care and cosmetic products. Over recent years, there has been a growing awareness of the potential health risks associated with parabens, which are commonly used as preservatives in various products. This shift in consumer preferences has led manufacturers to seek safer alternatives, with phenoxyethanol emerging as an ideal option due to its antimicrobial properties and milder impact on the skin. As more consumers prioritize the safety and transparency of the ingredients in their beauty products, demand for phenoxyethanol as a preservative continues to rise. For instance, data from companies such as Procter & Gamble Co. (P&G) and L’Oréal show that over 60% of their new paraben-free product lines now contain phenoxyethanol
Expanding Use in the Pharmaceutical Sector:
In addition to its widespread application in cosmetics and personal care, phenoxyethanol has become increasingly important in the pharmaceutical sector. It is commonly used as a preservative in vaccines, injectable drugs, and topical treatments to prevent microbial contamination. The pharmaceutical industry values phenoxyethanol for its effectiveness in preserving drug formulations without compromising safety. As the global pharmaceutical market continues to expand, particularly in response to increasing healthcare needs and advancements in drug development, the demand for reliable preservatives like phenoxyethanol is expected to grow. This trend is further fueled by the rising production of vaccines and injectables, especially in the context of global healthcare challenges.
Growth in Natural and Organic Personal Care Products:
The phenoxyethanol preservatives market is also benefiting from the growth of the natural and organic personal care industry. Consumers are increasingly opting for natural and eco-friendly products, which has put pressure on manufacturers to find preservatives that align with these values. Phenoxyethanol is often chosen as it is considered a safer and less irritating alternative to synthetic preservatives, making it suitable for use in products labeled as “natural” or “organic.” As the global trend toward sustainability and cleaner beauty intensifies, the need for effective but gentle preservatives like phenoxyethanol is becoming more critical in the formulation of personal care products. This shift has broadened the market scope for phenoxyethanol in the natural beauty segment. For instance, data from companies such as The Body Shop and Burt’s Bees indicate that over 50% of their natural and organic product lines now use phenoxyethanol
Regulatory Support and Industry Standards:
Another significant driver for the phenoxyethanol preservatives market is the strong regulatory support from various governing bodies, particularly in the U.S. and Europe. Regulatory agencies such as the U.S. FDA and the European Commission have approved phenoxyethanol for use in personal care, cosmetic, and pharmaceutical products, reinforcing its position as a safe preservative. These approvals and the establishment of industry standards have provided manufacturers with the confidence to incorporate phenoxyethanol into a wide range of products. As regulatory frameworks become stricter regarding the use of harmful preservatives, phenoxyethanol continues to stand out as a compliant, safe, and effective alternative, driving its increased adoption across multiple sectors.
Market Trends:
Growing Demand for Clean Label Products:
One of the significant trends in the phenoxyethanol preservatives market is the increasing demand for clean label products, particularly in the cosmetics and personal care industries. Consumers are becoming more aware of the ingredients in the products they use daily and are seeking transparency from brands. This shift has led to a rise in demand for formulations free from potentially harmful chemicals, such as parabens and sulfates. Phenoxyethanol, known for its mild preservative properties, fits well into this trend, as it provides effective antimicrobial protection while aligning with the growing consumer preference for clean and safe ingredients. For instance, data from Procter & Gamble Co. (P&G) shows that over 60% of their new paraben-free product lines now contain phenoxyethanol1. Additionally, L’Oréal has reported that approximately 70% of their skincare products now feature phenoxyethanol as a preservative.
Innovation in Formulations and Preservative Technologies:
Innovation in cosmetic and personal care formulations is another driving trend in the phenoxyethanol preservatives market. Manufacturers are focusing on developing advanced preservative systems that meet consumer demands for both efficacy and safety. Phenoxyethanol is increasingly used in combination with other natural preservatives to create synergistic effects that improve product shelf life while minimizing skin irritation. Additionally, new formulations are being designed to incorporate phenoxyethanol in lower concentrations without compromising its antimicrobial efficacy. These innovations are not only broadening the application range of phenoxyethanol but also helping manufacturers meet the rising regulatory requirements for safer and more sustainable ingredients.
Shift Toward Sustainable and Eco-Friendly Ingredients:
Sustainability is playing a crucial role in shaping the future of the phenoxyethanol preservatives market. There is a growing trend toward the use of eco-friendly and sustainable ingredients in both cosmetics and personal care products. Consumers are now more inclined to purchase products that have a reduced environmental impact, prompting manufacturers to source preservatives that align with these values. Phenoxyethanol is often favored as it is a biodegradable compound and considered safer for the environment compared to synthetic alternatives. This shift toward sustainability has led to increased research and development in creating greener formulations that incorporate phenoxyethanol while maintaining product safety and efficacy.
Regional Market Expansion in Emerging Economies:
The phenoxyethanol preservatives market is witnessing a notable trend of regional expansion, particularly in emerging economies across Asia Pacific and Latin America. The growing middle class in countries such as China, India, and Brazil is driving demand for personal care products, boosting the adoption of phenoxyethanol preservatives in these regions. Additionally, increasing consumer awareness regarding product safety and ingredient transparency is pushing local manufacturers to opt for safer preservatives like phenoxyethanol. For example, data from Brazil’s Association for the Personal Hygiene, Perfume, and Cosmetics Industry (ABIHPEC) indicates that over 9.4% of the global beauty product market is now accounted for by Brazil, with phenoxyethanol being a key preservative in many of these products. The cosmetics and personal care sectors in these regions are expanding rapidly, and as regulatory frameworks evolve, phenoxyethanol is expected to see greater market penetration, contributing to the overall growth of the market in these emerging economies.
Market Restraints and Challenges:
Regulatory Restrictions and Safety Concerns:
One of the key restraints in the phenoxyethanol preservatives market is the increasing regulatory scrutiny and safety concerns surrounding its use in personal care and cosmetic products. While phenoxyethanol is widely approved for use in various formulations, its concentration is regulated in several regions, with strict limits on its permissible levels. For instance, the European Commission restricts phenoxyethanol usage in cosmetics to a maximum of 1%. Concerns over potential skin irritation and allergic reactions have prompted calls for further research, leading to heightened regulatory attention. This has created challenges for manufacturers in ensuring compliance while maintaining product efficacy, especially in markets where regulatory frameworks are evolving.
Competition from Natural Preservatives:
The growing trend towards natural and organic products poses a challenge to the phenoxyethanol preservatives market, as consumers increasingly prefer formulations that use natural preservatives. Ingredients such as essential oils, plant extracts, and other bio-based preservatives are gaining traction, as they align with the rising demand for clean beauty and eco-friendly products. As a result, phenoxyethanol, despite its efficacy and relative safety, faces competition from these natural alternatives. This shift towards natural ingredients is pushing manufacturers to explore alternative preservation methods, which could slow the growth of phenoxyethanol in certain segments of the market.
High Costs of Formulation Adjustments:
Another challenge in the phenoxyethanol preservatives market is the high cost associated with adjusting product formulations to meet changing regulatory standards and consumer demands. Reformulating products to comply with safety regulations or to align with clean label trends often requires significant investment in research and development. Additionally, incorporating phenoxyethanol in conjunction with other preservatives or at lower concentrations can pose technical challenges, as it may affect the overall stability and performance of the product. These costs and technical hurdles can be a barrier for smaller manufacturers, limiting their ability to adapt and compete in the evolving market.
Market Segmentation Analysis:
By form, the market is divided into powder and liquid. Liquid phenoxyethanol holds a larger share due to its ease of incorporation in a wide range of cosmetic, pharmaceutical, and personal care formulations. Liquid phenoxyethanol is particularly favored in applications where consistent dispersion and stability are required, such as in creams, lotions, and shampoos. The powder form, while less common, is gaining traction in specialized applications where more controlled release or longer shelf life is essential.
By end-use application, the market is segmented into feed grade, food grade, cosmetic grade, and pharma grade. Cosmetic grade phenoxyethanol dominates the market, driven by increasing demand for safer, paraben-free preservatives in personal care products like creams, lotions, and shampoos. Pharma grade phenoxyethanol is widely used as a preservative in vaccines, injectable drugs, and topical treatments, offering microbial protection without compromising safety. Food grade phenoxyethanol, though less prevalent, is utilized for its preservative properties in certain food formulations. Feed grade applications are niche but are expanding due to the need for effective microbial control in animal feed products. The versatility of phenoxyethanol across these sectors contributes to its growing market presence.
Segmentation:
By Form:
- Powder
- Liquid
By End Use Application:
- Feed Grade
- Food Grade
- Cosmetic Grade
- Pharma Grade
- North America
- U.S.
- Canada
- Mexico
- Europe
- Germany
- France
- U.K.
- Italy
- Spain
- Rest of Europe
- Asia Pacific
- China
- Japan
- India
- South Korea
- South-east Asia
- Rest of Asia Pacific
- Latin America
- Brazil
- Argentina
- Rest of Latin America
- Middle East & Africa
- GCC Countries
- South Africa
- Rest of the Middle East and Africa
Regional Analysis:
North America
North America holds a significant share of the phenoxyethanol preservatives market, accounting for approximately 35% of the global market in 2023. This dominance is primarily driven by the robust demand for cosmetics, personal care, and pharmaceutical products in the United States and Canada. The region’s consumers are increasingly inclined toward paraben-free and safer formulations, which has encouraged manufacturers to adopt phenoxyethanol as a key preservative. Moreover, the strong regulatory framework set by agencies like the U.S. Food and Drug Administration (FDA) supports the use of phenoxyethanol in cosmetics and pharmaceuticals, further boosting its adoption. The presence of leading industry players and continuous innovations in product formulations also contribute to North America’s market leadership.
Europe
Europe follows closely behind North America, with an estimated 30% market share in the phenoxyethanol preservatives market. The region’s growth is largely attributed to stringent regulations by the European Commission, which restricts the use of certain preservatives in cosmetic products, pushing manufacturers to seek safer alternatives like phenoxyethanol. The demand for natural, organic, and clean-label products is particularly strong in Europe, especially in countries like Germany, France, and the UK, where consumers are highly conscious of ingredient safety and environmental impact. This has led to widespread adoption of phenoxyethanol in the cosmetics and personal care sectors. Additionally, the region's well-established pharmaceutical industry has further driven demand for phenoxyethanol as a preservative in drug formulations.
Asia Pacific
The Asia Pacific region is expected to experience the fastest growth in the phenoxyethanol preservatives market, currently holding around 25% of the global market share. The booming personal care and cosmetics industry, particularly in China, India, Japan, and South Korea, is a key driver of this growth. Rising disposable incomes, urbanization, and increasing awareness of skincare and beauty products have fueled demand for cosmetics, many of which use phenoxyethanol as a preservative. Furthermore, the region’s expanding pharmaceutical sector, coupled with rising healthcare investments, has increased the demand for phenoxyethanol in various drug formulations. The market in Asia Pacific is set to expand significantly as regulatory frameworks continue to evolve and consumers seek safer, more effective products.
Latin America and Middle East & Africa
Latin America and the Middle East & Africa collectively account for the remaining 10% of the global phenoxyethanol preservatives market. While these regions are still in the early stages of market development, rising consumer awareness regarding product safety and the increasing adoption of personal care products are contributing to moderate market growth. Brazil and South Africa are key emerging markets within these regions, with improving economic conditions and growing demand for cosmetics and pharmaceuticals expected to drive further expansion. As healthcare infrastructure improves, the demand for safer preservatives like phenoxyethanol in both personal care and pharmaceutical applications is expected to rise.
Key Player Analysis:
- Akema Fine Chemicals
- Ashland Global Speciality Chemicals Inc.
- BASF SE
- Clariant AG
- Dow
- Dupont
- Galaxy Surfactants Ltd.
- Lonza Group AG
- Schülke and Mayr GmbH
- Symrise AG
- Thor Personal Care
Competitive Analysis:
The phenoxyethanol preservatives market is highly competitive, with several key players dominating the global landscape. Major companies such as Clariant, BASF SE, Ashland Global Holdings, Symrise AG, and Akema Fine Chemicals hold significant market share due to their broad product portfolios, strong distribution networks, and continuous innovation in preservative technologies. These market leaders are focusing on expanding their presence by developing safer, eco-friendly alternatives and meeting the rising demand for clean-label products in personal care and cosmetics. Smaller and regional players are also gaining traction by catering to niche markets and offering specialized formulations. Strategic mergers, acquisitions, and partnerships are common strategies employed by key players to strengthen their market position and expand their product offerings. As consumer preferences shift towards safer and more natural preservatives, the competitive landscape is expected to remain dynamic, with companies investing in research and development to stay ahead in this evolving market.
Recent Developments:
- In March 2024 Lonza's share price rose after announcing its agreement to acquire a U.S. manufacturing facility from Roche for approximately USD 1.2 billion in cash. This acquisition is intended to strengthen Lonza's biologics division and support its growth in the life sciences sector.
- In September 2023 Clariant launched Phenoxetol SG, a bio-ethanol-based preservative specifically designed for antibacterial applications. It is suitable for use in creams, lotions, liquid soaps, wet wipes, hair conditioners, and shampoos. The preservative features a renewable carbon index (RCI) of 25%, meaning it possesses the same chemical properties as its fossil-based equivalent, reducing the need for reformulation.
Market Concentration & Characteristics:
The phenoxyethanol preservatives market exhibits moderate market concentration, with a mix of large multinational corporations and smaller regional players. Leading companies such as Clariant, BASF SE, and Ashland Global Holdings dominate the market due to their extensive product offerings, strong distribution networks, and advanced research and development capabilities. These companies hold a significant portion of the market share, but the presence of smaller competitors that cater to niche segments creates a diverse competitive landscape. The market is characterized by increasing demand for safer, eco-friendly preservatives, which has led to heightened innovation in preservative technologies. Additionally, regulatory restrictions on harmful preservatives, particularly in Europe and North America, have prompted manufacturers to shift toward phenoxyethanol as a preferred alternative. As the market continues to evolve, companies are focusing on product differentiation, strategic partnerships, and expanding their global reach to maintain a competitive edge.
Report Coverage:
The research report offers an in-depth analysis based on By Form and By End Use Application. It details leading market players, providing an overview of their business, product offerings, investments, revenue streams, and key applications. Additionally, the report includes insights into the competitive environment, SWOT analysis, current market trends, as well as the primary drivers and constraints. Furthermore, it discusses various factors that have driven market expansion in recent years. The report also explores market dynamics, regulatory scenarios, and technological advancements that are shaping the industry. It assesses the impact of external factors and global economic changes on market growth. Lastly, it provides strategic recommendations for new entrants and established companies to navigate the complexities of the market.
Future Outlook:
- Growing demand for paraben-free products will drive the adoption of phenoxyethanol in cosmetics and personal care formulations.
- Advancements in preservative technologies will enhance the effectiveness and safety of phenoxyethanol-based products.
- Rising consumer preference for clean-label ingredients will increase demand for phenoxyethanol in natural and organic products.
- Expansion of the pharmaceutical industry, particularly in vaccines and injectables, will boost the use of phenoxyethanol as a preservative.
- Regulatory support for safer preservatives will further encourage phenoxyethanol adoption in Europe and North America.
- Increasing investments in research and development will lead to innovations in phenoxyethanol formulations for broader applications.
- Rapid growth of the cosmetics industry in emerging markets, such as Asia Pacific, will accelerate phenoxyethanol market expansion.
- Heightened awareness of environmental sustainability will push manufacturers to use phenoxyethanol in eco-friendly product lines.
- Strategic partnerships and acquisitions will shape the competitive landscape and drive market consolidation.
- Growing focus on consumer safety will continue to fuel demand for phenoxyethanol as a reliable preservative across industries.
Request a Free Sample
Fill in your details and we'll send you a free sample report.
- Sample data tables & charts
- Research methodology
Need a Custom Version of This Report?
Tailor the scope, geography, or segments to your exact requirements.
- Custom geography or segment scope
- Direct access to our analyst team
Frequently Asked Questions
What is the projected growth of the Phenoxyethanol Preservatives Market?
What drives the demand for phenoxyethanol preservatives?
Which region is expected to grow the fastest?
What challenges does the phenoxyethanol preservatives market face?
Table of Content
Chapter 1. Report Introduction
- 1.1 Report Description & Purpose
- 1.1.1 Report Title & Market Definition
- 1.1.2 Unique Selling Propositions (USP) & Key Differentiators
- 1.1.3 Value Proposition for Stakeholders
- 1.2 Research Objectives
- 1.2.1 Market Sizing Objectives (Volume & Revenue)
- 1.2.2 Segmentation Objectives
- 1.2.3 Competitive Intelligence Objectives
- 1.2.4 Forecast & Scenario Objectives
- 1.3 Report Scope
- 1.3.1 Phenoxyethanol Preservatives Scope – Types & Subtypes Covered
- 1.3.2 Geographic Scope – Regions & Countries Covered
- 1.3.3 Historical Period, Base Year & Forecast Period (2024; forecast to 2032)
- 1.3.4 Inclusions & Exclusions
- 1.4 HS Code & Classification Framework
- 1.5 Currency, Units & Pricing Basis
- 1.6 Target Stakeholders
- 1.7 Limitations & Assumptions
Chapter 2. Executive Summary
- 2.1 Global Phenoxyethanol Preservatives Market Snapshot
- 2.1.1 Market Size – Historical (2024) & Forecast (2024-2032) (2024: USD 269 million → 2032: USD 420.722 million)
- 2.1.2 Volume & Revenue – Global Totals
- 2.1.3 Key Market Highlights – Top Five Facts
- 2.2 Phenoxyethanol Preservatives Market Segmentation Snapshot
- 2.2.1 Market Split by Region – 2024 vs. 2032
- 2.3 Competitive Snapshot
- 2.3.1 Top 10 Players by Revenue Share – 2024
- 2.3.2 Top 10 Players by Volume Share – 2024
- 2.3.3 Recent Strategic Developments (18-Month Summary)
- 2.4 Key Investment Highlights & Strategic Conclusions
Chapter 3. Phenoxyethanol Preservatives Market Dynamics & Industry Analysis
- 3.1 Market Overview & Context
- 3.1.1 Phenoxyethanol Preservatives Market Position in the Broader Automotive Value Chain
- 3.1.2 OEM vs. Replacement Market Dynamics
- 3.1.3 Market Maturity & Development Stage by Region
- 3.2 Phenoxyethanol Preservatives Market Drivers
- 3.3 Phenoxyethanol Preservatives Market Restraints & Challenges
- 3.4 Phenoxyethanol Preservatives Market Opportunities
- 3.5 Porter's Five Forces Analysis
- 3.5.1 Threat of New Entrants
- 3.5.2 Bargaining Power of Suppliers
- 3.5.3 Bargaining Power of Buyers
- 3.5.4 Threat of Substitutes
- 3.5.5 Competitive Rivalry – Intensity Assessment
- 3.6 Phenoxyethanol Preservatives Value Chain Analysis
- 3.6.1 Upstream – Raw Material/Input Suppliers
- 3.6.1.1 Raw Material/Input 1
- 3.6.1.2 Raw Material/Input 2
- 3.6.1.3 Raw Material/Input 3
- 3.6.2 Midstream – Production/Manufacturing/Service Delivery
- 3.6.2.1 Production/Process Overview
- 3.6.2.2 Key Facility Locations & Capacity by Manufacturer
- 3.6.3 Downstream – Distribution & End Consumer
- 3.6.3.1 Primary Channel – B2B/OEM
- 3.6.3.2 Secondary Channels – Dealer, Retail, Online, Direct
- 3.6.4 Value Chain Profitability Analysis
- 3.6.1 Upstream – Raw Material/Input Suppliers
- 3.7 PESTEL Analysis
- 3.7.1 Political Factors
- 3.7.2 Economic Factors
- 3.7.3 Social Factors
- 3.7.4 Technological Factors
- 3.7.5 Environmental Factors
- 3.7.6 Legal Factors
- 3.8 Phenoxyethanol Preservatives Supply Chain Analysis
- 3.8.1 Raw Material/Input Supply Risk Assessment
- 3.8.2 Manufacturing Concentration Risk (Geographic Exposure)
- 3.8.3 Trade Disruption Impact Analysis
- 3.9 Regulatory & Policy Landscape
Note: The regulatory and policy landscape section covers regulations based on their applicability to the market, Phenoxyethanol Preservatives category, geography, and scope of the study. Only regulatory frameworks with a material impact on operations, compliance, trade, sustainability, or market access are analyzed in detail.
Chapter 4. Key Investment Pockets & Opportunity Analysis
- 4.1 Phenoxyethanol Preservatives Market Attractiveness Analysis
- 4.1.1 By Region – Investment Attractiveness Matrix (Volume × CAGR)
- 4.2 Absolute Revenue Growth Opportunity
- 4.2.1 By Region – Absolute USD Growth Through 2032
- 4.3 Incremental Volume Opportunity
- 4.3.1 By Region – Incremental Volume Through 2032
- 4.3.2 Segment – Incremental Volume
- 4.4 Emerging Submarket Opportunity Deep Dive (Subject to Applicability)
- 4.5 Emerging Market Opportunity Scorecards
- 4.5.1 United States
- 4.5.2 Europe
- 4.5.3 Asia
- 4.5.4 Middle East & Africa
Note: Emerging Market Opportunity Scorecards will be included based on relevance and strategic importance. Regions listed are indicative and may vary depending on data availability and market dynamics.
Chapter 5. Phenoxyethanol Preservatives Import-Export Analysis & Trade Flows
- 5.1 Global Trade Overview
- 5.1.1 Global Export Value by Country (2024)
- 5.1.2 Global Export Volume by Country (2024)
- 5.1.3 Global Import Value by Country (2024)
- 5.1.4 Global Import Volume by Country (2024)
- 5.1.5 Net Trade Balance by Country (2024)
- 5.2 Export Analysis – Segment
- 5.2.1 Type 1 (HS Code)
- 5.2.2 Type 2 (HS Code)
- 5.2.3 Type 3 (HS Code)
- 5.2.4 Type 4 (HS Code)
- 5.2.5 Type 5 (HS Code)
- 5.3 Import Analysis – Segment
- 5.3.1 Type 1 (HS Code)
- 5.3.2 Type 2 (HS Code)
- 5.3.3 Type 3 (HS Code)
- 5.3.4 Type 4 (HS Code)
- 5.3.5 Type 5 (HS Code)
- 5.4 Average Unit Trade Prices
- 5.4.1 Average Export Price – Segment & Country
- 5.4.2 Average Import Price – Segment & Source Country
- 5.4.3 Price Trends (2024)
- 5.5 Key Trade Route Analysis
- 5.5.1 Trade Route 1
- 5.5.2 Trade Route 2
- 5.5.3 Trade Route 3
- 5.5.4 Trade Route 4
- 5.5.5 Trade Route 5
- 5.6 Trade Policy Impact Assessment
- 5.6.1 US Anti-Dumping & Section 301 Tariffs
- 5.6.2 EU Customs Union Impact
- 5.6.3 Major Free Trade Agreements
- 5.6.4 USMCA Rules of Origin
Note: Trade policy analysis will be included only where relevant to the Phenoxyethanol Preservatives market.
Chapter 6. Competitive Landscape & Company Benchmarking
- 6.1 Phenoxyethanol Preservatives Market Concentration & Structure
- 6.1.1 Herfindahl-Hirschman Index (HHI) – vs. 2024
- 6.1.2 Tier 1, Tier 2 & Tier 3 Market Structure
- 6.1.3 Global, Regional & Local Player Dynamics
- 6.2 Phenoxyethanol Preservatives Market Share Analysis – 2024
- 6.2.1 Global Revenue Share by Company
- 6.2.2 Global Volume Share by Company
- 6.2.3 Regional Revenue Share
- 6.2.4 Market Share Evolution ( vs. 2024)
- 6.2.5 OEM Segment Share by Company
- 6.2.6 Replacement Segment Share by Company
- 6.3 Production/Delivery Capacity & Facility Analysis
- 6.3.1 Global Installed Capacity
- 6.3.2 Capacity Utilization Rates
- 6.3.3 Production/Output Volume
- 6.3.4 Facility Locations & Capacity Map
- 6.3.5 Planned Capacity Additions
- 6.4 Phenoxyethanol Preservatives Competitive Benchmarking Matrix
- 6.4.1 Revenue, Volume, CAGR & Profitability Comparison
- 6.4.2 Channel Revenue Mix
- 6.4.3 Geographic Revenue Exposure
- 6.4.4 R&D Intensity
- 6.4.5 Sustainability Maturity
- 6.5 Strategic Developments in Phenoxyethanol Preservatives (Last 24 Months)
- 6.5.1 Mergers, Acquisitions & Divestments
- 6.5.2 New Phenoxyethanol Preservatives Launches
- 6.5.3 Facility Expansions
- 6.5.4 Strategic Alliances, Joint Ventures & Partnerships
- 6.5.5 Distribution Expansion & Market Entry
- 6.5.6 Sustainability & ESG Initiatives
- 6.6 Competitive Strategy Mapping
- 6.6.1 Leader, Challenger, Follower & Niche Classification
- 6.6.2 Pricing Strategy Comparison
- 6.6.3 Channel Strategy Matrix
Note: Strategic developments are included based on their materiality and the availability of reliable information.
Chapter 7. Global Phenoxyethanol Preservatives Market – By Distribution Channel
- 7.1 Segment Overview
- 7.1.1 Volume & Revenue Split by Channel (2024 & 2032)
- 7.1.2 Channel Mix Evolution (2024-2032)
Chapter 8. Regional Market Analysis – Global Overview
- 8.1 Global Regional Overview
- 8.1.1 Regional Volume Share
- 8.1.2 Regional Revenue Share
- 8.1.3 Regional Volume by Region
- 8.1.4 Regional Revenue by Region
- 8.1.5 Regional Forecast Through 2032
- 8.2 Cross-Regional Segment Analysis
- 8.2.1 By Distribution Channel
- 8.2.2 By Brand/Price Tier
Chapter 9. North America Phenoxyethanol Preservatives Market
- 9.1 United States
- 9.2 Canada
- 9.3 Mexico
Chapter 10. Europe Phenoxyethanol Preservatives Market
- 10.1 Germany
- 10.2 France
- 10.3 Italy
- 10.4 United Kingdom
- 10.5 Spain
- 10.6 Poland
- 10.7 Russia
- 10.8 Netherlands
- 10.9 Belgium
- 10.10 Sweden
- 10.11 Denmark
- 10.12 Norway
- 10.13 Rest of Europe
Chapter 11. Asia Pacific Phenoxyethanol Preservatives Market
- 11.1 China
- 11.2 India
- 11.3 Japan
- 11.4 South Korea
- 11.5 Thailand
- 11.6 Indonesia
- 11.7 Vietnam
- 11.8 Malaysia
- 11.9 Australia
- 11.10 Rest of Asia Pacific
Chapter 12. Latin America Phenoxyethanol Preservatives Market
- 12.1 Brazil
- 12.2 Argentina
- 12.3 Colombia
- 12.4 Chile
- 12.5 Rest of Latin America
Chapter 13. Middle East Phenoxyethanol Preservatives Market
- 13.1 Saudi Arabia
- 13.2 United Arab Emirates
- 13.3 Turkey
- 13.4 Israel
- 13.5 Iran
- 13.6 Rest of the Middle East
Chapter 14. Africa Phenoxyethanol Preservatives Market
- 14.1 South Africa
- 14.2 Egypt
- 14.3 Nigeria
- 14.4 Morocco
- 14.5 Rest of Africa
Chapter 15. Phenoxyethanol Preservatives Company Profiles
- 15.1 [Company 01]
- 15.1.1 Company Overview
- 15.1.2 Key Management Personnel
- 15.1.3 Products & Services Portfolio
- 15.1.4 Financial Performance
- 15.1.5 Key Market Focus & Geographic Presence
- 15.1.6 Recent Developments & Strategic Initiatives
Note: The company profile list is preliminary and may change based on research findings, market developments, data availability, and client requirements.
Chapter 16. Appendices
- Appendix A – List of Abbreviations & Acronyms
- Appendix B – Industry Classification Code Reference – Full Series
- Appendix C – Production & Capacity Data Tables
- Appendix D – End-Use & Demand Base Tables
- Appendix E – Consumption & Replacement Rate Assumptions
- Appendix F – ASP Reference Tables
- Appendix G – Manufacturing & Facility Database
- Appendix H – Import-Export Data Tables
- Appendix I – Regulatory Summary Tables
- Appendix J – Primary Research Participant List (Anonymized)
- Appendix K – Primary Research Questionnaire Framework
- Appendix L – Data Sources & Bibliography
- Appendix M – Market Size Divergence & Source Comparison
Chapter 17. Research Methodology
- 17.1 Research Framework & Philosophy
- 17.2 Secondary Research – Sources, Hierarchy & Data Extraction
- 17.3 Data Modeling – Bottom-Up & Top-Down Market Sizing
- 17.4 Primary Research – Stakeholder Framework, LOI & Sample Sizes
- 17.5 Forecast Methodology – Regression, Scenario & Sensitivity Analysis
- 17.6 Quality Control – Four-Layer Validation Framework
- 17.7 Limitations & Standard Assumptions
- 17.8 Disclaimer
