Market Overview:
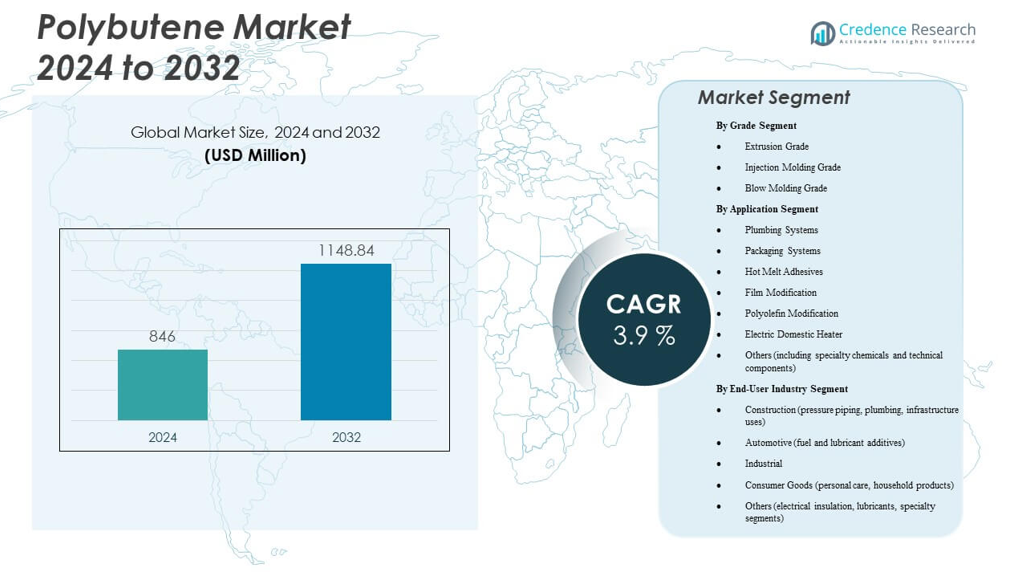
The Polybutene Market is projected to grow from USD 846 million in 2024 to an estimated USD 1,148.84 million by 2032, with a compound annual growth rate (CAGR) of 3.9% from 2024 to 2032.
| REPORT ATTRIBUTE |
DETAILS |
| Historical Period |
2020-2023 |
| Base Year |
2024 |
| Forecast Period |
2025-2032 |
| Polybutene Market Size 2024 |
USD 846 million |
| Polybutene Market, CAGR |
3.9% |
| Polybutene Market Size 2032 |
USD 1,148.84 million |
Growth in the Polybutene Market is primarily driven by rising demand for lightweight and durable materials in infrastructure, packaging, and adhesive applications. Polybutene’s superior flexibility, thermal stability, and chemical resistance make it ideal for pipes, sealants, and high-performance films. Manufacturers adopt advanced polymerization techniques to enhance product performance and expand its use in hot melt adhesives and polyolefin modification. Expanding construction activities and the push for sustainable polymers further strengthen market adoption across industries.
Asia-Pacific leads the market, supported by rapid industrialization, construction expansion, and growing packaging consumption in China, India, and South Korea. Europe follows with strong demand for recyclable and eco-compliant materials in industrial and automotive sectors. North America records steady adoption in lubricant additives and advanced packaging. Emerging economies in Latin America and the Middle East & Africa are investing in infrastructure and manufacturing capabilities, strengthening the region’s role in future polybutene supply chains.
Market Insights:
- The Polybutene Market is projected to grow from USD 846 million in 2024 to USD 1,148.84 million by 2032, at a CAGR of 3.9%.
- Demand rises due to growing use in piping, adhesives, and flexible packaging applications.
- Manufacturers focus on developing high-performance and recyclable polymer grades to meet sustainability goals.
- Volatile feedstock prices and competition from alternative polymers restrict growth potential in cost-sensitive sectors.
- Asia-Pacific leads market expansion driven by construction, infrastructure, and packaging industries.
- Europe advances through regulatory focus on recyclable materials and sustainable manufacturing processes.
- North America grows steadily with innovation in lubricants and film-grade polybutene formulations.
Access crucial information at unmatched prices!
Request your sample report today & start making informed decisions powered by Credence Research Inc.!
Download Sample
Market Drivers
Growing Demand from Industrial End‑Use Sectors
The Polybutene Market benefits from expanding activities in construction, packaging and automotive industries that require high‑performance materials. Producers see increased uptake of polybutene because it offers flexibility, chemical resistance and long‑term durability under challenging conditions. End‑users actively replace conventional plastics and sealants with polybutene‑based solutions to meet stricter performance and regulatory requirements. The material’s compatibility with low‑temperature applications and complex processing strengthens its appeal across diverse segments. Manufacturers invest in downstream development to deploy polybutene in hot‑melt adhesives and pipe systems. Supply chains respond by prioritising secure feedstock streams and efficient logistics to keep pace with demand momentum. Growth in emerging markets plays a critical role by driving volume and scale for polybutene producers.
- For instance, LyondellBasell Industries Holdings B.V.’s PB-1 piping systems demonstrated a 90% reduction in pipe-borne noise in the Royal Albert Hall, London, through thinner wall construction and enhanced acoustic damping.
Technological Innovations and Grade Improvements Drive Adoption
Advances in polymerisation, catalyst development and formulation technology bolster the polybutene market by enabling tailored grades for specific uses. Research efforts focus on improving melt‑flow, creep resistance and sealing integrity so that material performance meets exacting standards. It finds expanded utility in extrusion, injection moulding and blow‑moulding applications thanks to these technical improvements. Equipment and processing enhancements help manufacturers convert polybutene with lower scrap rates and improved throughput, making it more cost‑effective. The ability to integrate stabilisers and speciality additives broadens the range of applications and reduces failure risk in service. End‑users gain the confidence to deploy the material in critical infrastructure and consumer goods. Suppliers position themselves as solution‑partners by offering technical service, driving faster adoption of advanced polybutene grades.
Sustainability and Regulatory Drivers Encourage Use
Growing pressure on the plastics and polymer industries to meet circular economy targets supports the polybutene market by offering recyclability or compatibility with mono‑polyolefin systems. Stakeholders in packaging, plumbing and construction adopt polybutene grades that align with sustainability goals and regulatory standards. Material manufacturers develop lower‑carbon and bio‑derived polybutene variants to reduce environmental footprint and open new market segments. Regulatory mandates on recycled content and single‑material compatibility reinforce its use in mono‑material packaging solutions. End‑users value that polybutene delivers high‑performance while helping meet regulatory timelines and certification requirements. The sustainability narrative strengthens supplier value propositions and differentiates polybutene in a competitive polymers market.
- For instance, the PB-1-based push-fit piping system by Nueva Terrain has demonstrated over 1 million pressure-cycles from 0.5 to 20 bar, highlighting long-term service reliability under modern regulation for potable-water systems.
Infrastructure Growth and Urbanisation Expand Market Reach
Global infrastructure investment, especially in developing economies, fuels demand for durable plumbing systems, heating installations and modern packaging infrastructure—all of which consume polybutene. Urbanisation drives new residential and commercial construction, directly increasing required volumes of high‑quality piping, adhesives and sealants. In emerging markets, governments prioritise water supply, waste‑treatment and transport networks, creating opportunities for polybutene‑based systems due to their long service‑life and resistance to chemical corrosion. Mature markets revitalise aged infrastructure and upgrade materials to meet stricter performance and sustainability criteria. Suppliers expand production footprint and strategically locate facilities near growing infrastructure hubs to reduce cost and delivery times. The ramp‑up in global construction and industrialisation provides a steady growth platform for the polybutene market.
Market Trends
Shift Towards Lightweight and Mono‑Material Packaging Solutions
The Polybutene Market experiences strong momentum from packaging converters shifting towards lightweight film structures and mono‑material polyolefin designs. Manufacturers embrace polybutene, particularly in easy‑peel and heat‑seal layers, because it enables thinner constructions while preserving barrier and seal integrity. End‑users target simplified recycling and reduced energy consumption in processing. Polymer engineers refine polybutene grades to deliver optimal adhesion, flexibility and seal‑initiation temperatures, making the material more competitive for packaging lines. The trend fuels demand in flexible pouches, resealable packs and consumer food films. Producers respond by optimizing supply chain logistics and partnerships with converters to accelerate commercialisation.
- For instance, LyondellBasell Industries Holdings B.V. included polybutene-1 (PB-1) grades in its mono-material film portfolio that widen the seal-initiation-temperature window and support mono-film packaging for food applications.
Integration into Plumbing and Heating Systems for Premium Applications
The polybutene market shows increasing penetration of polybutene in plumbing and under‑floor heating systems, particularly where performance over decades matters. The polymer’s low modulus, excellent creep resistance and chemical stability attract infrastructure specifiers and OEMs seeking long‑life solutions. Designers favour polybutene piping systems for quiet operation, minimal maintenance and compatibility with potable‑water standards. Suppliers partner with installers and EPC firms to deliver turnkey systems that feature polybutene materials. The result drives value chain alignment and boosts volumes in construction and retrofit projects.
Digitalisation and Smart Applications Catalyse Innovation
Market growth in the polybutene sector involves smart applications and digital integration where sensors, IoT and connectivity converge with material selection. Manufacturers develop polybutene‑based components that support embedded electronics or smart sensors in pipe networks, adhesives or packaging. The material’s processability and stability under thermal‑cycling make it suitable for applications where electronics and polymers must co‑exist. Market players invest in simulation tools, process‑automation and digital service models centred on polybutene solutions. This transition creates differentiation and positions suppliers beyond commodity polymers.
Regional Capacity Expansions and Supply Chain Rationalisation Shape Landscape
Key producers are expanding polybutene capacity in Asia‑Pacific, strengthening supply chains to meet regional demand and reduce freight and logistics overhead. The market trend shows localisation of production near high‑growth end‑use clusters to improve responsiveness and reduce lead‑times. Downstream converters establish regional partnerships and joint ventures centred on polybutene integration. Supply‑chain resilience becomes a key discussion point as major stakeholders seek secure grade availability and feed‑stock flexibility. The trend fosters competition among suppliers to offer value‑added services, local support and technical training, influencing market share and growth trajectories.
- For instance, multiple producers have referenced that PB-1 systems are specified globally in light of supply-chain improvements, and the PBPSA highlights that installers favour the coiled-pipe logistics of PB-1 systems which reduce shipping & handling cost relative to rigid alternatives supporting localised production strategy.
Market Challenges Analysis
Feed‑stock Volatility and High Production Costs Hinder Growth
The Polybutene Market faces significant challenge from fluctuations in petrochemical feed‑stock availability and cost, which directly affect manufacturing margins. Production of butene‑1 and related olefin streams remains concentrated, making supply vulnerable to disruptions and feed‑cost spikes. Smaller producers struggle to achieve scale, limiting their capacity to compete on price with commodity polymers like polyethylene or polypropylene. The high processing and polymerisation costs translate into higher selling prices, restricting adoption in cost‑sensitive end‑use segments. Value chain stakeholders must navigate uncertain raw‑material markets and manage inventory risk to maintain profitability. This cost‑pressure limits deployment in emerging markets where budget constraints dominate material decisions.
Competition from Alternative Materials and Sustainability Constraints Impact Growth
Polybutene competes with well‑established polymers and emerging bio‑based alternatives that offer lower cost or enhanced green credentials, presenting a challenge to broader adoption. Some infrastructure and packaging specifiers favour substitutes with longer track‑records and wider commodity availability. Regulatory shifts push for higher recycled content, circular‑economy compliance and biodegradable options, increasing pressure on polybutene’s value‑proposition if it does not match these credentials. The market must address concerns over recyclability, multi‑material compatibility and lifecycle sustainability to maintain relevance. Failure to demonstrate competitive eco‑performance and cost‑efficiency could hamper growth and limit the material’s market penetration.
Market Opportunities
Development of Bio‑Based and Recycle‑compatible Grades Opens New Markets
The Polybutene Market stands to benefit from the development of bio‑derived feedstocks, recyclable systems and circular‑economy aligned product offerings. Material suppliers can capitalise on growing demand for sustainable solutions by introducing polybutene grades derived from renewable resources or offering enhanced recyclability. End‑users seeking compliance with sustainability mandates and consumer‑driven green preferences present a significant growth avenue. Collaboration among polymer producers, converters and brand‑owners to certify low‑carbon polybutene systems would broaden the addressable market. This focus creates differentiation and expands polybutene into packaging, personal care and premium infrastructure applications.
Emerging Markets and Infrastructure Expansion Provide Untapped Demand
Rapid urbanisation and infrastructure investment in Asia‑Pacific, Latin America and parts of Middle East & Africa create fresh opportunities for the polybutene market. Infrastructure projects require durable piping systems, modern adhesives and advanced packaging solutions—all sectors where polybutene excels. Suppliers that establish regional footprint, technical support and efficient logistics can capture high growth coming from these geographies. Market entry strategies tailored to local requirements, regulation navigation and pricing sensitivity will deliver competitive advantage. This opportunity allows polybutene producers to diversify regionally and reduce reliance on mature markets.
Market Segmentation Analysis:
By Grade Segment
The Polybutene Market is segmented by extrusion, injection molding, and blow molding grades, each serving unique industrial needs. Extrusion grades dominate due to their suitability in pipe systems, films, and sheets requiring excellent flow and mechanical stability. Injection molding grades support precision-engineered parts and components with consistent dimensional accuracy. Blow molding grades cater to packaging applications where flexibility and durability are essential. It continues to gain demand as producers improve formulations for performance, heat resistance, and chemical stability, expanding usability across end-use industries.
By Application Segment
The market serves multiple applications, including plumbing systems, packaging systems, hot melt adhesives, film modification, polyolefin modification, and electric domestic heaters. Plumbing systems lead usage for their reliability and corrosion resistance, while packaging systems rely on polybutene for seal integrity and light-weighting benefits. Hot melt adhesives and film modification applications use it for flexibility and durability, enhancing adhesion and transparency. Polyolefin modification improves mechanical strength in blends, while specialty chemicals and technical components add niche value. It continues to integrate into diverse applications for efficiency and performance benefits.
- For instance, pipes made with certified Polybutene-1 (PB-1) from members of the Polybutene Piping Systems Association (including LyondellBasell and others) meet minimum required strength of 12.5 MPa for potable water as per ISO/TR 9080 and exhibit chlorine resistance tested at over 1,000 hours in water containing 30 ppm chlorine at 30°C/6 bar, as documented by TZW.
By End-User Industry Segment
The end-user segmentation covers construction, automotive, industrial, consumer goods, and other sectors. Construction remains the key consumer due to the need for durable pressure piping and plumbing systems. Automotive uses it in lubricant additives and lightweight polymers to improve performance and reduce emissions. Industrial and consumer goods sectors employ it in packaging, adhesives, and household products that demand flexibility and stability. It maintains growth by aligning with sustainability and durability trends across these industries.
- For instance, in construction and residential hot and cold water systems, Polybutene-1 pipes are confirmed by third-party certification (TZW, WRAS, NSF) to provide a maintenance-free lifespan exceeding 50 years due to their corrosion-free and scale-resistant operation. International standards testing and approvals guarantee compliance and long-term operational security for building developers and utilities worldwide.
Shape Your Report to Specific Countries or Regions & Enjoy 30% Off!
Segmentation:
By Grade Segment
- Extrusion Grade
- Injection Molding Grade
- Blow Molding Grade
By Application Segment
- Plumbing Systems
- Packaging Systems
- Hot Melt Adhesives
- Film Modification
- Polyolefin Modification
- Electric Domestic Heater
- Others (including specialty chemicals and technical components)
By End-User Industry Segment
- Construction (pressure piping, plumbing, infrastructure uses)
- Automotive (fuel and lubricant additives)
- Industrial
- Consumer Goods (personal care, household products)
- Others (electrical insulation, lubricants, specialty segments)
By Regional Segment
- North America
- Europe
- Germany
- France
- U.K.
- Italy
- Spain
- Rest of Europe
- Asia Pacific
- China
- Japan
- India
- South Korea
- South-east Asia
- Rest of Asia Pacific
- Latin America
- Brazil
- Argentina
- Rest of Latin America
- Middle East & Africa
- GCC Countries
- South Africa
- Rest of the Middle East and Africa
Regional Analysis:
Asia Pacific dominates the Polybutene Market with a market share of 41%, supported by robust industrialization, rapid urban development, and expanding infrastructure projects in China, India, and South Korea. Strong demand from plumbing, construction, and packaging industries drives regional consumption. Manufacturers benefit from low-cost feedstock and proximity to key end-user industries, ensuring stable supply chains. Japan and South Korea lead in advanced material applications and research initiatives. It continues to expand in Asia Pacific through regional production hubs and increased investment in performance-grade materials.
Europe holds a 26% market share, driven by sustainability initiatives, stringent regulatory frameworks, and widespread adoption of recyclable materials. The region’s mature infrastructure and industrial base sustain steady demand across construction and automotive sectors. Germany, the UK, and France remain major contributors, focusing on innovative polybutene formulations and green manufacturing processes. It maintains growth through advanced R&D and integration of eco-friendly solutions. Companies emphasize value-added polybutene products that align with regional sustainability goals.
North America accounts for 21% of the global market, supported by modernized construction, packaging innovation, and rising demand in lubricant additives. The United States leads regional adoption through strong manufacturing capabilities and technological advancement in material processing. Mexico and Canada provide additional opportunities in industrial applications and consumer packaging. The Middle East & Africa hold a 7% share, driven by emerging infrastructure projects, while Latin America represents 5%, supported by urbanization and new industrial investment. It benefits from expanding regional diversification and growing awareness of durable material performance.
Key Player Analysis:
- LyondellBasell Industries Holdings B.V.
- BASF SE
- DAELIM
- INEOS Group
- Mitsui Chemicals, Inc.
- Lubrizol Corporation
- Dongfang Hongye Limited Company
- Braskem
- TPC Group
- Ylem Technology Co., Ltd.
- KEMAT Polybutenes
- SOLTEX
- Maharashtra Polybutenes Ltd
- A S Harrison & Co Pty Limited
- Kothari Petrochemicals
- Infineum International Limited
Competitive Analysis:
The Polybutene Market features a moderately consolidated landscape with global players focusing on product innovation and capacity expansion. Leading companies such as LyondellBasell Industries, BASF SE, INEOS Group, and Mitsui Chemicals dominate due to strong technological expertise and extensive distribution networks. Regional firms like Daelim, Kothari Petrochemicals, and Maharashtra Polybutenes strengthen competitiveness through localized production and cost efficiency. It exhibits steady competition among established producers and emerging entrants targeting niche applications. Strategic alliances, sustainable production methods, and product differentiation remain key factors influencing market positioning and long-term profitability.
Recent Developments:
- In October 2024, Envalior GmbH launched its “Pocan X-MB” series of bio-based PBT compounds based on bio-circular 1,4-butanediol (BDO), certified under ISCC PLUS and offering up to 71% sustainable content.
- In February 2024, Mitsubishi Chemical Group Corporation developed its “NOVADURAN ZR Series” foaming polybutylene terephthalate resin and began sample runs in January 2024.
Report Coverage:
The research report offers an in-depth analysis based on Grade Segment, Application Segment and End-User Industry Segment. It details leading market players, providing an overview of their business, product offerings, investments, revenue streams, and key applications. Additionally, the report includes insights into the competitive environment, SWOT analysis, current market trends, as well as the primary drivers and constraints. Furthermore, it discusses various factors that have driven market expansion in recent years. The report also explores market dynamics, regulatory scenarios, and technological advancements that are shaping the industry. It assesses the impact of external factors and global economic changes on market growth. Lastly, it provides strategic recommendations for new entrants and established companies to navigate the complexities of the market.
Future Outlook:
- The Polybutene Market will see rising demand from infrastructure and packaging sectors driven by performance-based applications.
- It is expected to benefit from advancements in catalyst technologies improving polymer consistency and processing efficiency.
- Growing adoption in hot melt adhesives and flexible packaging will support long-term industrial growth.
- Development of bio-based and recyclable grades will align with sustainability and circular economy goals.
- Expanding plumbing and piping infrastructure in emerging economies will boost product penetration.
- Producers will increase investment in regional production hubs to strengthen supply chain resilience.
- Industrial automation and smart material applications will open new opportunities in technical components.
- The market will witness strong competition from regional manufacturers offering customized polymer grades.
- Strategic collaborations between feedstock suppliers and polymer manufacturers will enhance innovation capacity.
- Rising regulatory pressure toward sustainable plastics will shape production and material development strategies.


