
Market Overview
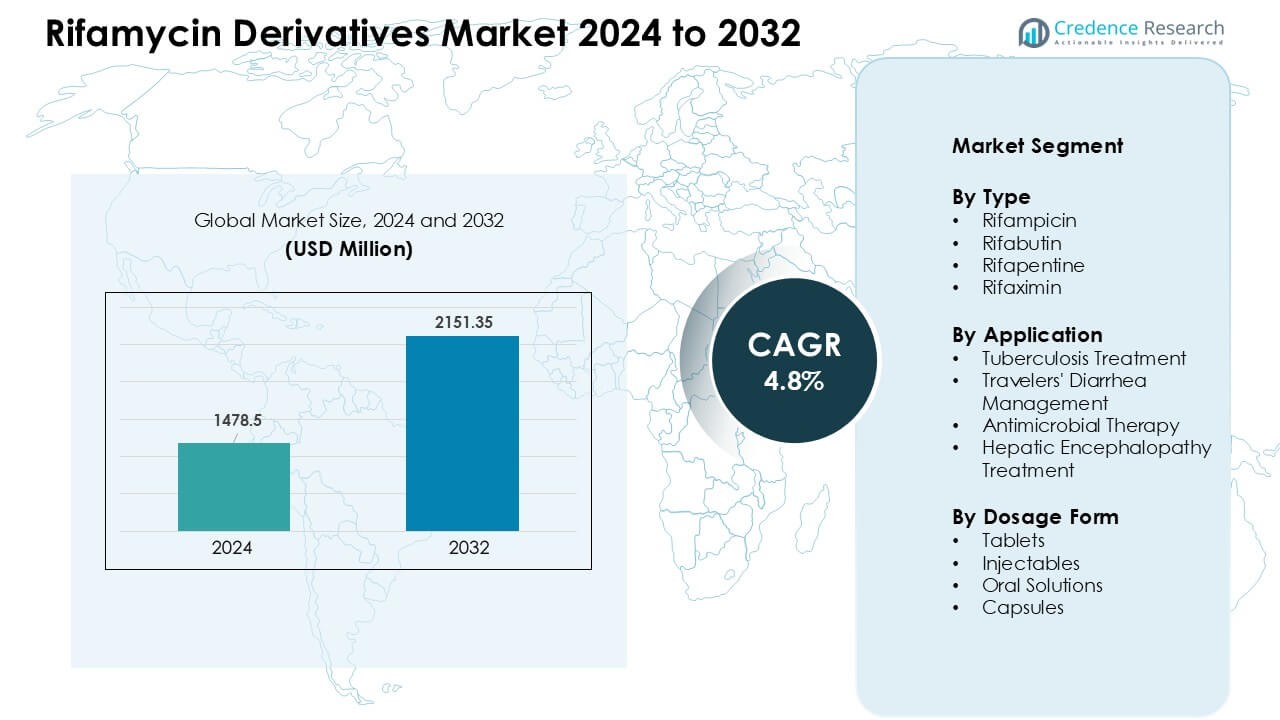
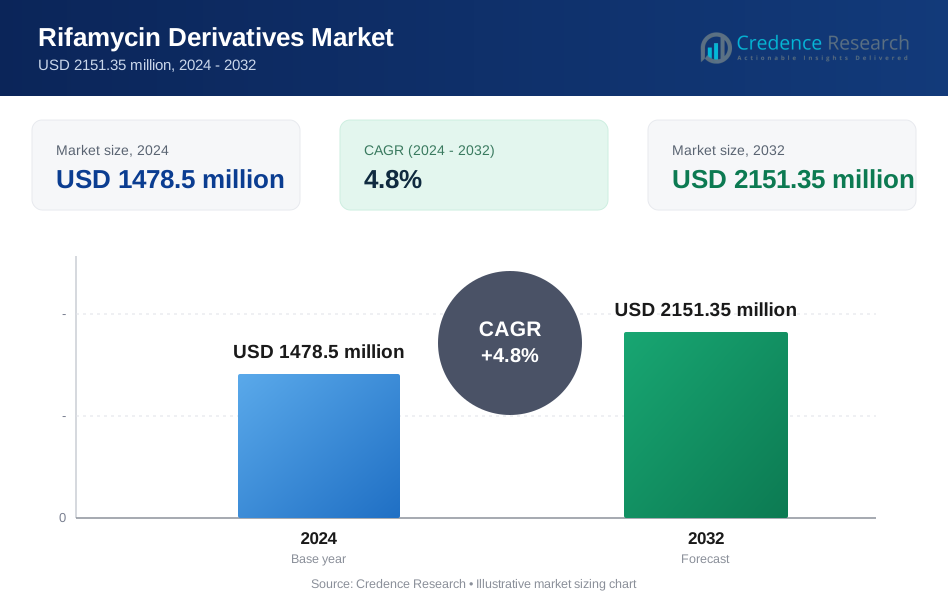
Rifamycin Derivatives Market was valued at USD 1478.5 million in 2024 and is anticipated to reach USD 2151.35 million by 2032, growing at a CAGR of 4.8% during the forecast period.
| REPORT ATTRIBUTE | DETAILS |
|---|---|
| Historical Period | 2020-2023 |
| Base Year | 2024 |
| Forecast Period | 2025-2032 |
| Rifamycin Derivatives Market Size 2024 | USD 1478.5 Million |
| Rifamycin Derivatives Market, CAGR | 4.8% |
| Rifamycin Derivatives Market Size 2032 | USD 2151.35 Million |
The Rifamycin Derivatives Market is shaped by key players such as Lupin Ltd, Sandoz, Olon S.p.A, Labcorp Drug Development, AdvaCare Pharma, EUROAPI, CKD Bio Corporation, Merck, Sanofi Pharmaceuticals, and Mylan. These companies strengthen their positions through robust API production, strong distribution networks, and consistent supply of rifampicin, rifabutin, rifapentine, and rifaximin. Product quality, regulatory compliance, and expansion in high-burden regions remain central to their strategies. Asia-Pacific leads the global market with about 41% share in 2024, supported by large patient populations, strong national TB programs, and growing adoption of rifamycin-based therapies.
Market Insights
- The Rifamycin Derivatives Market was valued at USD 1478.5 million in 2024 and is projected to reach USD 2151.35 million by 2032, growing at a CAGR of 4.8%.
- Rising global TB incidence and strong dependence on rifampicin-based multidrug therapy drive steady demand across high-burden countries.
- Shorter-course regimens, expanding rifaximin use in gastrointestinal disorders, and broader adoption of rifapentine for latent TB shape key market trends.
- Leading companies such as Lupin Ltd, Sandoz, Olon S.p.A, Merck, and Mylan compete through strong API capacity, quality compliance, and low-cost manufacturing, while supply chain gaps remain a key restraint.
- Asia-Pacific leads the market with about 41% share, followed by North America at 34%; tuberculosis treatment dominates the application segment with nearly 55% share.
 Market Segmentation Analysis:
By Type
Rifampicin held the dominant share in 2024 with about 46% of the Rifamycin Derivatives Market. Strong use in first-line tuberculosis regimens supported this lead, as global TB programs rely on rifampicin-based combinations for high cure rates. Wider availability through national health schemes and inclusion in WHO-recommended protocols strengthened demand. Rifabutin and rifapentine grew at a steady pace due to rising adoption in HIV-associated TB and latent TB infection management, while rifaximin expanded in gastrointestinal care but remained smaller in overall volume.
- For instance, rifampicin remains the most commonly used rifamycin in the treatment of DS‑TB (drug‑susceptible TB), even in WHO-recommended fixed‑dose combination (FDC) regimens.
By Application
Tuberculosis treatment accounted for the largest share in 2024 with nearly 55% of the Rifamycin Derivatives Market. The segment stayed dominant due to high global TB incidence and continued dependence on rifamycin-based multidrug therapy. Public health funding, DOTS program expansion, and treatment guidelines reinforced strong demand. Travelers’ diarrhea management showed rising use of rifaximin, while antimicrobial therapy and hepatic encephalopathy treatment gained traction as prescribers preferred non-systemic formulations with low resistance risk.
- For instance, rifampicin (or rifampin) is still the backbone of standard TB therapy, used in combination with drugs like isoniazid, pyrazinamide and ethambutol and remains the preferred rifamycin for drug‑susceptible TB.
By Dosage Form
Tablets led the Rifamycin Derivatives Market in 2024 with about 49% share, driven by widespread use in TB and latent infection treatment. High patient compliance, simple distribution, and large-scale public procurement supported this advantage. Capsules saw steady growth for rifaximin therapies, while injectables remained essential in specific hospital settings requiring rapid systemic action. Oral solutions served pediatric and elderly groups, offering dosing flexibility but representing a smaller share due to limited routine use.
Key Growth Drivers
Growing Tuberculosis Burden and High Reliance on Rifamycin-Based Regimens
Rising tuberculosis cases worldwide act as a major growth engine for the Rifamycin Derivatives Market. Many national programs continue to depend on rifampicin-based multidrug therapy due to strong clinical outcomes and long-term inclusion in global treatment standards. Public health agencies reinforce this reliance through large-volume procurement, stable supply chains, and adherence support initiatives. High-burden countries in Asia and Africa drive much of the demand as detection rates improve and treatment coverage expands. Continued investment in TB elimination programs, including latent TB management, further boosts the use of rifampicin, rifabutin, and rifapentine. The strong therapeutic profile and proven efficacy of these drugs position rifamycins as essential components of universal TB care strategies.
- For instance, in 2023 an estimated 10.8 million people fell ill with TB across the globe, underscoring high demand for first‑line anti‑TB regimens that generally include rifamycins.
Increasing Adoption of Rifaximin in Gastrointestinal Disorders
Rifaximin adoption is increasing across several gastrointestinal indications, providing a strong demand boost for the Rifamycin Derivatives Market. Clinicians prefer rifaximin due to its non-systemic action, minimal resistance risk, and favorable safety profile. Use has expanded in travelers’ diarrhea, irritable bowel syndrome with diarrhea, and hepatic encephalopathy. These conditions show rising global prevalence due to lifestyle changes, travel activity, and aging populations. Gastroenterology guidelines now recommend rifaximin as a reliable therapeutic option, strengthening prescriber confidence. Growing awareness among patients and broader insurance reimbursement support sustained market penetration. Pharmaceutical companies continue to explore extended indications and combination therapies, reinforcing rifaximin’s growth potential within the rifamycin class.
- For instance, rifaximin is poorly absorbed from the GI tract, the majority of the drug stays localized in the intestines this property underpins its use in conditions such as travelers’ diarrhea, irritable bowel syndrome with diarrhea, and hepatic encephalopathy, where systemic exposure is not desired.
Expanding Use of Rifamycins in HIV-Associated TB and Latent Infection Management
Rifamycin adoption is rising in HIV co-infected TB patients and latent TB infection programs, creating another strong driver. Rifabutin has gained wider usage due to its compatibility with antiretroviral therapy, offering safer outcomes in immunocompromised populations. Meanwhile, rifapentine is increasingly preferred in shorter-course latent TB regimens, improving patient adherence and reducing treatment dropouts. Global health authorities promote these improved regimens, leading to stronger market demand. Enhanced diagnostic coverage and targeted preventive therapy programs also contribute to higher consumption. As governments expand integrated HIV-TB management frameworks, demand for rifabutin and rifapentine continues to grow. These drugs support better treatment outcomes, reinforcing their importance within evolving TB control strategies.
Key Trends & Opportunities
Growth of Shorter-Course and Patient-Friendly Treatment Protocols
Shorter-course therapy is becoming a central trend in the Rifamycin Derivatives Market as healthcare providers seek better adherence and reduced toxicity. Rifapentine-based regimens, especially for latent TB, reflect this shift due to their simplified dosing schedules. Public health agencies increasingly endorse patient-friendly treatment models that reduce clinical visits and improve outcomes. Pharmaceutical developers also invest in fixed-dose combinations that integrate rifamycins for easier administration. These changes align with global health goals focused on faster disease control and resistance prevention. The trend supports long-term market expansion as shorter regimens gain approval across more regions.
- For instance, one preferred regimen is once‑weekly Rifapentine plus Isoniazid for 12 weeks (12 total doses) known as the “3HP” regimen which is strongly recommended over 6‑ or 9‑month isoniazid monotherapy by Centers for Disease Control and Prevention (CDC) and its peer‑guideline bodies.
Rising Opportunities in Non-TB Applications and Novel Formulations
New opportunities are emerging as rifamycins gain broader use beyond traditional TB care. Rifaximin is fueling growth through expanding use in gastrointestinal indications, reflecting strong performance in both hospital and outpatient settings. Innovation in formulation technology is also accelerating, with extended-release, targeted-delivery, and improved pediatric options gaining attention. These developments help address unmet needs in chronic liver disease, complex infections, and travel-related conditions. Market expansion is supported by rising healthcare spending and greater awareness of rifamycin benefits. Companies exploring next-generation therapies and novel uses stand to capture significant value from these evolving opportunities.
- For instance, a delayed‑release rifamycin formulation Aemcolo received approval from U.S. Food and Drug Administration (FDA) in 2018 for treatment of traveler’s diarrhea caused by non‑invasive strains of Escherichia coli.
Key Challenges
Antibiotic Resistance Concerns and Regulatory Barriers
Increasing concern about antimicrobial resistance poses a serious challenge for the Rifamycin Derivatives Market. Long-term use of rifamycins in TB and other infections raises the risk of resistance, prompting regulators to enforce strict stewardship practices. These measures can slow adoption in certain regions and lead to tighter prescribing protocols. Regulatory bodies also require extensive evidence for new indications or formulations, creating long approval timelines. Manufacturers face added pressure to conduct robust clinical studies and post-market surveillance. This environment increases development costs and complicates market entry for newer rifamycin-based therapies. The challenge remains significant as global agencies balance access with safety.
Supply Chain Constraints and Dependence on Limited Manufacturers
The market faces supply-related challenges due to heavy dependence on a limited number of API and formulation producers. Production disruptions, quality issues, or geopolitical factors can lead to shortages that affect national TB programs and hospital supply chains. Rifamycin manufacturing is complex and requires strict compliance with global standards, making capacity expansion difficult. Smaller suppliers struggle with regulatory upgrades, increasing the risk of bottlenecks. Public tenders often favor low-cost suppliers, further narrowing the pool of reliable manufacturers. These constraints affect treatment continuity and create vulnerability in high-burden regions. Strengthening supply diversification remains essential for stable market growth.
Regional Analysis
North America
North America held about 34% share of the Rifamycin Derivatives Market in 2024, driven by strong treatment programs for tuberculosis, latent TB, and hepatic encephalopathy. The region benefits from advanced diagnostic coverage, widespread use of rifaximin in gastrointestinal care, and steady adoption of rifabutin for HIV-associated TB cases. High healthcare spending and broad insurance reimbursement support consistent demand across hospitals and outpatient settings. Ongoing research activity and new formulation development further strengthen market growth. The United States remains the key revenue contributor due to large patient pools and established therapeutic guidelines.
Europe
Europe accounted for nearly 29% share of the Rifamycin Derivatives Market in 2024, supported by structured TB control frameworks and strong use of rifampicin in standardized treatment regimens. Increased adoption of rifapentine-based preventive therapy and rising preference for rifaximin in liver disease management contribute to regional growth. Western Europe leads market use due to advanced healthcare infrastructure and higher diagnostic rates. Eastern Europe shows steady demand driven by persistent TB incidence and public health investments. Regulatory emphasis on evidence-based prescribing and quality manufacturing ensures stable therapy uptake across major countries.
Asia-Pacific
Asia-Pacific dominated the Rifamycin Derivatives Market in 2024 with about 41% share, reflecting the region’s high tuberculosis burden and large-scale dependence on rifampicin-based therapy. Expanding national TB programs, improved detection rates, and broader use of rifapentine for latent TB management strengthen market momentum. Growing application of rifaximin in gastrointestinal disorders also boosts adoption. China and India remain the largest contributors due to large patient populations and government-funded treatment initiatives. Rising healthcare spending, local manufacturing expansion, and updated clinical guidelines support sustained growth across the region.
Latin America
Latin America held around 8% share of the Rifamycin Derivatives Market in 2024, influenced by moderate TB incidence and growing use of rifaximin in gastrointestinal care. Countries like Brazil and Mexico show steady adoption due to expanded public health coverage and established treatment programs. Increasing awareness of latent TB therapy and improved diagnostic access enhance market penetration. Rising investment in hospital infrastructure and broader availability of affordable rifamycin generics support further growth. However, regional disparities in healthcare capacity create varied uptake across urban and rural areas.
Middle East & Africa
The Middle East & Africa region captured nearly 7% share of the Rifamycin Derivatives Market in 2024, with growth driven by persistent TB prevalence and rising demand for essential rifampicin-based therapies. Public health campaigns and international support programs help expand access across high-burden countries. Adoption of rifabutin for HIV-TB co-infection is increasing in select markets with improving clinical infrastructure. Limited diagnostic resources and uneven drug availability remain challenges, but gradual expansion of procurement networks and donor-funded initiatives support steady market progress across the region.
Market Segmentations:
By Type
- Rifampicin
- Rifabutin
- Rifapentine
- Rifaximin
By Application
- Tuberculosis Treatment
- Travelers' Diarrhea Management
- Antimicrobial Therapy
- Hepatic Encephalopathy Treatment
By Dosage Form
- Tablets
- Injectables
- Oral Solutions
- Capsules
By Geography
- North America
- U.S.
- Canada
- Mexico
- Europe
- Germany
- France
- U.K.
- Italy
- Spain
- Rest of Europe
- Asia Pacific
- China
- Japan
- India
- South Korea
- South-east Asia
- Rest of Asia Pacific
- Latin America
- Brazil
- Argentina
- Rest of Latin America
- Middle East & Africa
- GCC Countries
- South Africa
- Rest of the Middle East and Africa
Competitive Landscape
The Competitive Landscape of the Rifamycin Derivatives Market features leading participants such as Lupin Ltd, Sandoz, Olon S.p.A, Labcorp Drug Development, AdvaCare Pharma, EUROAPI, CKD Bio Corporation, Merck, Sanofi Pharmaceuticals, and Mylan. These companies compete through strong formulation capabilities, robust active pharmaceutical ingredient production, and broad global supply networks. Many players focus on expanding rifampicin, rifabutin, rifapentine, and rifaximin portfolios to meet rising demand across tuberculosis, gastrointestinal disorders, and preventive therapy programs. Strategic collaborations with public health agencies, capacity expansion in emerging markets, and compliance with global regulatory standards remain central to maintaining competitive strength. Continuous investment in quality manufacturing, affordable generics, and improved treatment formulations helps companies secure market share across high-burden regions.
Key Player Analysis
- Lupin Ltd
- Sandoz
- Olon S.p.A
- Labcorp Drug Development
- AdvaCare Pharma
- EUROAPI
- CKD Bio Corporation
- Merck
- Sanofi Pharmaceuticals
- Mylan
Recent Developments
- In December 2025, CKD Bio Corporation (CKD BiO) advertises credentials and regulatory approvals for rifamycin APIs the company’s corporate materials note that a CEP (Certificate of Suitability) for Rifamycin Sodium has been granted (EDQM reference in their history / product listings), showing CKD’s regulatory alignment for supplying rifamycin-class APIs.
- In November 2024, Lupin’s rifapentine 150 mg dispersible tablet (TB402) was added to the WHO Prequalified list (first dispersible rifapentine prequalified), supporting wider global supply for TB prevention/treatment.
- In October 2023, EUROAPI has actively worked on rifampicin API quality/impurity standards: in 2023 EUROAPI reported its rifampicin API meets evolving nitrosamine impurity requirements and has repeatedly highlighted rifampicin among APIs in its news/press materials reflecting API-level compliance and supply-chain positioning for rifamycin APIs.
Report Coverage
The research report offers an in-depth analysis based on Type, Application, Dosage Form and Geography. It details leading market players, providing an overview of their business, product offerings, investments, revenue streams, and key applications. Additionally, the report includes insights into the competitive environment, SWOT analysis, current market trends, as well as the primary drivers and constraints. Furthermore, it discusses various factors that have driven market expansion in recent years. The report also explores market dynamics, regulatory scenarios, and technological advancements that are shaping the industry. It assesses the impact of external factors and global economic changes on market growth. Lastly, it provides strategic recommendations for new entrants and established companies to navigate the complexities of the market.
Future Outlook
- Global TB control programs will continue to sustain strong demand for rifampicin-based therapies.
- Rifaximin use will expand across gastrointestinal disorders due to its safety and non-systemic profile.
- Rifapentine adoption will rise as shorter-course latent TB regimens gain wider approval.
- Growth in HIV-TB co-management will increase reliance on rifabutin-based treatments.
- Fixed-dose combinations will gain traction to improve patient adherence and simplify therapy.
- Manufacturing capacity will expand in Asia to support rising regional demand.
- Regulatory focus on antimicrobial stewardship will push companies toward improved formulations.
- New clinical studies may broaden therapeutic applications beyond TB and gastrointestinal care.
- Competitive intensity will increase as more generic rifamycin products enter the market.
- Public health investments in diagnostics and preventive therapy will strengthen long-term market stability.
Request a Free Sample
Fill in your details and we'll send you a free sample report.
- Sample data tables & charts
- Research methodology
Need a Custom Version of This Report?
Tailor the scope, geography, or segments to your exact requirements.
- Custom geography or segment scope
- Direct access to our analyst team
Frequently Asked Questions
What is the current market size for Rifamycin Derivatives Market, and what is its projected size in 2032?
At what Compound Annual Growth Rate is Rifamycin Derivatives Market projected to grow between 2024 and 2032?
Which Rifamycin Derivatives Market segment held the largest share in 2024?
What are the primary factors fueling the growth of Rifamycin Derivatives Market?
Who are the leading companies in Rifamycin Derivatives Market?
Which region commanded the largest share of Rifamycin Derivatives Market?
Table of Content
Chapter 1. Report Introduction
- 1.1 Report Description & Purpose
- 1.1.1 Report Title & Market Definition
- 1.1.2 Unique Selling Propositions (USP) & Key Differentiators
- 1.1.3 Value Proposition for Stakeholders
- 1.2 Research Objectives
- 1.2.1 Market Sizing Objectives (Volume & Revenue)
- 1.2.2 Segmentation Objectives
- 1.2.3 Competitive Intelligence Objectives
- 1.2.4 Forecast & Scenario Objectives
- 1.3 Report Scope
- 1.3.1 Rifamycin Derivatives Scope – Types & Subtypes Covered
- 1.3.2 Geographic Scope – Regions & Countries Covered
- 1.3.3 Historical Period, Base Year & Forecast Period (2024; forecast to 2032)
- 1.3.4 Inclusions & Exclusions
- 1.4 HS Code & Classification Framework
- 1.5 Currency, Units & Pricing Basis
- 1.6 Target Stakeholders
- 1.7 Limitations & Assumptions
Chapter 2. Executive Summary
- 2.1 Global Rifamycin Derivatives Market Snapshot
- 2.1.1 Market Size – Historical (2024) & Forecast (2024-2032) (2024: USD 1478.5 million → 2032: USD 2151.35 million)
- 2.1.2 Volume & Revenue – Global Totals
- 2.1.3 Key Market Highlights – Top Five Facts
- 2.2 Rifamycin Derivatives Market Segmentation Snapshot
- 2.2.1 Market Split by Region – 2024 vs. 2032
- 2.3 Competitive Snapshot
- 2.3.1 Top 10 Players by Revenue Share – 2024
- 2.3.2 Top 10 Players by Volume Share – 2024
- 2.3.3 Recent Strategic Developments (18-Month Summary)
- 2.4 Key Investment Highlights & Strategic Conclusions
Chapter 3. Rifamycin Derivatives Market Dynamics & Industry Analysis
- 3.1 Market Overview & Context
- 3.1.1 Rifamycin Derivatives Market Position in the Broader Automotive Value Chain
- 3.1.2 OEM vs. Replacement Market Dynamics
- 3.1.3 Market Maturity & Development Stage by Region
- 3.2 Rifamycin Derivatives Market Drivers
- 3.3 Rifamycin Derivatives Market Restraints & Challenges
- 3.4 Rifamycin Derivatives Market Opportunities
- 3.5 Porter's Five Forces Analysis
- 3.5.1 Threat of New Entrants
- 3.5.2 Bargaining Power of Suppliers
- 3.5.3 Bargaining Power of Buyers
- 3.5.4 Threat of Substitutes
- 3.5.5 Competitive Rivalry – Intensity Assessment
- 3.6 Rifamycin Derivatives Value Chain Analysis
- 3.6.1 Upstream – Raw Material/Input Suppliers
- 3.6.1.1 Raw Material/Input 1
- 3.6.1.2 Raw Material/Input 2
- 3.6.1.3 Raw Material/Input 3
- 3.6.2 Midstream – Production/Manufacturing/Service Delivery
- 3.6.2.1 Production/Process Overview
- 3.6.2.2 Key Facility Locations & Capacity by Manufacturer
- 3.6.3 Downstream – Distribution & End Consumer
- 3.6.3.1 Primary Channel – B2B/OEM
- 3.6.3.2 Secondary Channels – Dealer, Retail, Online, Direct
- 3.6.4 Value Chain Profitability Analysis
- 3.6.1 Upstream – Raw Material/Input Suppliers
- 3.7 PESTEL Analysis
- 3.7.1 Political Factors
- 3.7.2 Economic Factors
- 3.7.3 Social Factors
- 3.7.4 Technological Factors
- 3.7.5 Environmental Factors
- 3.7.6 Legal Factors
- 3.8 Rifamycin Derivatives Supply Chain Analysis
- 3.8.1 Raw Material/Input Supply Risk Assessment
- 3.8.2 Manufacturing Concentration Risk (Geographic Exposure)
- 3.8.3 Trade Disruption Impact Analysis
- 3.9 Regulatory & Policy Landscape
Note: The regulatory and policy landscape section covers regulations based on their applicability to the market, Rifamycin Derivatives category, geography, and scope of the study. Only regulatory frameworks with a material impact on operations, compliance, trade, sustainability, or market access are analyzed in detail.
Chapter 4. Key Investment Pockets & Opportunity Analysis
- 4.1 Rifamycin Derivatives Market Attractiveness Analysis
- 4.1.1 By Region – Investment Attractiveness Matrix (Volume × CAGR)
- 4.2 Absolute Revenue Growth Opportunity
- 4.2.1 By Region – Absolute USD Growth Through 2032
- 4.3 Incremental Volume Opportunity
- 4.3.1 By Region – Incremental Volume Through 2032
- 4.3.2 Segment – Incremental Volume
- 4.4 Emerging Submarket Opportunity Deep Dive (Subject to Applicability)
- 4.5 Emerging Market Opportunity Scorecards
- 4.5.1 United States
- 4.5.2 Europe
- 4.5.3 Asia
- 4.5.4 Middle East & Africa
Note: Emerging Market Opportunity Scorecards will be included based on relevance and strategic importance. Regions listed are indicative and may vary depending on data availability and market dynamics.
Chapter 5. Rifamycin Derivatives Import-Export Analysis & Trade Flows
- 5.1 Global Trade Overview
- 5.1.1 Global Export Value by Country (2024)
- 5.1.2 Global Export Volume by Country (2024)
- 5.1.3 Global Import Value by Country (2024)
- 5.1.4 Global Import Volume by Country (2024)
- 5.1.5 Net Trade Balance by Country (2024)
- 5.2 Export Analysis – Segment
- 5.2.1 Type 1 (HS Code)
- 5.2.2 Type 2 (HS Code)
- 5.2.3 Type 3 (HS Code)
- 5.2.4 Type 4 (HS Code)
- 5.2.5 Type 5 (HS Code)
- 5.3 Import Analysis – Segment
- 5.3.1 Type 1 (HS Code)
- 5.3.2 Type 2 (HS Code)
- 5.3.3 Type 3 (HS Code)
- 5.3.4 Type 4 (HS Code)
- 5.3.5 Type 5 (HS Code)
- 5.4 Average Unit Trade Prices
- 5.4.1 Average Export Price – Segment & Country
- 5.4.2 Average Import Price – Segment & Source Country
- 5.4.3 Price Trends (2024)
- 5.5 Key Trade Route Analysis
- 5.5.1 Trade Route 1
- 5.5.2 Trade Route 2
- 5.5.3 Trade Route 3
- 5.5.4 Trade Route 4
- 5.5.5 Trade Route 5
- 5.6 Trade Policy Impact Assessment
- 5.6.1 US Anti-Dumping & Section 301 Tariffs
- 5.6.2 EU Customs Union Impact
- 5.6.3 Major Free Trade Agreements
- 5.6.4 USMCA Rules of Origin
Note: Trade policy analysis will be included only where relevant to the Rifamycin Derivatives market.
Chapter 6. Competitive Landscape & Company Benchmarking
- 6.1 Rifamycin Derivatives Market Concentration & Structure
- 6.1.1 Herfindahl-Hirschman Index (HHI) – vs. 2024
- 6.1.2 Tier 1, Tier 2 & Tier 3 Market Structure
- 6.1.3 Global, Regional & Local Player Dynamics
- 6.2 Rifamycin Derivatives Market Share Analysis – 2024
- 6.2.1 Global Revenue Share by Company
- 6.2.2 Global Volume Share by Company
- 6.2.3 Regional Revenue Share
- 6.2.4 Market Share Evolution ( vs. 2024)
- 6.2.5 OEM Segment Share by Company
- 6.2.6 Replacement Segment Share by Company
- 6.3 Production/Delivery Capacity & Facility Analysis
- 6.3.1 Global Installed Capacity
- 6.3.2 Capacity Utilization Rates
- 6.3.3 Production/Output Volume
- 6.3.4 Facility Locations & Capacity Map
- 6.3.5 Planned Capacity Additions
- 6.4 Rifamycin Derivatives Competitive Benchmarking Matrix
- 6.4.1 Revenue, Volume, CAGR & Profitability Comparison
- 6.4.2 Channel Revenue Mix
- 6.4.3 Geographic Revenue Exposure
- 6.4.4 R&D Intensity
- 6.4.5 Sustainability Maturity
- 6.5 Strategic Developments in Rifamycin Derivatives (Last 24 Months)
- 6.5.1 Mergers, Acquisitions & Divestments
- 6.5.2 New Rifamycin Derivatives Launches
- 6.5.3 Facility Expansions
- 6.5.4 Strategic Alliances, Joint Ventures & Partnerships
- 6.5.5 Distribution Expansion & Market Entry
- 6.5.6 Sustainability & ESG Initiatives
- 6.6 Competitive Strategy Mapping
- 6.6.1 Leader, Challenger, Follower & Niche Classification
- 6.6.2 Pricing Strategy Comparison
- 6.6.3 Channel Strategy Matrix
Note: Strategic developments are included based on their materiality and the availability of reliable information.
Chapter 7. Global Rifamycin Derivatives Market – By Distribution Channel
- 7.1 Segment Overview
- 7.1.1 Volume & Revenue Split by Channel (2024 & 2032)
- 7.1.2 Channel Mix Evolution (2024-2032)
Chapter 8. Regional Market Analysis – Global Overview
- 8.1 Global Regional Overview
- 8.1.1 Regional Volume Share
- 8.1.2 Regional Revenue Share
- 8.1.3 Regional Volume by Region
- 8.1.4 Regional Revenue by Region
- 8.1.5 Regional Forecast Through 2032
- 8.2 Cross-Regional Segment Analysis
- 8.2.1 By Distribution Channel
- 8.2.2 By Brand/Price Tier
Chapter 9. North America Rifamycin Derivatives Market
- 9.1 United States
- 9.2 Canada
- 9.3 Mexico
Chapter 10. Europe Rifamycin Derivatives Market
- 10.1 Germany
- 10.2 France
- 10.3 Italy
- 10.4 United Kingdom
- 10.5 Spain
- 10.6 Poland
- 10.7 Russia
- 10.8 Netherlands
- 10.9 Belgium
- 10.10 Sweden
- 10.11 Denmark
- 10.12 Norway
- 10.13 Rest of Europe
Chapter 11. Asia Pacific Rifamycin Derivatives Market
- 11.1 China
- 11.2 India
- 11.3 Japan
- 11.4 South Korea
- 11.5 Thailand
- 11.6 Indonesia
- 11.7 Vietnam
- 11.8 Malaysia
- 11.9 Australia
- 11.10 Rest of Asia Pacific
Chapter 12. Latin America Rifamycin Derivatives Market
- 12.1 Brazil
- 12.2 Argentina
- 12.3 Colombia
- 12.4 Chile
- 12.5 Rest of Latin America
Chapter 13. Middle East Rifamycin Derivatives Market
- 13.1 Saudi Arabia
- 13.2 United Arab Emirates
- 13.3 Turkey
- 13.4 Israel
- 13.5 Iran
- 13.6 Rest of the Middle East
Chapter 14. Africa Rifamycin Derivatives Market
- 14.1 South Africa
- 14.2 Egypt
- 14.3 Nigeria
- 14.4 Morocco
- 14.5 Rest of Africa
Chapter 15. Rifamycin Derivatives Company Profiles
- 15.1 [Company 01]
- 15.1.1 Company Overview
- 15.1.2 Key Management Personnel
- 15.1.3 Products & Services Portfolio
- 15.1.4 Financial Performance
- 15.1.5 Key Market Focus & Geographic Presence
- 15.1.6 Recent Developments & Strategic Initiatives
Note: The company profile list is preliminary and may change based on research findings, market developments, data availability, and client requirements.
Chapter 16. Appendices
- Appendix A – List of Abbreviations & Acronyms
- Appendix B – Industry Classification Code Reference – Full Series
- Appendix C – Production & Capacity Data Tables
- Appendix D – End-Use & Demand Base Tables
- Appendix E – Consumption & Replacement Rate Assumptions
- Appendix F – ASP Reference Tables
- Appendix G – Manufacturing & Facility Database
- Appendix H – Import-Export Data Tables
- Appendix I – Regulatory Summary Tables
- Appendix J – Primary Research Participant List (Anonymized)
- Appendix K – Primary Research Questionnaire Framework
- Appendix L – Data Sources & Bibliography
- Appendix M – Market Size Divergence & Source Comparison
Chapter 17. Research Methodology
- 17.1 Research Framework & Philosophy
- 17.2 Secondary Research – Sources, Hierarchy & Data Extraction
- 17.3 Data Modeling – Bottom-Up & Top-Down Market Sizing
- 17.4 Primary Research – Stakeholder Framework, LOI & Sample Sizes
- 17.5 Forecast Methodology – Regression, Scenario & Sensitivity Analysis
- 17.6 Quality Control – Four-Layer Validation Framework
- 17.7 Limitations & Standard Assumptions
- 17.8 Disclaimer
