| REPORT ATTRIBUTE | DETAILS |
|---|---|
| Historical Period | 2020-2023 |
| Base Year | 2024 |
| Forecast Period | 2025-2032 |
| Sodium Metabisulfite Market Size 2024 | USD 677.9 Million |
| Sodium Metabisulfite Market, CAGR | 6.20% |
| Sodium Metabisulfite Market Size 2032 | USD 1,096.9 Million |
Market Overview
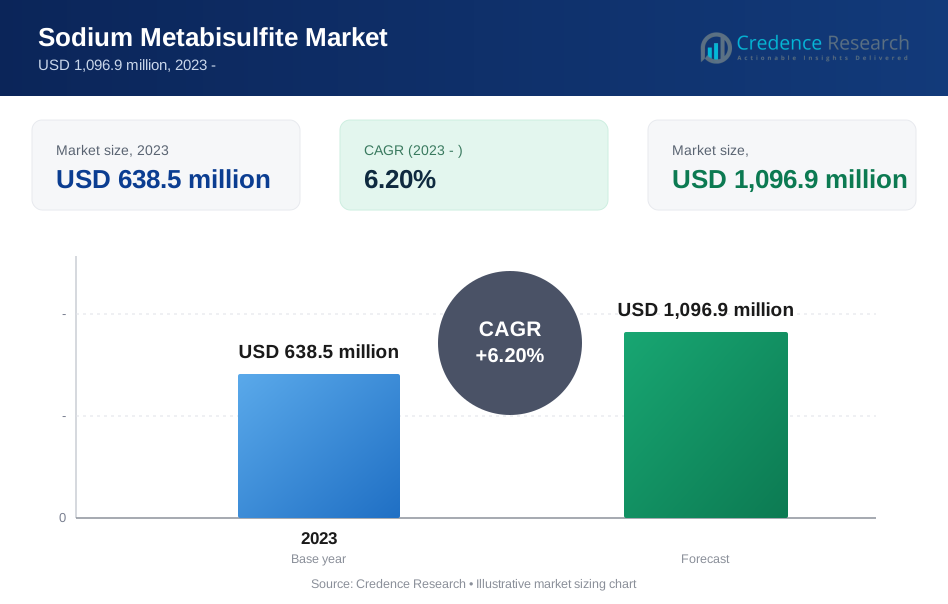
The Global Sodium Metabisulfite Market is projected to grow from USD 677.9 million in 2024 to an estimated USD 1,096.9 million by 2032, with a compound annual growth rate (CAGR) of 6.20% from 2025 to 2032.
Demand for eco-friendly preservation agents drives market growth. Food and beverage producers adopt sodium metabisulfite for antimicrobial and antioxidant properties. Water treatment applications gain traction due to stricter discharge regulations. Trend toward green chemistry prompts manufacturers to optimize production processes for lower emissions and waste. Digitalization in supply chains enhances traceability and quality control, supporting consistent product standards. Strategic approvals by regulatory bodies in emerging markets boost application scope, while shifts toward decentralized production models enable faster response to local demand.
Asia-Pacific leads the market, accounting for significant share due to expanding chemical and pulp and paper industries in China and India. North America holds stable growth on robust water treatment and food processing sectors. Europe exhibits moderate growth driven by regulatory focus on sustainable industrial chemicals. Latin America and Middle East & Africa present incremental opportunities as infrastructure and regulatory frameworks evolve. Key players include Akzo Nobel N.V., Chemtrade Logistics Inc., Penta Aqua Co., The Chemical Company, and Shanghai Eastchem Co.
Market Insights
- The Global Sodium Metabisulfite Market will reach USD 1,096.9 million by 2032 at a 6.20% CAGR.
- Upgrading municipal and industrial water treatment plants boosts dechlorination demand.
- Heightened food preservation standards increase use of antimicrobial and antioxidant agents.
- Fluctuating sulfur dioxide feedstock costs compress producer margins.
- Tight sulfite residue limits in foods force compliance investments.
- Asia Pacific leads with \~40.5% share, driven by China and India’s chemical and pulp sectors.
- North America and Europe sustain growth through robust water treatment and regulatory frameworks.
Market Drivers
Expansion of Municipal and Industrial Water Treatment Applications Bolsters Market Demand
Rapid urbanization intensifies demand for clean water. Municipal authorities expand treatment capacity to meet rising consumption. Industrial facilities rely on effective dechlorination agents to protect equipment. The Global Sodium Metabisulfite Market benefits from these requirements. It delivers consistent reduction of residual chlorine in effluents. Producers secure supply contracts with water utilities to ensure uninterrupted availability. It underpins stable volume growth in key regions.
- For instance, in 2024, the U.S. Environmental Protection Agency (EPA) reported that over 2,300 municipal water treatment plants nationwide used sodium metabisulfite for dechlorination in their daily operations.
Increasing Adoption in Food and Beverage Preservation Enhances Market Growth
Food and beverage manufacturers prioritize shelf-life extension to reduce waste. Sodium metabisulfite serves as an effective antimicrobial and antioxidant agent. The Global Sodium Metabisulfite Market derives value from strict quality standards in packaged goods. It maintains product freshness and color stability in wines, juices, and dried fruits. Cost advantages over alternative preservatives support its selection. It aligns with food safety regulations that govern sulfite levels. Manufacturers leverage it to optimize production efficiency and consumer confidence.
- For instance, according to a 2024 report by the Food and Agriculture Organization (FAO), more than 7,500 food and beverage processing facilities in Europe and Asia used sodium metabisulfite as a preservative in products such as dried fruits and juices.
Rising Pulp and Paper Production Reinforces Chemical Demand
Paper mills require reducing agents for bleaching and pulping processes. Sodium metabisulfite accelerates lignin removal while preserving fiber strength. The Global Sodium Metabisulfite Market expands in regions with growing paper output. It streamlines chemical dosing protocols and reduces operational costs. Collaboration between chemical suppliers and pulp producers ensures tailored formulations. It supports high-volume applications in specialty and packaging grades. Market participants invest in capacity expansions to meet new mill projects.
Stringent Environmental Regulations and Emphasis on Sustainable Production Guide Market Direction
Regulatory bodies enforce limits on effluent quality and chemical emissions. Sodium metabisulfite offers a low-toxicity alternative to harsher reducing agents. The Global Sodium Metabisulfite Market adapts through greener manufacturing routes. It incorporates process optimizations to minimize waste generation. Industry standards encourage closed-loop systems that recover and recycle by-products. It drives partnerships focused on lifecycle assessments and compliance. Market leaders innovate to reduce carbon footprint and enhance resource efficiency.
Market Trends
Integration of Digital Tools for Enhanced Supply Chain Transparency
Companies adopt advanced tracking systems to monitor quality. It uses IoT sensors to record batch parameters and trace shipments. Stakeholders demand visibility from production to end use. The Global Sodium Metabisulfite Market benefits from streamlined logistics. Manufacturers deploy cloud platforms to manage inventory and forecasts. They adjust output based on real-time data. It ensures compliance with regulatory audits.
- For instance, in a 2023 pilot program by a leading sodium metabisulfite producer, the company installed 1,200 IoT sensors across its supply chain, enabling real-time tracking of 500 batches per month and reducing shipment delays by 30 days annually compared to previous manual tracking.
Growing Demand for Eco-Friendly Production and Sustainable Chemicals
Regulatory bodies enforce stricter waste and emission standards. It drives adoption of cleaner synthesis technologies. Companies replace outdated reactors with energy-efficient equipment. The Global Sodium Metabisulfite Market reports trials of bio-based precursors. Firms install water-recycling systems in manufacturing units. They lower costs while meeting environmental targets. It boosts stakeholder trust and brand image.
- For instance, according to a 2022 U.S. Environmental Protection Agency (EPA) survey, 8 sodium metabisulfite manufacturers invested in new water-recycling systems that collectively processed over 5 million gallons of wastewater per year, reducing freshwater consumption by 60% and meeting updated effluent standards.
Customization of Formulations to Meet Specialized Industry Requirements
End users in water treatment and food processing request tailored grades. It allows adjustments in purity levels and particle size. Suppliers work with clients to develop specific blends. The Global Sodium Metabisulfite Market showcases modular production for flexibility. Developers test small batches to speed validation cycles. They offer technical support to optimize dosages. It increases adoption across diverse sectors.
Strategic Alliances and Consolidations Strengthen Competitive Landscapes
Leading firms pursue joint ventures to expand geographic reach. It opens access to new customer networks and distribution channels. Consolidations bring capacity growth and cost synergies. The Global Sodium Metabisulfite Market attracts private equity investment. Market players integrate R\&D to innovate novel applications. They leverage partnerships to enter emerging segments. It fortifies value chains against supply disruptions.
Market Challenges
Volatile Raw Material Prices Pose Supply Chain Vulnerabilities
Price fluctuations in sulfur dioxide feedstock increase production costs. The Global Sodium Metabisulfite Market faces margin pressure when suppliers adjust rates. It forces producers to negotiate fixed-rate contracts or absorb higher expenses. It reduces planning accuracy and inventory stability. Manufacturers struggle to secure stable supply amid global competition. It raises the risk of sudden output cuts and delivery delays. Buyers may switch to alternative preservatives when prices spike.
- For instance, in December 2023, sodium metabisulfite prices reached 808 USD per metric ton in the USA and 818 USD per metric ton in Germany, with manufacturers facing ongoing volatility driven by raw material cost swings and supply-demand imbalances
Stringent Regulatory Frameworks Restrict Market Entry and Growth
Strict limits on sulfite residues in food and beverage trigger compliance costs. The Global Sodium Metabisulfite Market requires extensive safety testing and documentation before approval. It compels firms to invest in quality control labs and certification processes. It extends time to market for new formulations. Smaller producers may lack resources to meet evolving standards. It leads to market consolidation under established players. Regulators impose periodic audits that increase operational burden.
Market Opportunities
Expansion of Healthcare and Pharmaceutical Applications Presents New Growth Avenues
Rising incidence of chronic diseases increases demand for antioxidant preservatives. Sodium metabisulfite serves critical role in pharmaceutical formulations to prevent oxidation. The Global Sodium Metabisulfite Market can capture value through specialized medical-grade products. It partners with drug manufacturers to supply consistent, high-purity batches. It can develop collaborations to co-create tailored solutions for sterile applications. Improved scalability of production lines supports entry into high-value segments.
Emerging Water Treatment Projects in Developing Economies Offer Significant Potential
Rapid urban development in Southeast Asia and Africa drives water infrastructure investments. Municipalities adopt dechlorination agents to meet stricter effluent standards. The Global Sodium Metabisulfite Market stands to gain from project-based supply contracts. It expands distribution networks to underserved regions. It leverages modular dosing systems to reduce onsite installation time. Partnerships with engineering firms ensure integration into turnkey treatment plants.
Market Segmentation Analysis
By Grade
The Global Sodium Metabisulfite Market splits into food grade, industrial/technical grade, and photo grade. Food grade commands the largest volume share, driven by demand in food preservation and beverage stabilization. Industrial/technical grade holds significant revenue share, supported by applications in pulp bleaching and chemical synthesis. Photo grade occupies a smaller niche yet maintains stable demand in photography and film processing. It balances purity requirements with cost efficiency.
- For instance, according to the U.S. Food and Drug Administration (FDA), more than 2,300 food manufacturing facilities in the United States reported using food grade sodium metabisulfite as a preservative in 2024.
By Application
The market divides into preservative, bleaching agent, dechlorination agent, chemical synthesis/intermediates, floating agent, and sealants & others. Preservative use leads in volume share, fueled by stringent food safety standards. Bleaching agent follows, with mills prioritizing efficient lignin removal. Dechlorination agent captures robust revenue share, owing to growth in water treatment projects. Chemical synthesis applications support specialty chemicals production. It adapts to emerging needs in flotation and sealant formulations.
- For instance, a 2023 report from the European Chemical Industry Council (Cefic) noted that over 800,000 metric tons of sodium metabisulfite were consumed annually in Europe for use as preservatives and bleaching agents across food, beverage, and pulp industries.
By End-Use Industry
Key end-use sectors include food & beverage, water treatment, pulp & paper, textile, mining, chemical & pharmaceutical, photography & film, and others. Food & beverage retains the highest revenue share, reflecting reliance on antimicrobial properties. Water treatment projects drive volume uptake in municipal and industrial plants. Pulp & paper mills sustain steady demand for bleaching chemistry. Textile processors adopt it for dye reduction and fiber protection. It extends into mining flotation and pharmaceutical intermediates, while photography & film niche uses ensure diverse market coverage.
Segments
Based on Grade
- Food Grade
- Industrial/Technical Grade
- Photo Grade
Based on Application
- Preservative
- Bleaching Agent
- Dechlorination Agent
- Chemical Synthesis / Intermediates
- Floating Agent
- Sealants & Others
Based on End use
- Food & Beverage
- Water Treatment
- Pulp & Paper
- Textile
- Mining
- Chemical & Pharmaceutical
- Photography & Film
- Others
Based on Region
- North America
- U.S.
- Canada
- Mexico
- Europe
- UK
- France
- Germany
- Italy
- Spain
- Russia
- Belgium
- Netherlands
- Austria
- Sweden
- Poland
- Denmark
- Switzerland
- Rest of Europe
- Asia Pacific
- China
- Japan
- South Korea
- India
- Australia
- Thailand
- Indonesia
- Vietnam
- Malaysia
- Philippines
- Taiwan
- Rest of Asia Pacific
- Latin America
- Brazil
- Argentina
- Peru
- Chile
- Colombia
- Rest of Latin America
- Middle East
- UAE
- KSA
- Israel
- Turkey
- Iran
- Rest of Middle East
- Africa
- Egypt
- Nigeria
- Algeria
- Morocco
- Rest of Africa
Regional Analysis
North America Sodium Metabisulfite Market
North America holds a 24.8% share of the Global Sodium Metabisulfite Market, with a market size of USD 168.1 million in 2024. It projects growth to USD 246.8 million by 2032 at a 6.5% CAGR. Strong water treatment and food processing sectors fuel demand. Regional producers form partnerships with utilities to secure long-term contracts. Manufacturers expand capacity in response to regulatory upgrades. It leverages advanced logistics to maintain supply resilience.
Europe Sodium Metabisulfite Market
Europe accounts for an 18.2% market share with USD 123.4 million in 2024. It forecasts USD 185.4 million by 2032 at a 4.0% CAGR. Stringent environmental and food safety standards drive consumption. It emphasizes low-emission production methods and waste recovery. Suppliers invest in R\&D to refine purity and reduce costs. It collaborates with chemical associations to influence policy.
Asia Pacific Sodium Metabisulfite Market
Asia Pacific commands a 40.5% share, valued at USD 274.5 million in 2024. It expects USD 461.8 million by 2032 at a 7.4% CAGR. Rapid urbanization and infrastructure projects boost water treatment needs. It secures large-scale supply agreements with municipal bodies. Food and beverage producers tap into preservation applications. It aligns production with local content requirements to optimize costs.
Latin America Sodium Metabisulfite Market
Latin America represents a 5.4% share, with USD 36.6 million in 2024. It projects USD 69.1 million by 2032 at a 4.6% CAGR. Infrastructure investments in Brazil and Mexico underpin water and pulp applications. It establishes distribution hubs in strategic ports. Local mills adopt it for bleaching and dechlorination. It offers technical support to streamline dosing protocols.
Middle East Sodium Metabisulfite Market
Middle East holds a 6.8% share, valued at USD 46.1 million in 2024. It forecasts USD 79.0 million by 2032 at a 5.3% CAGR. Growing petrochemical and desalination sectors increase usage. It collaborates with EPC contractors on turnkey water treatment projects. Producers adapt formulations for high-salinity environments. It expands warehouses near key industrial zones.
Africa Sodium Metabisulfite Market
Africa captures a 4.3% share, with USD 29.1 million in 2024. It expects USD 54.8 million by 2032 at a 5.8% CAGR. Upgrading municipal treatment plants fuels dechlorination demand. It partners with NGOs on rural water initiatives. Manufacturers provide mobile dosing units for remote sites. It invests in training programs to enhance operator proficiency.
Key players
- BASF SE
- Aditya Birla Chemicals
- Ineos Calabrian Corporation
- Esseco Group S.r.l.
- Grillo-Werke Aktiengesellschaft
- Shandong Kailong Chemical Technology Development Co., Ltd.
- Qingdao Tianya Chemical Co., Ltd.
- Tian Chuang Chemical
- Jiading Malu Chemical
- Rongjin Chemical
- Huizhong Chemical Industry
- Anmol Chemicals
- Valaji PharmaChem
- Muby Chemicals
Competitive Analysis
The Global Sodium Metabisulfite Market shows strong competition among global producers and regional specialists. BASF SE and Ineos Calabrian secure top positions through integrated supply chains and large-scale facilities. Aditya Birla Chemicals and Grillo-Werke maintain presence in Asia and Europe by providing specialty grades and tailored solutions. Chinese firms such as Shandong Kailong and Qingdao Tianya compete on cost and proximity to feedstock. It faces pressure from niche players like Esseco Group and Anmol Chemicals focused on technical support. Strategic alliances between producers and end users improve service levels. Investment in process optimization cuts expenses and safeguards margins. It drives capacity expansions in high-growth regions. Mergers and acquisitions accelerate consolidation. Valaji PharmaChem and Muby Chemicals pursue market share gains through competitive pricing and localized distribution networks. It pushes established companies to expand geographic coverage and diversify end-use applications.
Recent Developments
- In June 2024, Aditya Birla Chemicals announced a USD 50 million investment to build a new R&D and manufacturing facility in Texas, aiming to develop high-purity grades and boost its presence in the North American market .
Market Concentration and Characteristics
The Global Sodium Metabisulfite Market exhibits moderate concentration, with leading producers such as BASF SE, Ineos Calabrian Corporation, Aditya Birla Chemicals, and Grillo-Werke Aktiengesellschaft commanding over 40% of global supply. It features a blend of large integrated players and regional specialists that compete on price, quality, and technical support. Scale advantages allow incumbents to optimize production costs and secure long-term feedstock contracts. Smaller firms differentiate through niche grades and localized service. It displays high entry barriers due to compliance requirements and capital-intensive manufacturing. Market dynamics favor strategic alliances, capacity expansions, and process innovations to maintain competitive positions.
Report Coverage
The research report offers an in-depth analysis based on Grade, Application, End Use and Region. It details leading market players, providing an overview of their business, product offerings, investments, revenue streams, and key applications. Additionally, the report includes insights into the competitive environment, SWOT analysis, current market trends, as well as the primary drivers and constraints. Furthermore, it discusses various factors that have driven market expansion in recent years. The report also explores market dynamics, regulatory scenarios, and technological advancements that are shaping the industry. It assesses the impact of external factors and global economic changes on market growth. Lastly, it provides strategic recommendations for new entrants and established companies to navigate the complexities of the market.
Future Outlook
- Industry participants will expand production capacity in high-demand regions to meet rising water treatment needs. They will leverage modular plant designs to accelerate project deployment.
- Food and beverage sectors will increase adoption of sodium metabisulfite for clean-label preservation. Producers will develop ultra-pure grades to satisfy stringent safety standards.
- Pulp and paper mills will integrate automated dosing systems to optimize chemical usage. Suppliers will offer digital monitoring services to ensure consistent quality.
- Pharmaceutical companies will explore antioxidant applications in injectable formulations. It will collaborate with chemical manufacturers to secure medical-grade supply.
- Research into bio-derived sulfur sources will gain momentum, reducing reliance on fossil-feedstock. Companies will pilot green synthesis routes to lower carbon footprints.
- Strategic partnerships between regional distributors and global producers will enhance market reach. They will streamline logistics to reduce lead times.
- Developing economies in Africa and Latin America will see growth through public–private water projects. It will provide turnkey dechlorination solutions for municipal plants.
- Technology providers will introduce AI-driven predictive analytics for demand forecasting. Manufacturers will adjust inventory levels based on real-time market signals.
- Consolidation through mergers and acquisitions will continue, driving scale efficiencies. It will enable firms to diversify product portfolios and enter new segments.
- Sustainability certifications will become a differentiator, prompting lifecycle assessments. Companies will publish environmental performance data to attract eco-conscious clients.
Request a Free Sample
Fill in your details and we'll send you a free sample report.
- Sample data tables & charts
- Research methodology
Market Dynamics
Expansion of Water Treatment Applications
Rapid urbanization and stricter discharge regulations are driving the need for effective dechlorination agents in municipal and industrial water treatment plants, boosting demand for sodium metabisulfite.
Rising Adoption in Food and Beverage Preservation
Food and beverage manufacturers are increasingly using sodium metabisulfite for its antimicrobial and antioxidant properties to extend shelf life and maintain product quality, especially as food safety standards become more stringent.
Growth in Pulp and Paper Production
The pulp and paper industry relies on sodium metabisulfite as a reducing agent for bleaching and pulping processes, with expanding production in Asia Pacific and Latin America supporting market growth.
Stringent Environmental Regulations and Sustainable Production
Tighter environmental controls and a shift toward green chemistry are prompting manufacturers to adopt cleaner production processes and optimize resource efficiency, increasing the appeal of sodium metabisulfite as a low-toxicity alternative.
Emerging Healthcare and Pharmaceutical Applications
The pharmaceutical sector is adopting sodium metabisulfite as an antioxidant preservative in formulations, opening new high-value growth avenues as demand for medical-grade chemicals rises.
Need a Custom Version of This Report?
Tailor the scope, geography, or segments to your exact requirements.
- Custom geography or segment scope
- Direct access to our analyst team
Frequently Asked Questions
What was the Global Sodium Metabisulfite Market size in 2023, and what are the projections for 2032 and CAGR?
Which factors drive growth in the Global Sodium Metabisulfite Market?
What are the primary applications of sodium metabisulfite?
Which region leads the Global Sodium Metabisulfite Market?
Who are the key players in this market?
Table of Content
Chapter 1 Market Segmentation
- 1.1 Segmentation Framework
- 1.1.1 Product and Service Classification
- 1.1.2 Application and End-Use Classification
- 1.1.3 Technology and Solution Classification
- 1.1.4 Customer and Distribution Channel Classification
- 1.1.5 Geographic Segmentation
- 1.1.6 Market Segment Definitions and Boundaries
- 1.2 By Grade
- 1.2.1 Food Grade
- 1.2.2 Industrial/Technical Grade
- 1.2.3 Photo Grade
- 1.3 By End Use
- 1.3.1 Food & Beverage
- 1.3.2 Water Treatment
- 1.3.3 Pulp & Paper
- 1.3.4 Textile
- 1.3.5 Mining
- 1.3.6 Chemical & Pharmaceutical
- 1.3.7 Photography & Film
- 1.3.8 Others
- 1.4 By Application
- 1.4.1 Preservative
- 1.4.2 Bleaching Agent
- 1.4.3 Dechlorination Agent
- 1.4.4 Chemical Synthesis / Intermediates
- 1.4.5 Floating Agent
- 1.4.6 Sealants & Others
Chapter 2 Introduction
- 2.1 Report Objectives and Scope
- 2.2 Product Definition and Industry Terminology
- 2.3 Market Inclusions and Exclusions
- 2.4 Research Process
- 2.4.1 Primary Research and Expert Interviews
- 2.4.2 Secondary Research and Source Review
- 2.4.3 Top-Down and Bottom-Up Estimation
- 2.4.4 Data Triangulation and Verification
- 2.5 Market Size Measurement Basis
- 2.5.1 2023: USD 638.5 million → 2032: USD 1,096.9 million
- 2.6 Historical and Forecast Reference Periods
- 2.6.1 Base Year: 2023
- 2.6.2 Forecast Period: 2023-2032
- 2.7 Research Assumptions and Limitations
Chapter 3 Executive Summary
- 3.1 Market Snapshot and Key Findings
- 3.2 Base-Year Market Size, 2023
- 3.3 Forecast Market Size, 2032
- 3.4 Revenue and Volume Growth Outlook
- 3.5 Key Demand and Supply Indicators
- 3.6 Leading Market Segments
- 3.7 Fastest-Growing Market Opportunities
- 3.8 Regional Performance Highlights
- 3.9 Technology and Industry Transformation
- 3.10 Competitive Landscape Summary
- 3.11 Analyst View and Strategic Implications
Chapter 4 Global Sodium Metabisulfite Market Trends and Developments
- 4.1 Historical Industry Development
- 4.2 Recent Market Trends and Developments
- 4.3 Demand and Customer Behavior Trends
- 4.4 Technology and Product Innovation
- 4.5 Artificial Intelligence, Automation and Digitalization
- 4.6 Local Manufacturing and Supply Chain Realignment
- 4.7 Industry Partnerships, Mergers and Acquisitions
- 4.8 Sustainability and Circular Economy Developments
- 4.9 Government and Private Sector Investment Trends
- 4.10 Emerging Business Models and Commercialization
- 4.11 Industry Developments and Announcements
Chapter 5 Global Sodium Metabisulfite Market Production, Supply and Demand Analysis
- 5.1 Demand Trend and Consumption Analysis
- 5.2 Demand Forecast, 2023-2032
- 5.3 Production and Output Trend
- 5.4 Production and Output Forecast, 2023-2032
- 5.5 Installed Capacity and Capacity Utilization
- 5.6 Company-Wise Production Plants and Statistics
- 5.6.1 Installed Production Capacity
- 5.6.2 Actual Production
- 5.6.3 Planned Capacity and Expansion Targets
- 5.7 Supply Chain Structure and Procurement Trends
- 5.8 Supply-Demand Gap and Bottlenecks
- 5.9 Import Dependence and Sourcing Structure
- 5.10 Contract Manufacturing and Outsourcing
- 5.11 Regional Supply and Demand Concentration
Chapter 6 Global Sodium Metabisulfite Market Pricing Analysis
- 6.1 Pricing Structure and Measurement
- 6.2 Historical Pricing Trends
- 6.3 Pricing Outlook, 2023-2032
- 6.4 Average Selling Price and Unit Economics
- 6.5 Pricing by Product and Market Segment
- 6.6 Geographic Pricing Differences
- 6.7 Key Input, Energy, Labor and Logistics Costs
- 6.8 Contract Pricing and Purchasing Models
- 6.9 Pricing Sensitivity and Competitive Positioning
- 6.10 Price, Margin and Profitability Implications
Chapter 7 Global Sodium Metabisulfite Market Dynamics
- 7.1 Market Growth Drivers
- 7.1.1 Demand-Side Drivers
- 7.1.2 Technology and Innovation Drivers
- 7.1.3 Infrastructure and Investment Drivers
- 7.1.4 Regulatory and Policy Drivers
- 7.2 Market Restraints
- 7.2.1 Cost and Affordability Constraints
- 7.2.2 Technology and Adoption Barriers
- 7.2.3 Supply Chain and Operational Constraints
- 7.3 Market Challenges
- 7.3.1 Competitive Pressure and Margin Erosion
- 7.3.2 Skills, Infrastructure and Implementation Gaps
- 7.4 Emerging Market Opportunities
- 7.5 Market Dynamics Impact and Time-Horizon Assessment
Chapter 8 Global Sodium Metabisulfite Value Chain Analysis
- 8.1 Industry Value Chain Overview
- 8.2 Upstream Suppliers and Critical Inputs
- 8.3 Technology and Component Providers
- 8.4 Manufacturing or Service Delivery
- 8.5 Distribution, Channel Partners and Integrators
- 8.6 Downstream Applications and End Users
- 8.7 Value Addition and Profit Pools
- 8.8 Vertical Integration and Outsourcing
- 8.9 Supplier Concentration and Risk
- 8.10 Supply Chain Localization and Resilience
Chapter 9 Global Sodium Metabisulfite Market Regulations and Policies
- 9.1 Relevant Laws, Standards and Compliance Frameworks
- 9.2 Product, Service, Safety and Quality Requirements
- 9.3 Government Policies, Incentives and Subsidies
- 9.4 Imports, Exports and Trade Barriers
- 9.5 Public Procurement and Local Content Requirements
- 9.6 Environmental and Sustainability Compliance
- 9.7 Upcoming Policy Changes and Market Implications
Chapter 10 Global Sodium Metabisulfite Market Hotspots and Opportunities
- 10.1 Market Opportunity Mapping and Growth Hotspots
- 10.2 High-Growth Applications and Customer Groups
- 10.3 Underserved Markets and White-Space Opportunities
- 10.4 Emerging Technology and Product Opportunities
- 10.5 New Capacity and Investment Hotspots
- 10.6 Market Entry and Expansion Opportunities
- 10.7 Distribution and Partnership Opportunities
- 10.8 Near-Term and Long-Term Commercial Potential
- 10.9 Opportunity Attractiveness and Execution Risks
Chapter 11 Global Sodium Metabisulfite Market Outlook, 2023-2032
- 11.1 Market Size and Analysis
- 11.1.1 Revenue (Market Measurement: 2023: USD 638.5 million → 2032: USD 1,096.9 million)
- 11.1.2 Market Volume and Quantity Sold
- 11.1.3 Historical Market Size
- 11.1.4 Base-Year Market Size, 2023
- 11.2 Market Forecast, 2023-2032
- 11.2.1 Revenue Forecast to 2032
- 11.2.2 Volume Forecast to 2032
- 11.2.3 CAGR and Year-on-Year Growth
- 11.2.4 Incremental Revenue Opportunity
- 11.3 Forecast Assumptions and Scenario Analysis
- 11.3.1 Base-Case Forecast
- 11.3.2 Optimistic and Conservative Scenarios
- 11.3.3 Technology, Pricing and Policy Sensitivities
- 11.4 Market Attractiveness and Growth Outlook
Chapter 12 Global Sodium Metabisulfite Market Segmentation and Outlook
- 12.1 Segmentation Summary and Market Shares, 2023
- 12.2 Largest and Fastest-Growing Segments
- 12.3 By Grade - Market Size and Forecast, 2023-2032
- 12.3.1 Segment Definition and Scope
- 12.3.2 Historical Market Size
- 12.3.3 Revenue Forecast, 2023-2032
- 12.3.4 Volume Forecast, 2023-2032
- 12.3.5 Base-Year Market Share, 2023
- 12.3.6 Segment CAGR and Growth Drivers
- 12.3.7 Subsegment Market Size and Forecast
- 12.3.7.1 Food Grade
- 12.3.7.2 Industrial/Technical Grade
- 12.3.7.3 Photo Grade
- 12.3.8 Subsegment Pricing and Adoption Trends
- 12.3.9 Leading Suppliers and Competition
- 12.3.10 Regional Demand and Opportunities
- 12.4 By End Use - Market Size and Forecast, 2023-2032
- 12.4.1 Segment Definition and Scope
- 12.4.2 Historical Market Size
- 12.4.3 Revenue Forecast, 2023-2032
- 12.4.4 Volume Forecast, 2023-2032
- 12.4.5 Base-Year Market Share, 2023
- 12.4.6 Segment CAGR and Growth Drivers
- 12.4.7 Subsegment Market Size and Forecast
- 12.4.7.1 Food & Beverage
- 12.4.7.2 Water Treatment
- 12.4.7.3 Pulp & Paper
- 12.4.7.4 Textile
- 12.4.7.5 Mining
- 12.4.7.6 Chemical & Pharmaceutical
- 12.4.7.7 Photography & Film
- 12.4.7.8 Others
- 12.4.8 Subsegment Pricing and Adoption Trends
- 12.4.9 Leading Suppliers and Competition
- 12.4.10 Regional Demand and Opportunities
- 12.5 By Application - Market Size and Forecast, 2023-2032
- 12.5.1 Segment Definition and Scope
- 12.5.2 Historical Market Size
- 12.5.3 Revenue Forecast, 2023-2032
- 12.5.4 Volume Forecast, 2023-2032
- 12.5.5 Base-Year Market Share, 2023
- 12.5.6 Segment CAGR and Growth Drivers
- 12.5.7 Subsegment Market Size and Forecast
- 12.5.7.1 Preservative
- 12.5.7.2 Bleaching Agent
- 12.5.7.3 Dechlorination Agent
- 12.5.7.4 Chemical Synthesis / Intermediates
- 12.5.7.5 Floating Agent
- 12.5.7.6 Sealants & Others
- 12.5.8 Subsegment Pricing and Adoption Trends
- 12.5.9 Leading Suppliers and Competition
- 12.5.10 Regional Demand and Opportunities
- 12.6 Segment Growth Comparison
- 12.7 Segment Attractiveness and Priority Matrix
Chapter 13 Global Sodium Metabisulfite End-Use and Application Market Outlook
- 13.1 End-Use Industry and Customer Demand Structure
- 13.2 Leading Applications and Customer Groups
- 13.3 End-Use Market Size, Share and Forecast
- 13.4 Major End-Use Industry Deep Dives
- 13.4.1 Customer Requirements and Use Cases
- 13.4.2 Demand and Replacement Cycles
- 13.4.3 Technical and Regulatory Considerations
- 13.4.4 Purchasing and Procurement Models
- 13.4.5 Leading Vendors and Distribution Channels
- 13.4.6 Forecast and Commercial Opportunities
- 13.5 Emerging Applications and Cross-Segment Demand
- 13.6 End-Use Industry Investment Priorities
Chapter 14 Global Sodium Metabisulfite Geographic Market Outlook, 2023-2032
- 14.1 Regional Market Size and Share, 2023
- 14.2 Regional Market Forecast, 2023-2032
- 14.3 Regional Pricing, Production and Demand Differences
- 14.4 North America
- 14.4.1 United States
- 14.4.2 Canada
- 14.4.3 Mexico
- 14.5 Europe
- 14.5.1 Germany
- 14.5.2 France
- 14.5.3 Italy
- 14.5.4 United Kingdom
- 14.5.5 Spain
- 14.5.6 Poland
- 14.5.7 Russia
- 14.5.8 Netherlands
- 14.5.9 Belgium
- 14.5.10 Sweden
- 14.5.11 Denmark
- 14.5.12 Norway
- 14.5.13 Rest of Europe
- 14.6 Asia Pacific
- 14.6.1 China
- 14.6.2 India
- 14.6.3 Japan
- 14.6.4 South Korea
- 14.6.5 Thailand
- 14.6.6 Indonesia
- 14.6.7 Vietnam
- 14.6.8 Malaysia
- 14.6.9 Australia
- 14.6.10 Rest of Asia Pacific
- 14.7 Latin America
- 14.7.1 Brazil
- 14.7.2 Argentina
- 14.7.3 Colombia
- 14.7.4 Chile
- 14.7.5 Rest of Latin America
- 14.8 Middle East
- 14.8.1 Saudi Arabia
- 14.8.2 United Arab Emirates
- 14.8.3 Turkey
- 14.8.4 Israel
- 14.8.5 Iran
- 14.8.6 Rest of the Middle East
- 14.9 Africa
- 14.9.1 South Africa
- 14.9.2 Egypt
- 14.9.3 Nigeria
- 14.9.4 Morocco
- 14.9.5 Rest of Africa
- 14.10 Regional Investment, Policy and Supply Chain Differences
- 14.11 Regional Competitive Landscape
- 14.12 Geographic Growth Hotspots
Chapter 15 Global Sodium Metabisulfite Technology, Innovation and Sustainability Outlook
- 15.1 Technology Landscape and Maturity
- 15.2 Product, Process and Service Innovation
- 15.3 AI, Automation and Digital Tools in the Industry
- 15.4 Technology Adoption and Performance Benchmarking
- 15.5 Innovation Pipeline and R&D Investment
- 15.6 Patent and Intellectual Property Trends
- 15.7 Energy Efficiency and Resource Management
- 15.8 Sustainability, Recycling and Circularity
- 15.9 Technology Roadmap, 2023-2032
- 15.10 Risks of Obsolescence and Technology Substitution
Chapter 16 Global Sodium Metabisulfite Market Key Strategic Imperatives
- 16.1 Growth and Market Entry Priorities
- 16.2 High-Return Products and Segments
- 16.3 Pricing, Profitability and Cost Optimization
- 16.4 Technology Investment and Product Differentiation
- 16.5 Supply Chain Localization and Resilience
- 16.6 Distribution and Customer Acquisition
- 16.7 Partnership, Acquisition and Capacity Strategy
- 16.8 Regional Expansion Priorities
- 16.9 Short-, Medium- and Long-Term Actions
Chapter 17 Competition Outlook
- 17.1 Industry Competition Characteristics
- 17.2 Market Structure and Concentration
- 17.3 Market Share and Competitive Positioning, 2023
- 17.4 Company-Wise Revenue and Product Benchmarking
- 17.5 Production and Service Capacity Benchmarking
- 17.6 Technology, Pricing and Differentiation
- 17.7 Regional Footprint and Distribution Strength
- 17.8 Mergers, Acquisitions and Strategic Alliances
- 17.9 New Entrants and Competitive Threats
- 17.10 Porter's Five Forces and Industry Attractiveness
- 17.11 Competitive Outlook, 2023-2032
Chapter 18 Company Profiles
- 18.1 Company Coverage and Selection Criteria
- 18.2 BASF SE
- 18.2.1 Business Description
- 18.2.2 Company Ownership and Geographic Presence
- 18.2.3 Product and Service Portfolio
- 18.2.4 Manufacturing and Operating Footprint
- 18.2.5 Production Capacity and Expansion Plans
- 18.2.6 Financial Performance and Investment
- 18.2.7 Market Share and Competitive Position
- 18.2.8 Technology and Innovation Capabilities
- 18.2.9 Strategic Alliances or Partnerships
- 18.2.10 Recent Developments
- 18.2.11 Growth Strategy and Outlook
- 18.3 Aditya Birla Chemicals
- 18.4 Ineos Calabrian Corporation
- 18.5 Esseco Group S.r.l.
- 18.6 Grillo-Werke Aktiengesellschaft
- 18.7 Shandong Kailong Chemical Technology Development Co., Ltd.
- 18.8 Qingdao Tianya Chemical Co., Ltd.
- 18.9 Anmol Chemicals
- 18.10 Valaji PharmaChem
- 18.11 Muby Chemicals
- 18.12 Other Relevant Market Participants
Note: Every listed company is profiled on the structure shown under the first company. The company list is preliminary and may change based on research findings, market developments, data availability and client requirements.
Chapter 19 Disclaimer
- 19.1 Research and Forecast Disclaimer
- 19.2 Data Source and Estimation Limitations
Note: The depth of individual sections depends on data availability for this market. Volume, capacity, trade and other unit-based metrics are included where applicable.