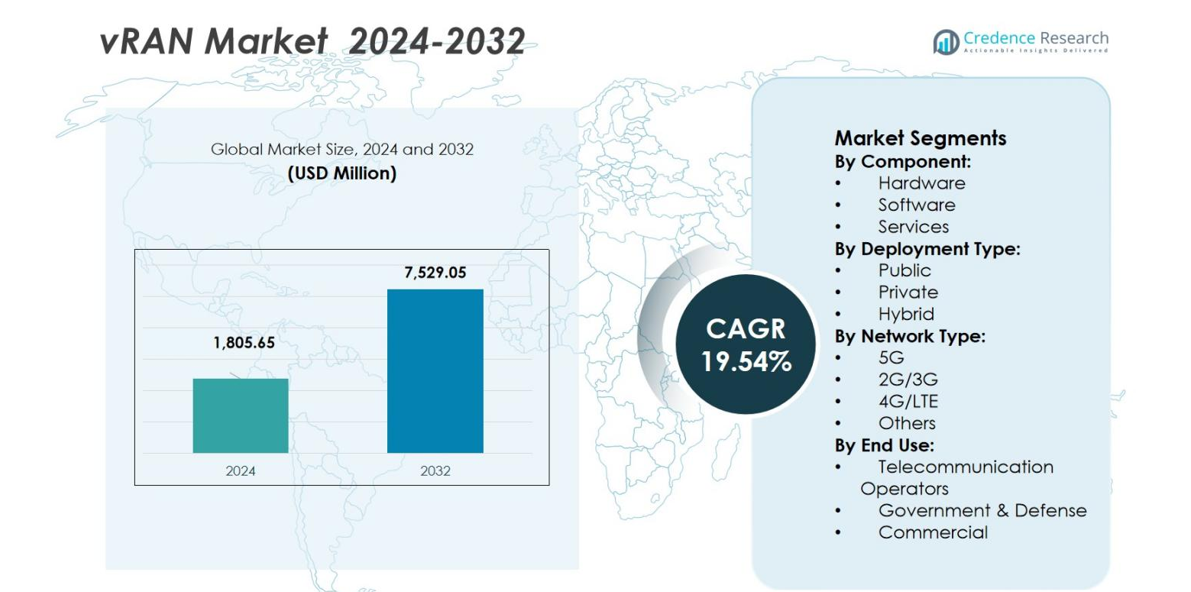
vRAN Market By Component (Radio Unit, Distributed Unit (DU), Central Unit (CU), Others (Cables, Switches, etc.) By Communication Infrastructure (Small Cell, Macro Cell) By Connectivity (2G, 3G, 4G/LTE, 5G) By End User (Telecommunication, Government & Defense) – Growth, Future Prospects & Competitive Analysis, 2016 – 2028

Price: $4999

Published: | Report ID: 11771 | Report Format : PDF

About this report

The global vRAN market report explores the critical analysis of the vRAN industry using key parameters. The report consists of investment strategies, the need for investments in the vRAN industry, and the multiple benefits for investors. Importantly, this report sets out major changes in the global technical regulations for the vRAN industry and how economic and non-economic barriers are helping the market grow. Moreover, the report analyses the global, regional, and country-level historic and forecasted market size. The report also provides a comprehensive analysis of key investment propositions, demand and supply gap, competitors positioning, STAR analysis, SRC analysis, and Tornado analysis. Key technological developments and other analyses include Porter’s five forces analysis, PESTEL analysis, value chain analysis, etc.

REPORT ATTRIBUTE DETAILS
vRAN Market by Volume Yes
Market by Value Yes
Market, Tornado Analysis Yes
Market, STAR Analysis Yes
Market, SRC Analysis Yes
Market, Import-Export Data Yes (On Demand)
Market Pricing Analysis Yes (On Demand)
Market Segment Analysis By Component (Radio Unit, Distributed Unit (DU), Central Unit (CU), Others (Cables, Switches, etc.))

By Communication Infrastructure (Small Cell and Macro Cell)

By Connectivity (2G, 3G, 4G/LTE, and 5G)

By End User (Telecommunication,Government & Defense, Commercial, and Others)

Market, Regional Analysis North America (the US and Canada)

Europe (Germany, UK, France, Italy, Spain, and the Rest of Europe)

Asia Pacific (China, India, Japan, South Korea, South East Asia, and the Rest of Asia Pacific)

Latin America (Brazil, Mexico, and the Rest of Latin America)

Middle East and Africa (GCC Countries, South Africa, and the Rest of the Middle East and Africa)

Market Key Companies Cisco Systems Inc, Fujitsu Limited, Huawei Technologies Co. Ltd, NEC Corporation, Samsung Electronics Co. Ltd, Verizon Communications, Ericsson Inc, Nokia Corporation, Red Hat Inc, Hewlett Packard Enterprise Development LP, Intel Corporation, Juniper Networks Inc, Microchip Technology Inc, MTI Mobile, Qorvo Inc, Mavenir Systems, Qualcomm Technologies Inc, Quortus Limited, Radisys Corporation, and ZTE Corporation
Market Competitive Landscape Market Share Analysis

Competitive Benchmarking

Key Players Market Positioning

Geographical Presence Analysis

Major Strategies Adopted


Key Highlights of the report

How are the major segments performing in the vRAN Market?

  • The radio unit component segment led the global market in 2021 due to the rapid adoption of radio technology and architecture to achieve 5G requirements.
  • In 2021, small-cell communication infrastructure accounted for the largest global market share. The factors that contribute to its attractiveness include cost-effectiveness and ease of implementation.
  • The 5G connectivity segment is anticipated to grow faster during the forecast period owing to the growing demand for wireless broadband services, which necessitate fast and high-capacity networks. The advanced development of 5G connectivity technology has been initiated to facilitate the provision of high-speed data transmission.
  • The telecommunications end-user segment has highest revenue share in the global market in 2021. Telecommunications service providers and mobile phone operators are investing significantly to bring cloud computing and mobile computing closer to base stations. This enables mobile phone companies and CSPs to virtualize base station operations like mobility management.
Design Element 2

Access crucial information at unmatched prices!

Request your free sample report today & start making informed decisions powered by Credence Research!

Download Free Sample
CTA Design Element 3

Which region dominated the vRAN market?

North America dominated the global vRAN market in 2021. Enhanced automation in various industries, internet of things (IoT) adoption, cellular M2M interconnection, and high demand for on-demand video streaming drive the regional vRAN market. As internet penetration rises, massive data traffic from various cellular and IoT devices is produced. As a result, radio access networks are being adopted more frequently to manage data traffic better and increase network speed. The government’s encouraging initiatives to commercialize 5G networks drive regional vRAN market demand.

How is US Market Performing in the vRAN Market?

In 2021, the United States dominated the North American vRAN market. The US Fiber Broadband Association promotes the installation of fiber optic cable in homes and businesses. The North American 5G industry is anticipated to be driven by the deployment of fiber, which will also indirectly drive demand for the deployment of vRAN, which gives service providers more flexible options at a lower cost. The US market is primarily driven by carriers’ plans to deploy 5G wireless technology, which calls for fiber backhaul. Small- or macro-cell deployment is heavily influenced by the network operator, the cost of deployment, and the local population. Small cell is expected to dominate the vRAN market in the United States. Small-cell and macro-cell deployment will increase exponentially as 5G becomes more widely available in the country.

What is the competitive environment of the vRAN market?

The virtualized radio access network (vRAN) market has a few significant players and is moderately competitive globally. However, as 4G and 5G services advance, more players are entering the market and growing their market share, which allows them to expand their business into emerging economies. Companies place a high value on partnerships to gain traction for their solutions and innovations. The business enters partnerships and acquisitions to increase its geographic presence in key markets. For instance, Altiostar and TIM collaborated on LTE-Advanced in February 2019 from Altiostar on Vimeo. The advanced virtual ran architecture gets carriers ready for 5G by allowing them to increase capacity using commercially available hardware and maximize spectrum resources. Moreover, Cisco Systems Inc announced plans in 2019 to implement a virtualized radio access network automation strategy for VodafoneZiggo using the Cisco SON platform.

Executive Summary

What technical developments are being developed in the global vRAN market?

Wireless networking is becoming increasingly important across all industries to meet future challenges in this technological era. Widespread industry demands for expanding business operations include faster networking data rates, lower latencies, and higher bandwidth. Private LTE and 5G networking support these requirements. Increased R&D efforts and product innovation are anticipated benefits of the investment in 5G infrastructure. The next big thing in mobile networks is the virtualized radio access network (vRAN), which is the process of virtualizing network function in addition to being more user-friendly and economical. VRAN technology would also pave the way for 5G technology, as there is an increasing demand for multipurpose applications from a single source. In addition, many industry players, including Verizon, Nokia, Qualcomm Technologies Inc, and Cisco Systems Inc, are heavily focused on offering vRAN solutions for private 5G networks that assist clients in converting their current legacy network infrastructure into the next-generation 5G network. For instance, Fujitsu declared in February 2022 that it had created a new software virtualized radio access network (vRAN) technology with support for 5G Standalone (SA) and would make it available for testing by telecom companies in March 2022. The goal of Fujitsu’s global deployment of this vRAN technology is to provide strong and cutting-edge support to telecommunications carriers striving to lessen their carbon footprint and ultimately aid in the creation of a more sustainable society.

Which are the key investments by the vRAN market players?

Most current vRAN investments are concentrated on virtualized small cells for focused greenfield deployments, primarily in environments with dense urban, enterprise, and public venue populations. Mobile operators can quickly assess the advantages of vRAN through the virtualization of small cells with minimal impact on their larger microcell RAN infrastructure. Market participants invest in and collaborate with other technology firms in the ecosystem to develop innovative vRAN solutions. For instance, Altiostar announced in February 2019 that Rakuten Inc had made a strategic investment in the company to grow its vRAN solutions for 4G and 5G technology. Likewise, NEC Corporation and Rakuten Mobile collaborated in June 2019 to develop a 3.7 GHz frequency-based massive MIMO 5G antenna radio unit that facilitates highly secure cloud-native 5G networks. This partnership assisted the business in creating a 5G-based accessible vRAN architecture in Japan.

Some major vRAN market players are Cisco Systems Inc, Fujitsu Limited, Huawei Technologies Co. Ltd, NEC Corporation, Verizon Communications, Ericsson Inc, Nokia Corporation, Intel Corporation, Juniper Networks Inc, Hewlett Packard Enterprise Development LP, Microchip Technology Inc, Qorvo Inc, Mavenir Systems, Samsung Electronics Co. Ltd, MTI Mobile, Qualcomm Technologies Inc, Radisys Corporation, Quortus Limited, Red Hat Inc, and ZTE Corporation.

What are the Major Driving Factors for the vRAN Market?

The increasing number of cellular devices generates an enormous amount of data traffic, allowing telecom operators to deploy advanced virtualized radio access network services to handle this massive data traffic. The growing use of Network Function Virtualization (NFV) and Software Defined Networking (SDN) in network infrastructure is also assisting in the growth of the global RAN market. The government’s supportive initiatives to upgrade telecom infrastructure are also contributing to the rising demand for virtualized radio access network solutions. The commercial exploitation of the next-generation 5G network enables telecom companies to deploy advanced network solutions that support the 5G network. The increased speed and bandwidth capabilities of the 5G network necessitate the use of advanced networking solutions to provide extremely reliable communication services. The leading telecommunication solution providers are strategically collaborating with other technology firms to create advanced virtualized radio access network solutions to enable 5G technology.

What are the Major Risks for the vRAN Market?

The vRAN market is anticipated to be constrained by the mobile network’s growing lackluster backhaul connectivity. Backhaul connectivity is frequently used in telecommunications to send a signal from a distant site or network to another site, typically for a central one. Mobile networks have poor connectivity in small cell networks, adversely affecting data transmission speed. Growing data traffic through small cells is a major cause of bad data management and poses problems for data security. As a result, poor backhaul connectivity and the data management process are expected to constrain the market over the forecast period.

Which is the key communication infrastructure in the vRAN market?

The small cell communication infrastructure category had a major share due to its low cost and ease of deployment. Mobile operators encounter a challenge when offering services with high data transfer rates. Mobile network operators primarily concentrate on expanding their networks to achieve this. Operators are creating and deploying small cells on a larger scale and faster rate to meet these needs. Demand for internet services is expected to rise due to increased video streaming, photo sharing, and online mobile application use. Small cells assist in increasing network capacity, so their adoption would accelerate to meet consumer demand. A further factor anticipated to contribute to the segment’s growth is the increasing investment mobile operators make for efficient communication infrastructure deployment.

How is the vRAN market performing in regions?

The North American market is expected to had major share than other regional markets during the forecast period. North America is the largest market for vRAN deployment since the United States is one of the major countries making strong efforts to deploy 5G in the coming years to improve the performance of IoT, autonomous vehicles, and other advanced technology. The regional telecommunication network providers are investing heavily and running trials of the vRAN architecture in important U.S. cities to lay the groundwork for 5G.

Asia Pacific is expected to witness growth with the highest CAGR during 2022-2028. The commercialization of 5G in nations like China, India, Japan, and South Korea is expected to be aided by factors like the expanding deployment of vRAN architecture, which is anticipated to fuel growth. Moreover, South Korean mobile carriers and service providers declared in April 2019 that they would share the cost of developing a 5G infrastructure. The South Korean government also helps these network providers offer 5G technology early in its commercialization.

Information and Communications Technology

What is the regulatory landscape for the vRAN market?

Government initiatives supporting telecom infrastructure development also aid the growing demand for virtualized radio access network solutions. Software vRAN architectures are in almost every market, including telecommunications, government, and defense. In the United States, vRAN is gaining traction to improve network performance for all users within the radio range. Moreover, the federal commissions or governments of the United States work with well-known players like Vodafone Group PLC and Telefonica S.A., among others, to develop the vRAN critical architecture. The network ecosystem is transforming due to the rising demand for mobile data requirements and the introduction of 5G technologies. In addition, the deployment of vRAN is anticipated to be greatly influenced by the aggressive measures taken by governments and network operators in various regions to deploy 5G effectively in the coming years.

Shape Your Report to Specific Countries or Regions & Enjoy 30% Off!

What is the Market Size of vRAN regarding value?

The global vRAN market is anticipated to grow at a substantial CAGR of 18.5% in the upcoming years. The global vRAN industry is estimated to be worth USD 1849.6 million in 2021 and is expected to be worth USD 5121.39 million by 2028.

What are the major players planning for the future of the vRAN market?

Companies are investing in network infrastructure to deliver dependable network coverage and data transformation services in response to rising customer demand for network coverage. Major companies are looking for a way to increase their return on investment by investing in communications infrastructure for network coverage. vRAN is a low-cost solution for network service providers to manage data traffic while minimizing operational and capital costs. vRAN assists service providers lower CAPEX and OPEX while improving packet data transfer quality.

Segmentation of Global vRAN Market –

Global vRAN Market – By Component

  • Radio Unit
  • Distributed Unit (DU)
  • Central Unit (CU)
  • Others (Cables, Switches, etc.)

Global vRAN Market – By Communication Infrastructure

  • Small Cell
  • Macro Cell

Global vRAN Market – By Connectivity

  • 2G
  • 3G
  • 4G/LTE
  • 5G

Global vRAN Market – By End User

  • Telecommunication
  • Government & Defense
  • Commercial
  • Others

Global vRAN Market – By Region

  • North America
    • US
    • Canada
  • Europe
    • Germany
    • France
    • UK.
    • Italy
    • Spain
    • Rest of Europe
  • Asia Pacific
    • China
    • Japan
    • India
    • South Korea
    • South-east Asia
    • Rest of Asia Pacific
  • Latin America
    • Brazil
    • Mexico
    • Rest of Latin America
  • Middle East & Africa
    • GCC Countries
    • South Africa
    • Rest of the Middle East and Africa

1. Preface
1.1. Report Description
1.1.1. Purpose of the Report
1.1.2. Target Audience
1.1.3. USP and Key Offerings
1.2. Research Scope
1.3. Research Methodology
1.3.1. Phase I – Secondary Research
1.3.2. Phase II – Primary Research
1.3.3. Phase III – Expert Panel Review
1.3.4. Approach Adopted
1.3.4.1. Top-Down Approach
1.3.4.2. Bottom-Up Approach
1.3.5. Assumptions
1.4. Market Segmentation

2. Executive Summary
2.1. Market Snapshot: Global vRAN Market
2.2. Global vRAN Market, By Component
2.3. Global vRAN Market, By Communication Infrastructure
2.4. Global vRAN Market, By Connectivity
2.5. Global vRAN Market, By End User
2.6. Global vRAN Market, By Region
3. Market Dynamics & Factors Analysis
3.1. Introduction
3.1.1. Global vRAN Market Value, 2016-2028, (US$ Bn)
3.2. Market Dynamics
3.2.1. Key Growth Trends
3.2.2. Market Drivers
3.2.3. Market Restraints
3.2.4. Market Opportunities
3.2.5. Major Industry Challenges
3.3. Attractive Investment Proposition,2021
3.3.1. Component
3.3.2. Communication Infrastructure
3.3.3. Connectivity
3.3.4. End User
3.3.5. Geography

4. Premium Insights
4.1. STAR (Situation, Task, Action, Results) Analysis
4.2. Porter’s Five Forces Analysis
4.2.1. Threat of New Entrants
4.2.2. Bargaining Power of Buyers/Consumers
4.2.3. Bargaining Power of Suppliers
4.2.4. Threat of Substitute Types
4.2.5. Intensity of Competitive Rivalry
4.3. Value Chain Analysis
4.4. Technology Analysis
4.5. Marketing Strategy Analysis
4.5.1. Direct Marketing
4.5.2. Indirect Marketing
4.5.3. Marketing Channel Development Trend

5. Market Positioning of Key Players, 2021
5.1. Company Market Share of Key Players, 2021
5.2. Competitive Benchmarking
5.3. Market Positioning of Key Vendors
5.4. Geographical Presence Analysis
5.5. Major Strategies Adopted by Key Players
5.5.1. Key Strategies Analysis
5.5.2. Mergers and Acquisitions
5.5.3. Partnerships
5.5.4. Product Launch
5.5.5. Geographical Expansion
5.5.6. Others

6. COVID-19 Impact Analysis
6.1. Global vRAN Market Pre Vs Post COVID-19, 2019 – 2028
6.2. Impact on Import & Export
6.3. Impact on Demand & Supply

7. Global vRAN Market
7.1. Global vRAN Market, by Component, 2016-2028(US$ Bn)
7.1.1. Overview
7.1.2. Global vRAN Market, By Component, 2021 vs 2028 (in%)
7.1.3. Global vRAN Market, By Radio Unit, 2016-2028 (US$ Bn)
7.1.4. Global vRAN Market, By Distributed Unit (DU), 2016-2028 (US$ Bn)
7.1.5. Global vRAN Market, By Central Unit (CU), 2016-2028 (US$ Bn)
7.1.6. Global vRAN Market, By Others (Cables, Switches, etc.), 2016-2028 (US$ Bn)
7.2. Global vRAN Market, by Communication Infrastructure, 2016-2028(US$ Bn)
7.2.1. Overview
7.2.2. Global vRAN Market, By Communication Infrastructure, 2021 vs 2028 (in%)
7.2.3. Global vRAN Market, By Small Cell, 2016-2028 (US$ Bn)
7.2.4. Global vRAN Market, By Macro Cell, 2016-2028 (US$ Bn)
7.3. Global vRAN Market, by Connectivity, 2016-2028(US$ Bn)
7.3.1. Overview
7.3.2. Global vRAN Market, By Connectivity, 2021 vs 2028 (in%)
7.3.3. Global vRAN Market, By 2G, 2016-2028 (US$ Bn)
7.3.4. Global vRAN Market, By 3G, 2016-2028 (US$ Bn)
7.3.5. Global vRAN Market, By 4G/LTE, 2016-2028 (US$ Bn)
7.3.6. Global vRAN Market, By 5G, 2016-2028 (US$ Bn)
7.4. Global vRAN Market, by End User, 2016-2028(US$ Bn)
7.4.1. Overview
7.4.2. Global vRAN Market, By End User, 2021 vs 2028 (in%)
7.4.3. Global vRAN Market, By Telecommunication, 2016-2028 (US$ Bn)
7.4.4. Global vRAN Market, By Government & Defense, 2016-2028 (US$ Bn)
7.4.5. Global vRAN Market, By Commercial, 2016-2028 (US$ Bn)
7.4.6. Global vRAN Market, By Others, 2016-2028 (US$ Bn)

8. North America vRAN Market Analysis
8.1. North America vRAN Market, by Component, 2016-2028(US$ Bn)
8.1.1. Overview
8.1.2. SRC Analysis
8.2. North America vRAN Market, by Communication Infrastructure, 2016-2028(US$ Bn)
8.2.1. Overview
8.2.2. SRC Analysis
8.3. North America vRAN Market, by Connectivity, 2016-2028(US$ Bn)
8.3.1. Overview
8.3.2. SRC Analysis
8.4. North America vRAN Market, by End User, 2016-2028(US$ Bn)
8.4.1. Overview
8.4.2. SRC Analysis
8.5. North America vRAN Market, by Country, 2016-2028 (US$ Bn)
8.5.1. U.S.
8.5.1.1. U.S. vRAN Market Estimates and Forecast, 2016-2028 (US$ Bn)
8.5.1.2. U.S. vRAN Market, By Component, 2016-2028 (US$ Bn)
8.5.1.3. U.S. vRAN Market, By Communication Infrastructure, 2016-2028 (US$ Bn)
8.5.1.4. U.S. vRAN Market, By Connectivity, 2016-2028 (US$ Bn)
8.5.1.5. U.S. vRAN Market, By End User, 2016-2028 (US$ Bn)
8.5.2. Canada
8.5.2.1. Canada vRAN Market Estimates and Forecast, 2016-2028 (US$ Bn)
8.5.2.2. Canada vRAN Markets, By Component, 2016-2028 (US$ Bn)
8.5.2.3. Canada vRAN Market, By Communication Infrastructure, 2016-2028 (US$ Bn)
8.5.2.4. Canada vRAN Market, By Connectivity, 2016-2028 (US$ Bn)
8.5.2.5. Canada vRAN Market, By End User, 2016-2028 (US$ Bn)

9. Europe vRAN Market Analysis
9.1. Europe vRAN Market, by Component, 2016-2028(US$ Bn)
9.1.1. Overview
9.1.2. SRC Analysis
9.2. Europe vRAN Market, by Communication Infrastructure, 2016-2028(US$ Bn)
9.2.1. Overview
9.2.2. SRC Analysis
9.3. Europe vRAN Market, by Connectivity, 2016-2028(US$ Bn)
9.3.1. Overview
9.3.2. SRC Analysis
9.4. Europe vRAN Market, by End User, 2016-2028(US$ Bn)
9.4.1. Overview
9.4.2. SRC Analysis
9.5. Europe vRAN Market, by Country, 2016-2028 (US$ Bn)
9.5.1. Germany
9.5.1.1. Germany vRAN Market Estimates and Forecast, 2016-2028 (US$ Bn)
9.5.1.2. Germany vRAN Market, By Component, 2016-2028 (US$ Bn)
9.5.1.3. Germany vRAN Market, By Communication Infrastructure, 2016-2028 (US$ Bn)
9.5.1.4. Germany vRAN Market, By Connectivity, 2016-2028 (US$ Bn)
9.5.1.5. Germany vRAN Market, By End User, 2016-2028 (US$ Bn)
9.5.2. France
9.5.2.1. France vRAN Market Estimates and Forecast, 2016-2028 (US$ Bn)
9.5.2.2. France vRAN Market, By Component, 2016-2028 (US$ Bn)
9.5.2.3. France vRAN Market, By Communication Infrastructure, 2016-2028 (US$ Bn)
9.5.2.4. France vRAN Market, By Connectivity, 2016-2028 (US$ Bn)
9.5.2.5. France vRAN Market, By End User, 2016-2028 (US$ Bn)
9.5.3. UK
9.5.3.1. UK vRAN Market Estimates and Forecast, 2016-2028 (US$ Bn)
9.5.3.2. UK vRAN Market, By Component, 2016-2028 (US$ Bn)
9.5.3.3. UK vRAN Market, By Communication Infrastructure, 2016-2028 (US$ Bn)
9.5.3.4. UK vRAN Market, By Connectivity, 2016-2028 (US$ Bn)
9.5.3.5. UK vRAN Market, By End User, 2016-2028 (US$ Bn)
9.5.4. Italy
9.5.4.1. Italy vRAN Market Estimates and Forecast, 2016-2028 (US$ Bn)
9.5.4.2. Italy vRAN Market, By Component, 2016-2028 (US$ Bn)
9.5.4.3. Italy vRAN Market, By Communication Infrastructure, 2016-2028 (US$ Bn)
9.5.4.4. Italy vRAN Market, By Connectivity, 2016-2028 (US$ Bn)
9.5.4.5. Italy vRAN Market, By End User, 2016-2028 (US$ Bn)
9.5.5. Spain
9.5.5.1. Spain vRAN Market Estimates and Forecast, 2016-2028 (US$ Bn)
9.5.5.2. Spain vRAN Market, By Component, 2016-2028 (US$ Bn)
9.5.5.3. Spain vRAN Market, By Communication Infrastructure, 2016-2028 (US$ Bn)
9.5.5.4. Spain vRAN Market, By Connectivity, 2016-2028 (US$ Bn)
9.5.5.5. Spain vRAN Market, By End User, 2016-2028 (US$ Bn)
9.5.6. Rest of Europe
9.5.6.1. Rest of Europe vRAN Market Estimates and Forecast, 2016-2028 (US$ Bn)
9.5.6.2. Rest of Europe vRAN Market, By Component, 2016-2028 (US$ Bn)
9.5.6.3. Rest of Europe vRAN Market, By Communication Infrastructure, 2016-2028 (US$ Bn)
9.5.6.4. Rest of Europe vRAN Market, By Connectivity, 2016-2028 (US$ Bn)
9.5.6.5. Rest of Europe vRAN Market, By End User, 2016-2028 (US$ Bn)

10. Asia Pacific vRAN Market Analysis
10.1. Asia Pacific vRAN Market, by Component, 2016-2028(US$ Bn)
10.1.1. Overview
10.1.2. SRC Analysis
10.2. Asia Pacific vRAN Market, by Communication Infrastructure, 2016-2028(US$ Bn)
10.2.1. Overview
10.2.2. SRC Analysis
10.3. Asia Pacific vRAN Market, by Connectivity, 2016-2028(US$ Bn)
10.3.1. Overview
10.3.2. SRC Analysis
10.4. Asia Pacific vRAN Market, by End User, 2016-2028(US$ Bn)
10.4.1. Overview
10.4.2. SRC Analysis
10.5. Asia Pacific vRAN Market, by Country, 2016-2028 (US$ Bn)
10.5.1. China
10.5.1.1. China vRAN Market Estimates and Forecast, 2016-2028 (US$ Bn)
10.5.1.2. China vRAN Market, By Component, 2016-2028 (US$ Bn)
10.5.1.3. China vRAN Market, By Communication Infrastructure, 2016-2028 (US$ Bn)
10.5.1.4. China vRAN Market, By Connectivity, 2016-2028 (US$ Bn)
10.5.1.5. China vRAN Market, By End User, 2016-2028 (US$ Bn)
10.5.2. Japan
10.5.2.1. Japan vRAN Market Estimates and Forecast, 2016-2028 (US$ Bn)
10.5.2.2. Japan vRAN Market, By Component, 2016-2028 (US$ Bn)
10.5.2.3. Japan vRAN Market, By Communication Infrastructure, 2016-2028 (US$ Bn)
10.5.2.4. Japan vRAN Market, By Connectivity, 2016-2028 (US$ Bn)
10.5.2.5. Japan vRAN Market, By End User, 2016-2028 (US$ Bn)
10.5.3. India
10.5.3.1. India vRAN Market Estimates and Forecast, 2016-2028 (US$ Bn)
10.5.3.2. India vRAN Market, By Component, 2016-2028 (US$ Bn)
10.5.3.3. India vRAN Market, By Communication Infrastructure, 2016-2028 (US$ Bn)
10.5.3.4. India vRAN Market, By Connectivity, 2016-2028 (US$ Bn)
10.5.3.5. India vRAN Market, By End User, 2016-2028 (US$ Bn)
10.5.4. South Korea
10.5.4.1. South Korea vRAN Market Estimates and Forecast, 2016-2028 (US$ Bn)
10.5.4.2. South Korea vRAN Market, By Component, 2016-2028 (US$ Bn)
10.5.4.3. South Korea vRAN Market, By Communication Infrastructure, 2016-2028 (US$ Bn)
10.5.4.4. South Korea vRAN Market, By Connectivity, 2016-2028 (US$ Bn)
10.5.4.5. South Korea vRAN Market, By End User, 2016-2028 (US$ Bn)
10.5.5. South-East Asia
10.5.5.1. South-East Asia vRAN Market Estimates and Forecast, 2016-2028 (US$ Bn)
10.5.5.2. South-East Asia vRAN Market, By Component, 2016-2028 (US$ Bn)
10.5.5.3. South-East Asia vRAN Market, By Communication Infrastructure, 2016-2028 (US$ Bn)
10.5.5.4. South-East Asia vRAN Market, By Connectivity, 2016-2028 (US$ Bn)
10.5.5.5. South-East Asia vRAN Market, By End User, 2016-2028 (US$ Bn)
10.5.6. Rest of Asia Pacific
10.5.6.1. Rest of Asia Pacific vRAN Market Estimates and Forecast, 2016-2028 (US$ Bn)
10.5.6.2. Rest of Asia Pacific vRAN Market, By Component, 2016-2028 (US$ Bn)
10.5.6.3. Rest of Asia Pacific vRAN Market, By Communication Infrastructure, 2016-2028 (US$ Bn)
10.5.6.4. Rest of Asia Pacific vRAN Market, By Connectivity, 2016-2028 (US$ Bn)
10.5.6.5. Rest of Asia Pacific vRAN Market, By End User, 2016-2028 (US$ Bn)

11. Latin America vRAN Market Analysis
11.1. Latin America vRAN Market, by Component, 2016-2028(US$ Bn)
11.1.1. Overview
11.1.2. SRC Analysis
11.2. Latin America vRAN Market, by Communication Infrastructure, 2016-2028(US$ Bn)
11.2.1. Overview
11.2.2. SRC Analysis
11.3. Latin America vRAN Market, by Connectivity, 2016-2028(US$ Bn)
11.3.1. Overview
11.3.2. SRC Analysis
11.4. Latin America vRAN Market, by End User, 2016-2028(US$ Bn)
11.4.1. Overview
11.4.2. SRC Analysis
11.5. Latin America vRAN Market, by Country, 2016-2028 (US$ Bn)
11.5.1. Brazil
11.5.1.1. Brazil vRAN Market Estimates and Forecast, 2016-2028 (US$ Bn)
11.5.1.2. Brazil vRAN Market, By Component, 2016-2028 (US$ Bn)
11.5.1.3. Brazil vRAN Market, By Communication Infrastructure, 2016-2028 (US$ Bn)
11.5.1.4. Brazil vRAN Market, By Connectivity, 2016-2028 (US$ Bn)
11.5.1.5. Brazil vRAN Market, By End User, 2016-2028 (US$ Bn)
11.5.2. Mexico
11.5.2.1. Mexico vRAN Market Estimates and Forecast, 2016-2028 (US$ Bn)
11.5.2.2. Mexico vRAN Market, By Component, 2016-2028 (US$ Bn)
11.5.2.3. Mexico vRAN Market, By Communication Infrastructure, 2016-2028 (US$ Bn)
11.5.2.4. Mexico vRAN Market, By Connectivity, 2016-2028 (US$ Bn)
11.5.2.5. Mexico vRAN Market, By End User, 2016-2028 (US$ Bn)
11.5.3. Rest of Latin America
11.5.3.1. Rest of Latin America vRAN Market Estimates and Forecast, 2016-2028 (US$ Bn)
11.5.3.2. Rest of Latin America vRAN Market, By Component, 2016-2028 (US$ Bn)
11.5.3.3. Rest of Latin America vRAN Market, By Communication Infrastructure, 2016-2028 (US$ Bn)
11.5.3.4. Rest of Latin America vRAN Market, By Connectivity, 2016-2028 (US$ Bn)
11.5.3.5. Rest of Latin America vRAN Market, By End User, 2016-2028 (US$ Bn)

12. Middle East and Africa vRAN Market Analysis
12.1. Middle East and Africa vRAN Market, by Component, 2016-2028(US$ Bn)
12.1.1. Overview
12.1.2. SRC Analysis
12.2. Middle East and Africa vRAN Market, by Communication Infrastructure, 2016-2028(US$ Bn)
12.2.1. Overview
12.2.2. SRC Analysis
12.3. Middle East and Africa vRAN Market, by Connectivity, 2016-2028(US$ Bn)
12.3.1. Overview
12.3.2. SRC Analysis
12.4. Middle East and Africa vRAN Market, by End User, 2016-2028(US$ Bn)
12.4.1. Overview
12.4.2. SRC Analysis
12.5. Middle East and Africa vRAN Market, by Country, 2016-2028 (US$ Bn)
12.5.1. GCC Countries
12.5.1.1. GCC Countries vRAN Market Estimates and Forecast, 2016-2028 (US$ Bn)
12.5.1.2. GCC Countries vRAN Market, By Component, 2016-2028 (US$ Bn)
12.5.1.3. GCC Countries vRAN Market, By Communication Infrastructure, 2016-2028 (US$ Bn)
12.5.1.4. GCC Countries vRAN Market, By Connectivity, 2016-2028 (US$ Bn)
12.5.1.5. GCC Countries vRAN Market, By End User, 2016-2028 (US$ Bn)
12.5.2. South Africa
12.5.2.1. South Africa vRAN Market Estimates and Forecast, 2016-2028 (US$ Bn)
12.5.2.2. South Africa vRAN Market, By Component, 2016-2028 (US$ Bn)
12.5.2.3. South Africa vRAN Market, By Communication Infrastructure, 2016-2028 (US$ Bn)
12.5.2.4. South Africa vRAN Market, By Connectivity, 2016-2028 (US$ Bn)
12.5.2.5. South Africa vRAN Market, By End User, 2016-2028 (US$ Bn)
12.5.3. Rest of Middle East and Africa
12.5.3.1. Rest of Middle East and Africa vRAN Market Estimates and Forecast, 2016-2028 (US$ Bn)
12.5.3.2. Rest of Middle East and Africa vRAN Market, By Component, 2016-2028 (US$ Bn)
12.5.3.3. Rest of Middle East and Africa vRAN Market, By Communication Infrastructure, 2016-2028 (US$ Bn)
12.5.3.4. Rest of Middle East and Africa vRAN Market, By Connectivity, 2016-2028 (US$ Bn)
12.5.3.5. Rest of Middle East and Africa vRAN Market, By End User, 2016-2028 (US$ Bn)

13. Company Profiles
13.1. Cisco Systems Inc
13.1.1. Company Overview
13.1.2. Products/Services Portfolio
13.1.3. Geographical Presence
13.1.4. Financial Summary
13.1.4.1. Market Revenue and Net Profit (2019-2021)
13.1.4.2. Business Segment Revenue Analysis
13.1.4.3. Geographical Revenue Analysis
13.2. Fujitsu Limited
13.3. Huawei Technologies Co. Ltd
13.4. NEC Corporation
13.5. Samsung Electronics Co. Ltd
13.6. Verizon Communications
13.7. Ericsson Inc
13.8. Nokia Corporation
13.9. Red Hat Inc
13.10. Hewlett Packard Enterprise Development LP
13.11. Intel Corporation
13.12. Juniper Networks Inc
13.13. Microchip Technology Inc
13.14. MTI Mobile
13.15. Qorvo Inc
13.16. Mavenir Systems
13.17. Qualcomm Technologies Inc
13.18. Quortus Limited
13.19. Radisys Corporation
13.20. ZTE Corporation


List of Figures

FIG. 1 Global vRAN Market: Research Methodology
FIG. 2 Market Size Estimation – Top Down & Bottom up Approach
FIG. 3 Global vRAN Market Segmentation
FIG. 4 Global vRAN Market, by Component, 2021 (US$ Bn)
FIG. 5 Global vRAN Market, by Communication Infrastructure, 2021 (US$ Bn)
FIG. 6 Global vRAN Market, by Connectivity, 2021 (US$ Bn)
FIG. 7 Global vRAN Market, by End User, 2021 (US$ Bn)
FIG. 8 Global vRAN Market, by Geography, 2021 (US$ Bn)
FIG. 9 Attractive Investment Proposition, by Component, 2021
FIG. 10 Attractive Investment Proposition, by Communication Infrastructure, 2021
FIG. 11 Attractive Investment Proposition, by Connectivity, 2021
FIG. 12 Attractive Investment Proposition, by End User, 2021
FIG. 13 Attractive Investment Proposition, by Geography, 2021
FIG. 14 Global Market Share Analysis of Key vRAN Market Manufacturers, 2021
FIG. 15 Global Market Positioning of Key vRAN Market Manufacturers, 2021
FIG. 16 Global vRAN Market Value Contribution, By Component, 2021 & 2028 (Value %)
FIG. 17 Global vRAN Market, by Radio Unit, Value, 2016-2028 (US$ Bn)
FIG. 18 Global vRAN Market, by Distributed Unit (DU), Value, 2016-2028 (US$ Bn)
FIG. 19 Global vRAN Market, by Central Unit (CU), Value, 2016-2028 (US$ Bn)
FIG. 20 Global vRAN Market, by Others (Cables, Switches, etc.), Value, 2016-2028 (US$ Bn)
FIG. 21 Global vRAN Market Value Contribution, By Communication Infrastructure, 2021 & 2028 (Value %)
FIG. 22 Global vRAN Market, by Small Cell, Value, 2016-2028 (US$ Bn)
FIG. 23 Global vRAN Market, by Macro Cell, Value, 2016-2028 (US$ Bn)
FIG. 24 Global vRAN Market Value Contribution, By Connectivity, 2021 & 2028 (Value %)
FIG. 25 Global vRAN Market, by 2G, Value, 2016-2028 (US$ Bn)
FIG. 26 Global vRAN Market, by 3G, Value, 2016-2028 (US$ Bn)
FIG. 27 Global vRAN Market, by 4G/LTE, Value, 2016-2028 (US$ Bn)
FIG. 28 Global vRAN Market, by 5G, Value, 2016-2028 (US$ Bn)
FIG. 29 Global vRAN Market Value Contribution, By End User, 2021 & 2028 (Value %)
FIG. 30 Global vRAN Market, by Telecommunication, Value, 2016-2028 (US$ Bn)
FIG. 31 Global vRAN Market, by Government & Defense, Value, 2016-2028 (US$ Bn)
FIG. 32 Global vRAN Market, by Commercial, Value, 2016-2028 (US$ Bn)
FIG. 33 Global vRAN Market, by Others, Value, 2016-2028 (US$ Bn)
FIG. 34 U.S. vRAN Market, 2016-2028 (US$ Bn)
FIG. 35 Canada vRAN Market, 2016-2028 (US$ Bn)
FIG. 36 Germany vRAN Market, 2016-2028 (US$ Bn)
FIG. 37 France vRAN Market, 2016-2028 (US$ Bn)
FIG. 38 U.K. vRAN Market, 2016-2028 (US$ Bn)
FIG. 39 Italy vRAN Market, 2016-2028 (US$ Bn)
FIG. 40 Spain vRAN Market, 2016-2028 (US$ Bn)
FIG. 41 Rest of Europe vRAN Market, 2016-2028 (US$ Bn)
FIG. 42 China vRAN Market, 2016-2028 (US$ Bn)
FIG. 43 Japan vRAN Market, 2016-2028 (US$ Bn)
FIG. 44 India vRAN Market, 2016-2028 (US$ Bn)
FIG. 45 South Korea vRAN Market, 2016-2028 (US$ Bn)
FIG. 46 Southeast Asia vRAN Market, 2016-2028 (US$ Bn)
FIG. 47 Rest of Asia Pacific vRAN Market, 2016-2028 (US$ Bn)
FIG. 48 Latin America vRAN Market, 2016-2028 (US$ Bn)
FIG. 49 Brazil vRAN Market, 2016-2028 (US$ Bn)
FIG. 50 Mexico vRAN Market, 2016-2028 (US$ Bn)
FIG. 51 Rest of Latin America vRAN Market, 2016-2028 (US$ Bn)
FIG. 52 Middle East & Africa vRAN Market, 2016-2028 (US$ Bn)
FIG. 53 GCC Countries vRAN Market, 2016-2028 (US$ Bn)
FIG. 54 South Africa vRAN Market, 2016-2028 (US$ Bn)
FIG. 55 Rest of Middle East and Africa vRAN Market, 2016-2028 (US$ Bn)

List of Tables

TABLE 1 Market Snapshot: Global vRAN Market
TABLE 2 Global vRAN Market, by Competitive Benchmarking, 2021
TABLE 3 Global vRAN Market, by Geographical Presence Analysis, 2021
TABLE 4 Global vRAN Market, by Key Strategies Analysis, 2021
TABLE 5 Global vRAN Market, by Component, 2016-2028 (US$ Bn)
TABLE 6 Global vRAN Market, by Communication Infrastructure, 2016-2028 (US$ Bn)
TABLE 7 Global vRAN Market, by Connectivity, 2016-2028 (US$ Bn)
TABLE 8 Global vRAN Market, by End User, 2016-2028 (US$ Bn)
TABLE 9 Global vRAN Market, by Geography, 2016-2028 (US$ Bn)
TABLE 10 North America vRAN Market, by Component, 2016-2028 (US$ Bn)
TABLE 11 North America vRAN Market, by Communication Infrastructure, 2016-2028 (US$ Bn)
TABLE 12 North America vRAN Market, by Connectivity, 2016-2028 (US$ Bn)
TABLE 13 North America vRAN Market, by End User, 2016-2028 (US$ Bn)
TABLE 14 North America vRAN Market, by Country, 2016-2028 (US$ Bn)
TABLE 15 US vRAN Market, by Component, 2016-2028 (US$ Bn)
TABLE 16 US vRAN Market, by Communication Infrastructure, 2016-2028 (US$ Bn)
TABLE 17 US vRAN Market, by Connectivity, 2016-2028 (US$ Bn)
TABLE 18 US vRAN Market, by End User, 2016-2028 (US$ Bn)
TABLE 19 Canada vRAN Market, by Component, 2016-2028 (US$ Bn)
TABLE 20 Canada vRAN Market, by Communication Infrastructure, 2016-2028 (US$ Bn)
TABLE 21 Canada vRAN Market, by Connectivity, 2016-2028 (US$ Bn)
TABLE 22 Canada vRAN Market, by End User, 2016-2028 (US$ Bn)
TABLE 23 Europe vRAN Market, by Component, 2016-2028 (US$ Bn)
TABLE 24 Europe vRAN Market, by Communication Infrastructure, 2016-2028 (US$ Bn)
TABLE 25 Europe vRAN Market, by Connectivity, 2016-2028 (US$ Bn)
TABLE 26 Europe vRAN Market, by End User, 2016-2028 (US$ Bn)
TABLE 27 Europe vRAN Market, by Country, 2016-2028 (US$ Bn)
TABLE 28 Germany vRAN Market, by Component, 2016-2028 (US$ Bn)
TABLE 29 Germany vRAN Market, by Communication Infrastructure, 2016-2028 (US$ Bn)
TABLE 30 Germany vRAN Market, by Connectivity, 2016-2028 (US$ Bn)
TABLE 31 Germany vRAN Market, by End User, 2016-2028 (US$ Bn)
TABLE 32 France vRAN Market, by Component, 2016-2028 (US$ Bn)
TABLE 33 France vRAN Market, by Communication Infrastructure, 2016-2028 (US$ Bn)
TABLE 34 France vRAN Market, by Connectivity, 2016-2028 (US$ Bn)
TABLE 35 France vRAN Market, by End User, 2016-2028 (US$ Bn)
TABLE 36 UK vRAN Market, by Component, 2016-2028 (US$ Bn)
TABLE 37 UK vRAN Market, by Communication Infrastructure, 2016-2028 (US$ Bn)
TABLE 38 UK vRAN Market, by Connectivity, 2016-2028 (US$ Bn)
TABLE 39 UK vRAN Market, by End User, 2016-2028 (US$ Bn)
TABLE 40 Italy vRAN Market, by Component, 2016-2028 (US$ Bn)
TABLE 41 Italy vRAN Market, by Communication Infrastructure, 2016-2028 (US$ Bn)
TABLE 42 Italy vRAN Market, by Connectivity, 2016-2028 (US$ Bn)
TABLE 43 Italy vRAN Market, by End User, 2016-2028 (US$ Bn)
TABLE 44 Spain vRAN Market, by Component, 2016-2028 (US$ Bn)
TABLE 45 Spain vRAN Market, by Communication Infrastructure, 2016-2028 (US$ Bn)
TABLE 46 Spain vRAN Market, by Connectivity, 2016-2028 (US$ Bn)
TABLE 47 Spain vRAN Market, by End User, 2016-2028 (US$ Bn)
TABLE 48 Rest of Europe vRAN Market, by Component, 2016-2028 (US$ Bn)
TABLE 49 Rest of Europe vRAN Market, by Communication Infrastructure, 2016-2028 (US$ Bn)
TABLE 50 Rest of Europe vRAN Market, by Connectivity, 2016-2028 (US$ Bn)
TABLE 51 Rest of Europe vRAN Market, by End User, 2016-2028 (US$ Bn)
TABLE 52 Asia Pacific vRAN Market, by Component, 2016-2028 (US$ Bn)
TABLE 53 Asia Pacific vRAN Market, by Communication Infrastructure, 2016-2028 (US$ Bn)
TABLE 54 Asia Pacific vRAN Market, by Connectivity, 2016-2028 (US$ Bn)
TABLE 55 Asia Pacific vRAN Market, by End User, 2016-2028 (US$ Bn)
TABLE 56 Asia Pacific vRAN Market, by Country, 2016-2028 (US$ Bn)
TABLE 57 China vRAN Market, by Component, 2016-2028 (US$ Bn)
TABLE 58 China vRAN Market, by Communication Infrastructure, 2016-2028 (US$ Bn)
TABLE 59 China vRAN Market, by Connectivity, 2016-2028 (US$ Bn)
TABLE 60 China vRAN Market, by End User, 2016-2028 (US$ Bn)
TABLE 61 Japan vRAN Market, by Component, 2016-2028 (US$ Bn)
TABLE 62 Japan vRAN Market, by Communication Infrastructure, 2016-2028 (US$ Bn)
TABLE 63 Japan vRAN Market, by Connectivity, 2016-2028 (US$ Bn)
TABLE 64 Japan vRAN Market, by End User, 2016-2028 (US$ Bn)
TABLE 65 India vRAN Market, by Component, 2016-2028 (US$ Bn)
TABLE 66 India vRAN Market, by Communication Infrastructure, 2016-2028 (US$ Bn)
TABLE 67 India vRAN Market, by Connectivity, 2016-2028 (US$ Bn)
TABLE 68 India vRAN Market, by End User, 2016-2028 (US$ Bn)
TABLE 69 South Korea vRAN Market, by Component, 2016-2028 (US$ Bn)
TABLE 70 South Korea vRAN Market, by Communication Infrastructure, 2016-2028 (US$ Bn)
TABLE 71 South Korea vRAN Market, by Connectivity, 2016-2028 (US$ Bn)
TABLE 72 South Korea vRAN Market, by End User, 2016-2028 (US$ Bn)
TABLE 73 South East Asia vRAN Market, by Component, 2016-2028 (US$ Bn)
TABLE 74 South East Asia vRAN Market, by Communication Infrastructure, 2016-2028 (US$ Bn)
TABLE 75 South East Asia vRAN Market, by Connectivity, 2016-2028 (US$ Bn)
TABLE 76 South East Asia vRAN Market, by End User, 2016-2028 (US$ Bn)
TABLE 77 Rest of Asia Pacific vRAN Market, by Component, 2016-2028 (US$ Bn)
TABLE 78 Rest of Asia Pacific vRAN Market, by Communication Infrastructure, 2016-2028 (US$ Bn)
TABLE 79 Rest of Asia Pacific vRAN Market, by Connectivity, 2016-2028 (US$ Bn)
TABLE 80 Rest of Asia Pacific vRAN Market, by End User, 2016-2028 (US$ Bn)
TABLE 81 Latin America vRAN Market, by Component, 2016-2028 (US$ Bn)
TABLE 82 Latin America vRAN Market, by Communication Infrastructure, 2016-2028 (US$ Bn)
TABLE 83 Latin America vRAN Market, by Connectivity, 2016-2028 (US$ Bn)
TABLE 84 Latin America vRAN Market, by End User, 2016-2028 (US$ Bn)
TABLE 85 Latin America vRAN Market, by Country, 2016-2028 (US$ Bn)
TABLE 86 Brazil vRAN Market, by Component, 2016-2028 (US$ Bn)
TABLE 87 Brazil vRAN Market, by Communication Infrastructure, 2016-2028 (US$ Bn)
TABLE 88 Brazil vRAN Market, by Connectivity, 2016-2028 (US$ Bn)
TABLE 89 Brazil vRAN Market, by End User, 2016-2028 (US$ Bn)
TABLE 90 Mexico vRAN Market, by Component, 2016-2028 (US$ Bn)
TABLE 91 Mexico vRAN Market, by Communication Infrastructure, 2016-2028 (US$ Bn)
TABLE 92 Mexico vRAN Market, by Connectivity, 2016-2028 (US$ Bn)
TABLE 93 Mexico vRAN Market, by End User, 2016-2028 (US$ Bn)
TABLE 94 Rest of Latin America vRAN Market, by Component, 2016-2028 (US$ Bn)
TABLE 95 Rest of Latin America vRAN Market, by Communication Infrastructure, 2016-2028 (US$ Bn)
TABLE 96 Rest of Latin America vRAN Market, by Connectivity, 2016-2028 (US$ Bn)
TABLE 97 Rest of Latin America vRAN Market, by End User, 2016-2028 (US$ Bn)
TABLE 98 Middle East and Africa vRAN Market, by Component, 2016-2028 (US$ Bn)
TABLE 99 Middle East and Africa vRAN Market, by Communication Infrastructure, 2016-2028 (US$ Bn)
TABLE 100 Middle East and Africa vRAN Market, by Connectivity, 2016-2028 (US$ Bn)
TABLE 101 Middle East and Africa vRAN Market, by End User, 2016-2028 (US$ Bn)
TABLE 102 Middle East and Africa vRAN Market, by Country, 2016-2028 (US$ Bn)
TABLE 103 GCC Countries vRAN Market, by Component, 2016-2028 (US$ Bn)
TABLE 104 GCC Countries vRAN Market, by Communication Infrastructure, 2016-2028 (US$ Bn)
TABLE 105 GCC Countries vRAN Market, by Connectivity, 2016-2028 (US$ Bn)
TABLE 106 GCC Countries vRAN Market, by End User, 2016-2028 (US$ Bn)
TABLE 107 South Africa vRAN Market, by Component, 2016-2028 (US$ Bn)
TABLE 108 South Africa vRAN Market, by Communication Infrastructure, 2016-2028 (US$ Bn)
TABLE 109 South Africa vRAN Market, by Connectivity, 2016-2028 (US$ Bn)
TABLE 110 South Africa vRAN Market, by End User, 2016-2028 (US$ Bn)
TABLE 111 Rest of Middle East and Africa vRAN Market, by Component, 2016-2028 (US$ Bn)
TABLE 112 Rest of Middle East and Africa vRAN Market, by Communication Infrastructure, 2016-2028 (US$ Bn)
TABLE 113 Rest of Middle East and Africa vRAN Market, by Connectivity, 2016-2028 (US$ Bn)
TABLE 114 Rest of Middle East and Africa vRAN Market, by End User, 2016-2028 (US$ Bn)

Frequently Asked Questions

How does COVID-19 impact the global vRAN market?

The spread of the Covid-19 pandemic is expected to drive the market demand for virtualized radio access networks (vRAN). The proliferation of Novel Coronavirus has increased the use of online channels and services.

Which is the leading region of the market for vRAN?

North America accounted for the most heightened share in the global vRAN market.

What are the key drivers for the global vRAN market growth?

The virtualized RAN (vRAN) market is anticipated to grow rapidly due to the rising adoption of digital technology, the proliferation of IoT-connected devices, and increasing data traffic.

Which is the major segment in the vRAN market by component?

The radio unit segment had a major share in the global market in 2021.

Which is the major segment in the vRAN market by connectivity?

The 5G segment had a major share in the global market.

Fingerprint Sensor Market

Published:
Report ID: 34098

LiDAR Market

Published:
Report ID: 12346

Digital Intraoral Sensor and Consumable Market

Published:
Report ID: 35017

Digital Photo Frame Market

Published:
Report ID: 34914

Gift Cards Market

Published:
Report ID: 6518

Cooling Towers Market

Published:
Report ID: 4381

Virtual Reality (VR) Market

Published:
Report ID: 11345

Identity And Access Management (IAM) Market

Published:
Report ID: 6005

Smart Grid Managed Services Market

Published:
Report ID: 10208

Picture Archiving and Communication Systems (PACS) Market

Published:
Report ID: 9676

Chatbots Market

Published:
Report ID: 3733

Over-the-Top (OTT) Market

Published:
Report ID: 8377

Purchase Options

$2999
Delivery Format: Excel.
$4999
Designed for the individual purchaser.
$6999
Users located at a single corporate site or regional office.
$7999
Allowed for unlimited sharing globally within one company.
Smallform of Sample request

Have a question?

User Profile

Don’t settle for less – trust Mitul to help you find the best solution.

Report delivery within 24 to 48 hours

– Other Info –

What people say?-

User Review

I am very impressed with the information in this report. The author clearly did their research when they came up with this product and it has already given me a lot of ideas.

Jana Schmidt
CEDAR CX Technologies

– Connect with us –

Phone

+91 6232 49 3207


support

24/7 Research Support


sales@credenceresearch.com

– Research Methodology –

Going beyond the basics: advanced techniques in research methodology

– Trusted By –

Pepshi, LG, Nestle
Motorola, Honeywell, Johnson and johnson
LG Chem, SIEMENS, Pfizer
Unilever, Samsonite, QIAGEN