
1,3-Diphenylguanidine Market Overview:
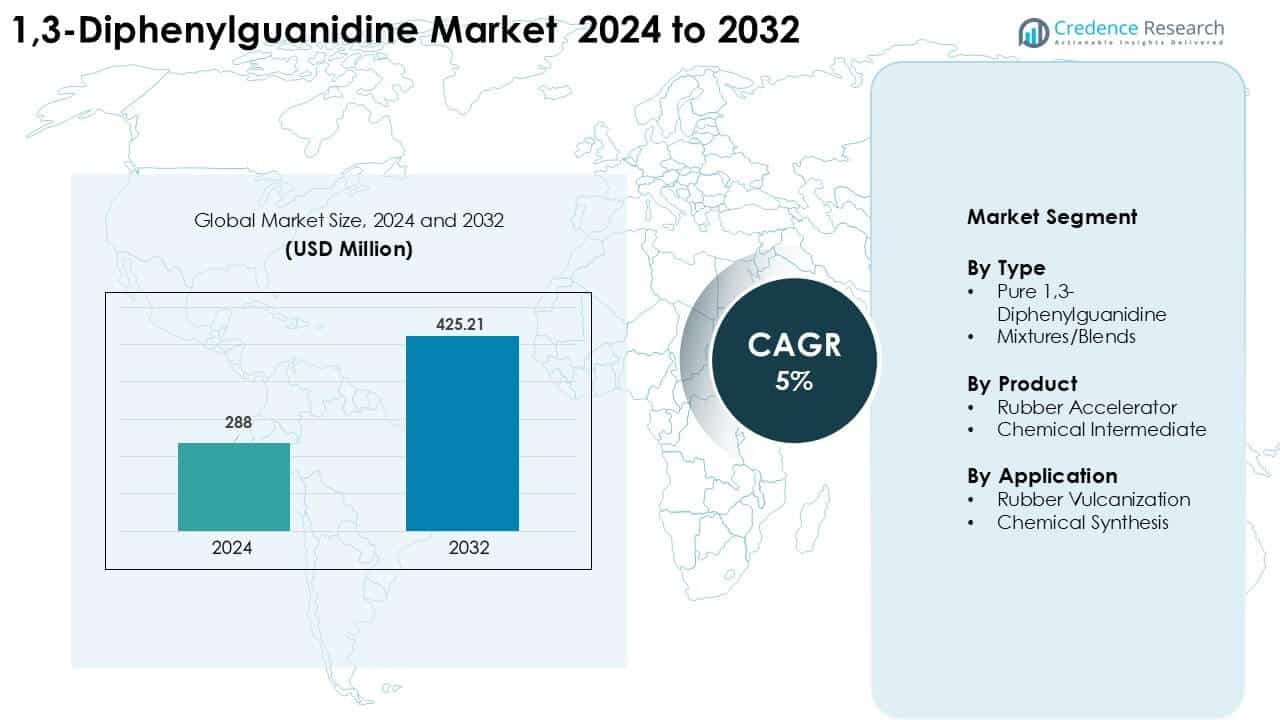
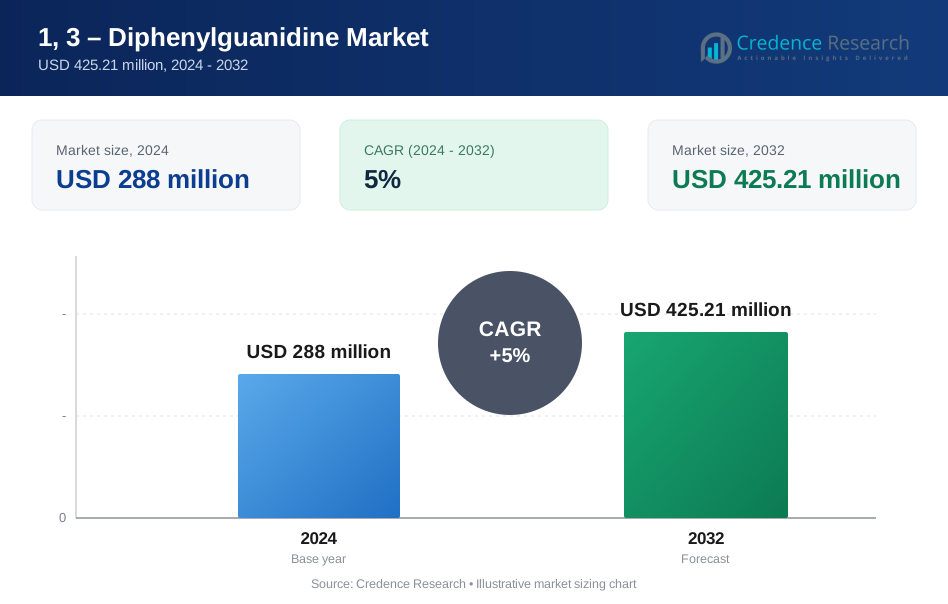
1,3-Diphenylguanidine Market was valued at USD 288 million in 2024 and is anticipated to reach USD 425.21 million by 2032, growing at a CAGR of 5% during the forecast period.
| REPORT ATTRIBUTE | DETAILS |
|---|---|
| Historical Period | 2020-2023 |
| Base Year | 2024 |
| Forecast Period | 2025-2032 |
| 1,3-Diphenylguanidine Market Size 2024 | USD 288 million |
| 1,3-Diphenylguanidine Market, CAGR | 5% |
| 1,3-Diphenylguanidine Market Size 2032 | USD 425.21 million |
1,3-Diphenylguanidine Market Insights
- Growing demand from tire manufacturing and industrial rubber goods drives strong consumption, supported by rising adoption of high-performance vulcanization accelerators.
- Key trends include a shift toward high-purity grades, increased use in advanced rubber formulations, and opportunities linked to EV tire production and sustainable rubber technologies.
- The competitive landscape includes Sigma-Aldrich Corporation, Xiamen Aeco Chemical Industrial, Sumitomo Chemical Co., Ltd., TCI AMERICA, Alfa Aesar, Arkema, LANXESS, and Haihang Industry Co., Ltd., with competition centered on purity, compliance, and supply reliability.
- Asia-Pacific leads with 39% share, while rubber vulcanization holds the largest segment share at 77%, followed by rubber accelerator products dominating with 71% share across global markets.
1,3-Diphenylguanidine Market Segmentation Analysis:
By Type
Pure 1,3-diphenylguanidine leads the type segment with about 62% share in 2024. Demand rises due to high purity levels that support consistent performance in rubber compounding and industrial formulations. Manufacturers prefer pure grades for stable activation behavior in sulfur-based systems. Mixtures or blends serve cost-focused applications but show slower growth because they offer lower activation efficiency. Rising adoption of high-performance tires and quality-driven rubber goods continues to strengthen demand for pure 1,3-diphenylguanidine across global production hubs.
- For instance, Draslovka as supplies Denax DPG grades with a minimum purity of 96.5 for accelerator use in thick rubber articles with formulation data showing ash content at 0.4 or less and melting point above 144 C enhancing cure performance in natural and synthetic rubber applications.
By Product
Rubber accelerator dominates the product segment with nearly 71% share in 2024. Usage stays high due to its role as a secondary accelerator in tire, conveyor belt, and industrial rubber production. Strong compatibility with thiazoles and sulfenamides drives wider adoption in complex curing systems. Chemical intermediates gain modest traction in specialty synthesis, but their demand remains limited compared to large-volume rubber applications. Growth in automotive and heavy-duty rubber manufacturing supports long-term momentum for rubber accelerator products.
- For instance, China Sunsine Chemical’s rubber accelerator production capacity includes 117,000 tonnes of rubber accelerators per year within its 254,000 tonnes total annual capacity, supplying accelerator products to more than 45 major tire producers worldwide, which supports consistent supply for large-scale tire and industrial rubber manufacturing.
By Application
Rubber vulcanization remains the leading application with around 77% share in 2024. Producers depend on 1,3-diphenylguanidine to boost curing speed, enhance tensile strength, and improve heat resistance in rubber compounds. Expansion of tire plants and rising use of performance rubber in industrial goods further lift demand. Chemical synthesis applications grow at a smaller scale, serving niche organic intermediates and fine chemicals. Strong global tire replacement cycles and industrial rubber output continue to drive the dominance of vulcanization use.
Key Growth Drivers
Growing Demand from the Rubber Manufacturing Industry
Global rubber production growth drives strong demand for 1,3-diphenylguanidine, as manufacturers rely on the compound to improve curing speed, tensile strength, and heat resistance in tires and industrial rubber goods. Rising automotive output strengthens consumption because producers seek accelerators that support high-performance and energy-efficient tire designs. The expansion of conveyor belts, hoses, gaskets, and sealing products in construction, mining, and heavy engineering adds further momentum. Adoption of advanced sulfur-based vulcanization systems also increases reliance on activators that deliver consistent and predictable results. As tire plants scale capacity across Asia and Latin America, the need for stable accelerator performance continues to rise.
- For instance, DPG is a cornerstone accelerator in rubber chemicals, widely used in the tire and general rubber products industries globally.
Increasing Use in High-Performance Rubber Formulations
Growth in specialty rubber applications boosts demand for 1,3-diphenylguanidine due to its strong activation profile in complex curing systems. Producers of heavy-duty tires, automotive components, and technical rubber goods require accelerators that support durability, flexibility, and wear resistance. The material’s compatibility with thiazoles and sulfenamides makes it a preferred choice in multi-accelerator blends used for premium compounds. Rising adoption of high-temperature rubber designs for electric vehicles and industrial machinery further expands its use. As manufacturers shift toward cleaner and more efficient curing systems, demand strengthens for accelerators offering improved control and predictable reaction kinetics.
- For instance, Eastman Chemical Company did own the Santoflex product line, which included antidegradants used in tires, as well as a DPG (Diphenylguanidine) rubber accelerator business.
Expansion of Industrial and Chemical Applications
Broader use of 1,3-diphenylguanidine as a chemical intermediate supports market growth outside the rubber sector. Its role in synthesizing specialty chemicals, agrochemical precursors, and fine-chemical intermediates expands demand among chemical producers seeking stable and reactive guanidine derivatives. Growth in small-scale custom manufacturing also increases its adoption in controlled synthesis environments. Rising investments in specialty and performance chemicals across Asia-Pacific drive further consumption. Although rubber remains the largest market, diversification into niche synthesis applications provides steady incremental growth. Strong interest in tailored chemical formulations helps reinforce the long-term outlook for 1,3-diphenylguanidine.
Key Trends & Opportunities
Shift Toward High-Purity and Low-Toxicity Grades
Producers across rubber and chemical industries prefer high-purity 1,3-diphenylguanidine to ensure consistent activation behavior and reduced impurity levels. Demand rises for cleaner formulations aligned with tightening workplace safety rules and global chemical management standards. Growth in export-oriented rubber production also accelerates the transition toward controlled and low-toxicity accelerator grades. Manufacturers introduce improved purification and production systems to meet the quality needs of advanced rubber compounds. This trend supports stronger long-term adoption of premium-grade materials.
- For instance, producers such as Richon-Chem offer 1,3-diphenylguanidine with a purity of 99.99% for use in sensitive rubber compounding, reflecting industry demand for precise activation profiles and minimal impurities.
Growing Opportunities in EV and Sustainable Rubber Technologies
Electric vehicle growth creates major opportunities for 1,3-diphenylguanidine producers because EV tires require improved heat resistance, load capacity, and compound stability. Accelerators that support uniform curing gain preference in next-generation tire designs. Sustainability programs push manufacturers to optimize curing efficiency and reduce waste, increasing dependence on accelerators that deliver predictable performance. The rise of bio-based and recyclable rubber systems also encourages experimentation with compatible accelerator blends. These shifts open new pathways for product innovation and market expansion.
- For instance, Lanxess Rhein Chemie business unit supplies DPG-based chemical solutions tailored for high-performance tire manufacturers across Germany, Brazil, and China, addressing advanced curing requirements in EV tire production with standardized product portfolios.
Key Challenges
Environmental and Regulatory Compliance Pressure
Stricter chemical safety regulations create challenges for producers of 1,3-diphenylguanidine due to monitoring requirements, classification updates, and handling guidelines. Manufacturers must adjust production, labeling, and storage processes to meet global compliance frameworks such as REACH and OSHA. These regulations increase operational complexity and raise compliance costs, especially for smaller chemical producers. Limitations on hazardous substance exposure in workplaces push companies to adopt safer formulations, leading to pressure for continuous product reformulation. Such compliance burdens may constrain growth in some regions.
Volatility in Raw Material Supply and Production Costs
Price instability in aniline and related aromatic intermediates affects the cost structure of 1,3-diphenylguanidine producers. Fluctuations in feedstock availability, energy prices, and supply chain logistics add uncertainty to manufacturing operations. Producers face difficulty maintaining stable margins, especially during periods of tight supply or geopolitical disruption. Sharp cost variations may reduce the competitiveness of smaller suppliers and shift procurement strategies among rubber manufacturers. These challenges increase the need for supply diversification, capacity planning, and long-term sourcing agreements.
Regional Analysis
North America
North America holds about 23% share in the 1,3-diphenylguanidine market in 2024, supported by strong demand from tire manufacturing, automotive replacement parts, and industrial rubber goods. Growth in construction, mining, and logistics industries boosts use in conveyor belts, hoses, and sealing materials. The region benefits from advanced compounding technologies and strict performance standards that favor high-purity accelerator grades. Expanding EV adoption strengthens demand for high-performance rubber formulations. Ongoing investments in specialty chemical production also support steady consumption across the United States and Canada.
Europe
Europe accounts for nearly 27% share in 2024, driven by mature automotive manufacturing, advanced material regulations, and strong production of premium tire brands. Strict EU chemical standards encourage the use of controlled, high-quality accelerator grades, boosting demand for 1,3-diphenylguanidine in rubber vulcanization. Growth in industrial machinery, off-road vehicles, and engineered rubber systems enhances market expansion. The region also benefits from high export activity in specialty rubber compounds. Sustainability goals and the shift toward energy-efficient tire designs further support long-term adoption across major European manufacturing hubs.
Asia-Pacific
Asia-Pacific leads the global market with about 39% share in 2024, supported by large-scale tire production, rapid industrialization, and expanding automotive manufacturing in China, India, Japan, and Southeast Asia. The region’s strong rubber goods export base creates consistent demand for accelerators that enhance curing efficiency and mechanical strength. Growing investments in new tire plants and technical rubber facilities reinforce its leadership position. Lower production costs and high raw material availability attract global manufacturers. Rising EV penetration and expansion in construction and mining industries accelerate long-term growth across regional markets.
Latin America
Latin America captures around 7% share in 2024, driven by increasing automotive aftermarket demand, expanding industrial rubber applications, and local tire production capacity in Brazil and Mexico. Growth in mining, agriculture, and heavy machinery sectors boosts consumption of conveyor belts, hoses, and sealing components that rely on efficient vulcanization accelerators. Regional manufacturers gradually shift toward higher-purity grades to meet quality and export standards. Although the market remains smaller than major regions, rising infrastructure and manufacturing investments support steady adoption of 1,3-diphenylguanidine.
Middle East & Africa
Middle East & Africa represent approximately 4% share in 2024, driven by growing industrial activity, construction expansion, and rising demand for heavy-duty rubber products. Increased mining operations in Africa and infrastructure development in GCC countries support the need for advanced rubber formulations using 1,3-diphenylguanidine. Tire manufacturing presence remains limited but gradually expands through import substitution initiatives. Rising adoption of industrial hoses, belts, and sealing materials supports consistent demand. Although growth is moderate, improving chemical production capabilities and industrial diversification encourage future market development.
1,3-Diphenylguanidine Market Segmentations:
By Type
- Pure 1,3-Diphenylguanidine
- Mixtures/Blends
By Product
- Rubber Accelerator
- Chemical Intermediate
By Application
- Rubber Vulcanization
- Chemical Synthesis
By Geography
- North America
- U.S.
- Canada
- Mexico
- Europe
- Germany
- France
- U.K.
- Italy
- Spain
- Rest of Europe
- Asia Pacific
- China
- Japan
- India
- South Korea
- South-east Asia
- Rest of Asia Pacific
- Latin America
- Brazil
- Argentina
- Rest of Latin America
- Middle East & Africa
- GCC Countries
- South Africa
- Rest of the Middle East and Africa
Competitive Landscape
The competitive landscape of the 1,3-diphenylguanidine market features a mix of global chemical producers and specialized suppliers focused on rubber additives and fine-chemical intermediates. Companies such as Sigma-Aldrich Corporation, Xiamen Aeco Chemical Industrial, Sumitomo Chemical Co., Ltd, TCI AMERICA, Alfa Aesar, Arkema, LANXESS, and Haihang Industry Co., Ltd compete by enhancing product purity, supply reliability, and technical support for rubber manufacturers. Many firms expand production capabilities to meet rising demand from tire and industrial rubber sectors, while others strengthen portfolios through improved synthesis technologies and stricter quality control. Strategic partnerships with rubber compounders and distributors help secure long-term demand, especially in Asia-Pacific. Growing interest in safer and cleaner accelerator grades also drives investments in optimized manufacturing processes. The market remains moderately competitive, with differentiation driven by consistency, regulatory compliance, and global distribution reach.
Key Player Analysis
- Sigma-Aldrich Corporation
- Xiamen Aeco Chemical Industrial
- Sumitomo Chemical Co., Ltd
- TCI AMERICA
- Alfa Aesar
- Arkema
- LANXESS
- Haihang Industry Co., Ltd
Recent Developments
- In December 2025, Haihang Industry was identified as a key manufacturer in Infinity Market Research s Global 1, 3–Diphenylguanidine Market Growth 2025–2031 study, which profiles principal DPG suppliers worldwide. In parallel, Haihang s Chinese catalog continues to list 1,3-Diphenylguanidine (CAS 102-06-7) as an off-white powder with defined molecular specifications, reflecting its ongoing commercial focus on this accelerator.
- In December 2024, Thermo Fisher Scientific’s Alfa Aesar brand released an updated Certificate of Analysis for its 1,3-Diphenylguanidine (catalog A15234, lot 10253237). The COA confirms 99.8 assay by titration and a 146.3–148.3 °C melting range, reinforcing quality control and ongoing supply of research-grade DPG to laboratories and rubber additive users.
- In January 2024, Arkema, through its MLPC International business, updated the MIXLAND polymer-bound accelerator product list (Issue 73). The list reconfirms DPG 80 GA F140 (1,3-Diphenylguanidine) as a nitrosamine-free, pigment-coded masterbatch with standardized packaging for tire and technical rubber applications, supporting safer and more efficient vulcanization processes.
Report Coverage
The research report offers an in-depth analysis based on Type, Product, Application and Geography. It details leading market players, providing an overview of their business, product offerings, investments, revenue streams, and key applications. Additionally, the report includes insights into the competitive environment, SWOT analysis, current market trends, as well as the primary drivers and constraints. Furthermore, it discusses various factors that have driven market expansion in recent years. The report also explores market dynamics, regulatory scenarios, and technological advancements that are shaping the industry. It assesses the impact of external factors and global economic changes on market growth. Lastly, it provides strategic recommendations for new entrants and established companies to navigate the complexities of the market.
Future Outlook
- Demand for high-performance rubber accelerators will rise with expanding tire production.
- EV tire development will increase the need for advanced curing activators.
- Manufacturers will invest in higher-purity grades to meet stricter quality standards.
- Regulatory pressure will push companies to enhance chemical safety and compliance.
- Asia-Pacific will continue to dominate due to strong industrial and automotive growth.
- Use in specialty chemicals and intermediates will expand gradually.
- Automation in rubber compounding will boost demand for consistent accelerator performance.
- Supply chain diversification will become a priority for chemical producers.
- Sustainability goals will drive innovation in cleaner and safer accelerator formulations.
- Global market competition will intensify as more suppliers expand capacity and reach.
Request a Free Sample
Fill in your details and we'll send you a free sample report.
- Sample data tables & charts
- Research methodology
Need a Custom Version of This Report?
Tailor the scope, geography, or segments to your exact requirements.
- Custom geography or segment scope
- Direct access to our analyst team
Frequently Asked Questions
What is the current market size for 1,3-Diphenylguanidine Market, and what is its projected size in 2032?
At what Compound Annual Growth Rate is 1,3-Diphenylguanidine Market projected to grow between 2024 and 2032?
Which 1,3-Diphenylguanidine Market segment held the largest share in 2024?
What are the primary factors fueling the growth of 1,3-Diphenylguanidine Market?
Who are the leading companies in 1,3-Diphenylguanidine Market?
Which region commanded the largest share of 1,3-Diphenylguanidine Market?
Table of Content
Chapter 1. Report Introduction
- 1.1 Report Description & Purpose
- 1.1.1 Report Title & Market Definition
- 1.1.2 Unique Selling Propositions (USP) & Key Differentiators
- 1.1.3 Value Proposition for Stakeholders
- 1.2 Research Objectives
- 1.2.1 Market Sizing Objectives (Volume & Revenue)
- 1.2.2 Segmentation Objectives
- 1.2.3 Competitive Intelligence Objectives
- 1.2.4 Forecast & Scenario Objectives
- 1.3 Report Scope
- 1.3.1 1, 3 – Diphenylguanidine Scope – Types & Subtypes Covered
- 1.3.2 Geographic Scope – Regions & Countries Covered
- 1.3.3 Historical Period, Base Year & Forecast Period (2024; forecast to 2032)
- 1.3.4 Inclusions & Exclusions
- 1.4 HS Code & Classification Framework
- 1.5 Currency, Units & Pricing Basis
- 1.6 Target Stakeholders
- 1.7 Limitations & Assumptions
Chapter 2. Executive Summary
- 2.1 Global 1, 3 – Diphenylguanidine Market Snapshot
- 2.1.1 Market Size – Historical (2024) & Forecast (2024-2032) (2024: USD 288 million → 2032: USD 425.21 million)
- 2.1.2 Volume & Revenue – Global Totals
- 2.1.3 Key Market Highlights – Top Five Facts
- 2.2 1, 3 – Diphenylguanidine Market Segmentation Snapshot
- 2.2.1 Market Split by Region – 2024 vs. 2032
- 2.3 Competitive Snapshot
- 2.3.1 Top 10 Players by Revenue Share – 2024
- 2.3.2 Top 10 Players by Volume Share – 2024
- 2.3.3 Recent Strategic Developments (18-Month Summary)
- 2.4 Key Investment Highlights & Strategic Conclusions
Chapter 3. 1, 3 – Diphenylguanidine Market Dynamics & Industry Analysis
- 3.1 Market Overview & Context
- 3.1.1 1, 3 – Diphenylguanidine Market Position in the Broader Automotive Value Chain
- 3.1.2 OEM vs. Replacement Market Dynamics
- 3.1.3 Market Maturity & Development Stage by Region
- 3.2 1, 3 – Diphenylguanidine Market Drivers
- 3.3 1, 3 – Diphenylguanidine Market Restraints & Challenges
- 3.4 1, 3 – Diphenylguanidine Market Opportunities
- 3.5 Porter's Five Forces Analysis
- 3.5.1 Threat of New Entrants
- 3.5.2 Bargaining Power of Suppliers
- 3.5.3 Bargaining Power of Buyers
- 3.5.4 Threat of Substitutes
- 3.5.5 Competitive Rivalry – Intensity Assessment
- 3.6 1, 3 – Diphenylguanidine Value Chain Analysis
- 3.6.1 Upstream – Raw Material/Input Suppliers
- 3.6.1.1 Raw Material/Input 1
- 3.6.1.2 Raw Material/Input 2
- 3.6.1.3 Raw Material/Input 3
- 3.6.2 Midstream – Production/Manufacturing/Service Delivery
- 3.6.2.1 Production/Process Overview
- 3.6.2.2 Key Facility Locations & Capacity by Manufacturer
- 3.6.3 Downstream – Distribution & End Consumer
- 3.6.3.1 Primary Channel – B2B/OEM
- 3.6.3.2 Secondary Channels – Dealer, Retail, Online, Direct
- 3.6.4 Value Chain Profitability Analysis
- 3.6.1 Upstream – Raw Material/Input Suppliers
- 3.7 PESTEL Analysis
- 3.7.1 Political Factors
- 3.7.2 Economic Factors
- 3.7.3 Social Factors
- 3.7.4 Technological Factors
- 3.7.5 Environmental Factors
- 3.7.6 Legal Factors
- 3.8 1, 3 – Diphenylguanidine Supply Chain Analysis
- 3.8.1 Raw Material/Input Supply Risk Assessment
- 3.8.2 Manufacturing Concentration Risk (Geographic Exposure)
- 3.8.3 Trade Disruption Impact Analysis
- 3.9 Regulatory & Policy Landscape
Note: The regulatory and policy landscape section covers regulations based on their applicability to the market, 1, 3 – Diphenylguanidine category, geography, and scope of the study. Only regulatory frameworks with a material impact on operations, compliance, trade, sustainability, or market access are analyzed in detail.
Chapter 4. Key Investment Pockets & Opportunity Analysis
- 4.1 1, 3 – Diphenylguanidine Market Attractiveness Analysis
- 4.1.1 By Region – Investment Attractiveness Matrix (Volume × CAGR)
- 4.2 Absolute Revenue Growth Opportunity
- 4.2.1 By Region – Absolute USD Growth Through 2032
- 4.3 Incremental Volume Opportunity
- 4.3.1 By Region – Incremental Volume Through 2032
- 4.3.2 Segment – Incremental Volume
- 4.4 Emerging Submarket Opportunity Deep Dive (Subject to Applicability)
- 4.5 Emerging Market Opportunity Scorecards
- 4.5.1 United States
- 4.5.2 Europe
- 4.5.3 Asia
- 4.5.4 Middle East & Africa
Note: Emerging Market Opportunity Scorecards will be included based on relevance and strategic importance. Regions listed are indicative and may vary depending on data availability and market dynamics.
Chapter 5. 1, 3 – Diphenylguanidine Import-Export Analysis & Trade Flows
- 5.1 Global Trade Overview
- 5.1.1 Global Export Value by Country (2024)
- 5.1.2 Global Export Volume by Country (2024)
- 5.1.3 Global Import Value by Country (2024)
- 5.1.4 Global Import Volume by Country (2024)
- 5.1.5 Net Trade Balance by Country (2024)
- 5.2 Export Analysis – Segment
- 5.2.1 Type 1 (HS Code)
- 5.2.2 Type 2 (HS Code)
- 5.2.3 Type 3 (HS Code)
- 5.2.4 Type 4 (HS Code)
- 5.2.5 Type 5 (HS Code)
- 5.3 Import Analysis – Segment
- 5.3.1 Type 1 (HS Code)
- 5.3.2 Type 2 (HS Code)
- 5.3.3 Type 3 (HS Code)
- 5.3.4 Type 4 (HS Code)
- 5.3.5 Type 5 (HS Code)
- 5.4 Average Unit Trade Prices
- 5.4.1 Average Export Price – Segment & Country
- 5.4.2 Average Import Price – Segment & Source Country
- 5.4.3 Price Trends (2024)
- 5.5 Key Trade Route Analysis
- 5.5.1 Trade Route 1
- 5.5.2 Trade Route 2
- 5.5.3 Trade Route 3
- 5.5.4 Trade Route 4
- 5.5.5 Trade Route 5
- 5.6 Trade Policy Impact Assessment
- 5.6.1 US Anti-Dumping & Section 301 Tariffs
- 5.6.2 EU Customs Union Impact
- 5.6.3 Major Free Trade Agreements
- 5.6.4 USMCA Rules of Origin
Note: Trade policy analysis will be included only where relevant to the 1, 3 – Diphenylguanidine market.
Chapter 6. Competitive Landscape & Company Benchmarking
- 6.1 1, 3 – Diphenylguanidine Market Concentration & Structure
- 6.1.1 Herfindahl-Hirschman Index (HHI) – vs. 2024
- 6.1.2 Tier 1, Tier 2 & Tier 3 Market Structure
- 6.1.3 Global, Regional & Local Player Dynamics
- 6.2 1, 3 – Diphenylguanidine Market Share Analysis – 2024
- 6.2.1 Global Revenue Share by Company
- 6.2.2 Global Volume Share by Company
- 6.2.3 Regional Revenue Share
- 6.2.4 Market Share Evolution ( vs. 2024)
- 6.2.5 OEM Segment Share by Company
- 6.2.6 Replacement Segment Share by Company
- 6.3 Production/Delivery Capacity & Facility Analysis
- 6.3.1 Global Installed Capacity
- 6.3.2 Capacity Utilization Rates
- 6.3.3 Production/Output Volume
- 6.3.4 Facility Locations & Capacity Map
- 6.3.5 Planned Capacity Additions
- 6.4 1, 3 – Diphenylguanidine Competitive Benchmarking Matrix
- 6.4.1 Revenue, Volume, CAGR & Profitability Comparison
- 6.4.2 Channel Revenue Mix
- 6.4.3 Geographic Revenue Exposure
- 6.4.4 R&D Intensity
- 6.4.5 Sustainability Maturity
- 6.5 Strategic Developments in 1, 3 – Diphenylguanidine (Last 24 Months)
- 6.5.1 Mergers, Acquisitions & Divestments
- 6.5.2 New 1, 3 – Diphenylguanidine Launches
- 6.5.3 Facility Expansions
- 6.5.4 Strategic Alliances, Joint Ventures & Partnerships
- 6.5.5 Distribution Expansion & Market Entry
- 6.5.6 Sustainability & ESG Initiatives
- 6.6 Competitive Strategy Mapping
- 6.6.1 Leader, Challenger, Follower & Niche Classification
- 6.6.2 Pricing Strategy Comparison
- 6.6.3 Channel Strategy Matrix
Note: Strategic developments are included based on their materiality and the availability of reliable information.
Chapter 7. Global 1, 3 – Diphenylguanidine Market – By Distribution Channel
- 7.1 Segment Overview
- 7.1.1 Volume & Revenue Split by Channel (2024 & 2032)
- 7.1.2 Channel Mix Evolution (2024-2032)
Chapter 8. Regional Market Analysis – Global Overview
- 8.1 Global Regional Overview
- 8.1.1 Regional Volume Share
- 8.1.2 Regional Revenue Share
- 8.1.3 Regional Volume by Region
- 8.1.4 Regional Revenue by Region
- 8.1.5 Regional Forecast Through 2032
- 8.2 Cross-Regional Segment Analysis
- 8.2.1 By Distribution Channel
- 8.2.2 By Brand/Price Tier
Chapter 9. North America 1, 3 – Diphenylguanidine Market
- 9.1 United States
- 9.2 Canada
- 9.3 Mexico
Chapter 10. Europe 1, 3 – Diphenylguanidine Market
- 10.1 Germany
- 10.2 France
- 10.3 Italy
- 10.4 United Kingdom
- 10.5 Spain
- 10.6 Poland
- 10.7 Russia
- 10.8 Netherlands
- 10.9 Belgium
- 10.10 Sweden
- 10.11 Denmark
- 10.12 Norway
- 10.13 Rest of Europe
Chapter 11. Asia Pacific 1, 3 – Diphenylguanidine Market
- 11.1 China
- 11.2 India
- 11.3 Japan
- 11.4 South Korea
- 11.5 Thailand
- 11.6 Indonesia
- 11.7 Vietnam
- 11.8 Malaysia
- 11.9 Australia
- 11.10 Rest of Asia Pacific
Chapter 12. Latin America 1, 3 – Diphenylguanidine Market
- 12.1 Brazil
- 12.2 Argentina
- 12.3 Colombia
- 12.4 Chile
- 12.5 Rest of Latin America
Chapter 13. Middle East 1, 3 – Diphenylguanidine Market
- 13.1 Saudi Arabia
- 13.2 United Arab Emirates
- 13.3 Turkey
- 13.4 Israel
- 13.5 Iran
- 13.6 Rest of the Middle East
Chapter 14. Africa 1, 3 – Diphenylguanidine Market
- 14.1 South Africa
- 14.2 Egypt
- 14.3 Nigeria
- 14.4 Morocco
- 14.5 Rest of Africa
Chapter 15. 1, 3 – Diphenylguanidine Company Profiles
- 15.1 [Company 01]
- 15.1.1 Company Overview
- 15.1.2 Key Management Personnel
- 15.1.3 Products & Services Portfolio
- 15.1.4 Financial Performance
- 15.1.5 Key Market Focus & Geographic Presence
- 15.1.6 Recent Developments & Strategic Initiatives
Note: The company profile list is preliminary and may change based on research findings, market developments, data availability, and client requirements.
Chapter 16. Appendices
- Appendix A – List of Abbreviations & Acronyms
- Appendix B – Industry Classification Code Reference – Full Series
- Appendix C – Production & Capacity Data Tables
- Appendix D – End-Use & Demand Base Tables
- Appendix E – Consumption & Replacement Rate Assumptions
- Appendix F – ASP Reference Tables
- Appendix G – Manufacturing & Facility Database
- Appendix H – Import-Export Data Tables
- Appendix I – Regulatory Summary Tables
- Appendix J – Primary Research Participant List (Anonymized)
- Appendix K – Primary Research Questionnaire Framework
- Appendix L – Data Sources & Bibliography
- Appendix M – Market Size Divergence & Source Comparison
Chapter 17. Research Methodology
- 17.1 Research Framework & Philosophy
- 17.2 Secondary Research – Sources, Hierarchy & Data Extraction
- 17.3 Data Modeling – Bottom-Up & Top-Down Market Sizing
- 17.4 Primary Research – Stakeholder Framework, LOI & Sample Sizes
- 17.5 Forecast Methodology – Regression, Scenario & Sensitivity Analysis
- 17.6 Quality Control – Four-Layer Validation Framework
- 17.7 Limitations & Standard Assumptions
- 17.8 Disclaimer
