Market Overview:
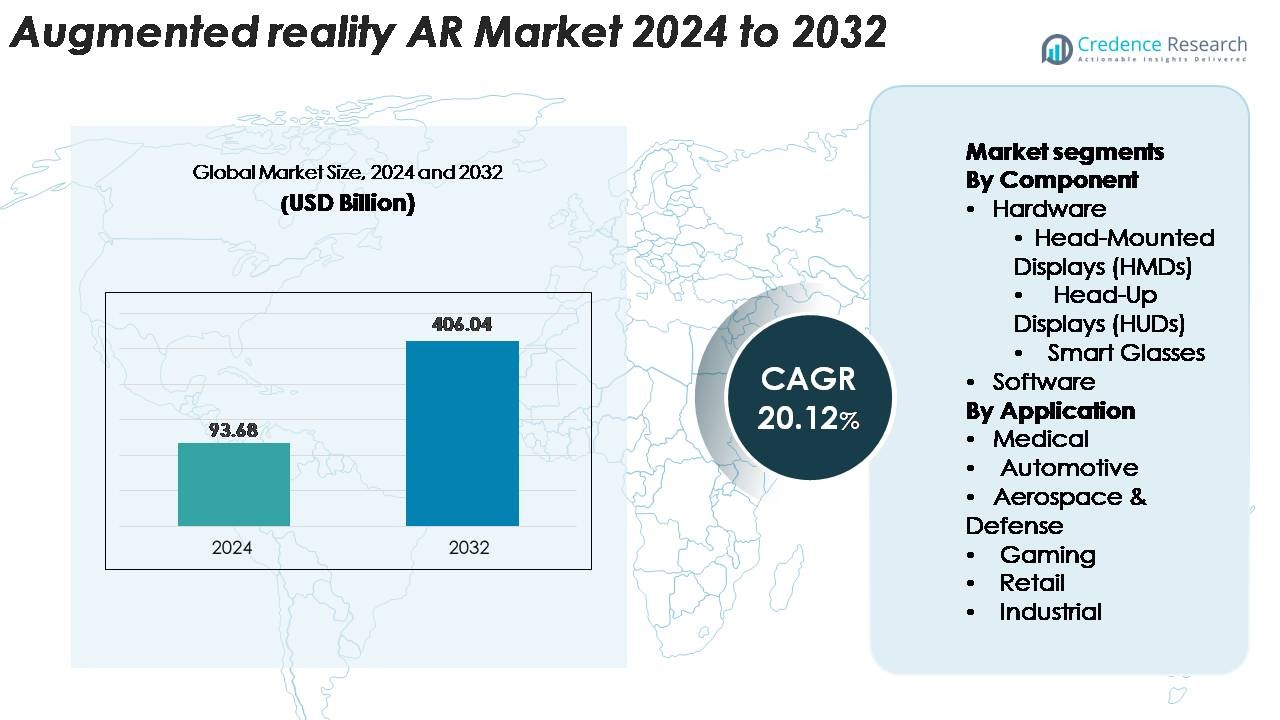
The Augmented Reality (AR) market was valued at USD 93.68 billion in 2024 and is anticipated to reach USD 406.04 billion by 2032, growing at a CAGR of 20.12% during the forecast period.”
| REPORT ATTRIBUTE |
DETAILS |
| Historical Period |
2020-2023 |
| Base Year |
2024 |
| Forecast Period |
2025-2032 |
| Augmented Reality (AR) Market Size 2024 |
USD 93.68 Billion |
| Augmented Reality (AR) Market, CAGR |
20.12% |
| Augmented Reality (AR) Market Size 2032 |
USD 406.04 Billion |
The augmented reality market is shaped by strong competition among leading technology innovators such as Google Inc., Magic Leap, Qualcomm, HTC Corporation, Blippar, Microsoft Corporation, Daqri, Apple Inc., Marxent Labs, LLC, Facebook Inc., and Wikitude GmbH. These companies drive advancements in optical engines, lightweight headsets, spatial computing platforms, and AI-enhanced AR applications for enterprise and consumer use. North America leads the global market with an approximate 38% share, supported by intensive R&D activity, advanced 5G deployment, and early enterprise adoption across manufacturing, healthcare, and defense. Asia-Pacific follows closely, driven by strong hardware production and rapidly expanding consumer applications.
Access crucial information at unmatched prices!
Request your sample report today & start making informed decisions powered by Credence Research Inc.!
Download Sample
Market Insights:
- The Augmented Reality (AR) market reached USD 93.68 billion in 2024 and is projected to hit USD 406.04 billion by 2032, advancing at a 20.12% CAGR.
- Strong market drivers include enterprise digital transformation, rising adoption of AR-guided training and remote assistance, and rapid consumer uptake across gaming, retail visualization, and social media experiences.
- Key trends involve AI-enhanced spatial computing, lightweight optical hardware innovations, and the growing use of AR in automotive HUDs, medical visualization, and industrial workflows; HMDs remain the dominant component segment with the largest share.
- Competitive intensity rises as major players expand device ecosystems and software capabilities, while restraints include high hardware costs, limited battery efficiency, and integration complexity across legacy enterprise systems.
- Regionally, North America leads with ~38% share, followed by Asia-Pacific at ~30% and Europe at ~24%, supported by strong R&D investment, large consumer bases, and accelerating enterprise adoption.
Market Segmentation Analysis:
By Component
Hardware remains the dominant component segment, accounting for the largest share of the AR market due to widespread adoption of head-mounted displays (HMDs) across gaming, industrial training, and medical visualization. HMDs lead the hardware category with the highest market share, driven by increasing deployment of advanced optical engines, improved field-of-view systems, and lightweight form factors. Smart glasses continue gaining traction in enterprise workflows, while head-up displays expand in automotive safety applications. Software demand grows steadily as AR development platforms, spatial computing engines, and visualization frameworks enable more immersive and interactive experiences.
- For instance, Microsoft’s HoloLens 2 integrates a 52-degree diagonal field of view, a 2k 3:2 light engine per eye, and a full 6-DoF tracking system powered by four visible-light cameras, enabling highly precise enterprise-grade visualization.
By Application
Gaming represents the dominant application segment with the highest market share, supported by rapid integration of immersive 3D content, multiplayer AR environments, and real-time spatial interaction. Automotive and aerospace & defense sectors increasingly adopt AR for maintenance training, pilot assistance, and real-time situational awareness. In healthcare, AR enhances surgical planning, remote collaboration, and patient diagnostics. Retailers deploy AR try-on and visualization tools to elevate customer engagement. Industrial users rely on AR for assembly guidance, remote support, and quality inspection, driven by efficiency gains and reduced operational errors.
- For instance, Niantic’s Lightship Visual Positioning System (VPS) delivers sub-5-centimeter localization accuracy across more than 100,000 mapped locations worldwide, enabling highly stable AR gaming interactions.
KEY GROWTH DRIVERS
Rapid Expansion of Enterprise AR for Productivity and Workforce Enablement
Enterprise adoption of AR continues to accelerate as organizations prioritize operational efficiency, workforce upskilling, and real-time collaboration. Manufacturers use AR-guided instructions for assembly, inspection, and maintenance, significantly reducing error rates and training cycles. In logistics, AR overlays support route optimization, hands-free picking, and inventory accuracy, improving fulfillment speeds. Healthcare facilities integrate AR for remote surgical support and interactive medical training, enhancing clinician capabilities. The shift toward hybrid workplaces further drives adoption of collaborative AR platforms that combine spatial visualization with real-time communication. As digital transformation initiatives intensify across sectors, enterprises increasingly view AR as a strategic tool that improves worker productivity, lowers operational costs, and enhances safety in high-complexity environments. This expanding use across frontline operations positions enterprise AR as one of the strongest market accelerators.
- For instance, Boeing reported that using AR-assisted wiring instructions on its aircraft programs cut wiring production time by 25% and reduced errors to near-zero, based on deployments using AR headsets.
Advancements in AR Hardware and Optical Technologies
Hardware innovations significantly strengthen AR uptake by improving display quality, wearability, and overall user comfort. New optical engines—such as waveguide displays, micro-OLED panels, and laser beam scanning—deliver high brightness, low latency, and enhanced color fidelity, supporting more realistic overlays in both indoor and outdoor settings. Weight reduction and ergonomic improvements allow extended use of headsets and smart glasses in enterprise and consumer environments. Battery efficiency gains, thermal management improvements, and integrated spatial sensors enhance device performance while reducing fatigue and overheating issues. The availability of premium lightweight devices from leading manufacturers is accelerating adoption in gaming, training, healthcare diagnostics, and field services. As hardware reliability increases and costs gradually decline, broader accessibility and more compelling user experiences further strengthen AR’s growth trajectory.
- For instance, Magic Leap 2 incorporates a 70-degree diagonal field of view, a dynamic dimming feature capable of reaching 2,000 nits peak brightness, and a 12-megapixel RGB camera, enabling precise enterprise-grade visualization and improved outdoor usability.
Rising Integration of AR in Consumer Experiences and Digital Commerce
Consumer-facing industries increasingly deploy AR to elevate personalization, visualization, and immersive engagement. Retailers use AR try-on solutions for fashion, cosmetics, eyewear, and home furnishings, enabling shoppers to preview products with high accuracy and reducing return rates. Entertainment and gaming platforms integrate spatial interaction, mixed-reality overlays, and gesture-controlled interfaces, boosting user immersion. Social media companies continue to expand AR filters, avatars, and collaborative virtual spaces, driving high engagement among younger demographics. The proliferation of 5G enhances AR streaming and real-time rendering, allowing smoother, high-fidelity experiences. As consumers embrace digital-first behavior, AR becomes a central tool for brands seeking differentiation, higher conversion rates, and richer user journeys. This shift ensures robust growth across lifestyle, entertainment, and retail ecosystems.
- For instance, Snap Inc. reported that over 350 million people use its AR Lenses daily, and its Lens Studio platform supports more than 4 million AR creations by over 400,000 creators worldwide, enabling large-scale consumer AR engagement.
KEY TRENDS & OPPORTUNITIES:
Convergence of AR with AI, Spatial Computing, and Digital Twins
A major trend reshaping the AR market is the convergence of AR with artificial intelligence, spatial computing, and digital twin technologies. AI-driven scene understanding, object recognition, and gesture tracking enhance AR accuracy while enabling seamless real-world interaction. Spatial computing frameworks unify 3D mapping, sensor fusion, and environmental understanding, creating stable, persistent AR experiences across devices. Meanwhile, digital twins allow real-time visualization of industrial equipment, buildings, and supply chain systems, enabling predictive maintenance and faster decision-making. These integrations unlock high-value opportunities in manufacturing, aviation, energy, and smart infrastructure. As industries adopt intelligent, immersive, and data-rich AR platforms, demand for integrated AR-AI ecosystems expands rapidly.
- For instance, NVIDIA’s Omniverse platform enables industrial digital-twin simulations with physics-accurate rendering and can synchronize data from IoT sensors in real time across factory environments.
Growing Opportunity in Healthcare, Training, and Remote Collaboration
Healthcare, education, and professional training represent high-potential areas for AR expansion. Surgeons use AR for pre-operative planning, intraoperative guidance, and remote tele-mentoring, improving clinical precision and reducing risks. Medical students benefit from interactive 3D anatomical models that enhance understanding of complex procedures. In corporate settings, AR-powered remote collaboration enables experts to guide technicians in real time, reducing downtime and travel costs. Immersive training modules for manufacturing, aviation, defense, and emergency response significantly improve learning retention and operational readiness. These segments continue to grow as institutions seek scalable, cost-effective, and highly interactive learning and support tools.
· For instance, Johns Hopkins surgeons used the Augmedics xvision AR navigation system (which uses the Microsoft HoloLens as its display hardware) during spinal procedures to place six pedicle screws with high accuracy. A related study on the system’s precision reported the mean screw tip linear deviation from the pre-planned trajectory was approximately 1.98 mm, demonstrating high clinical precision and reliable intraoperative visualization.
Expansion of AR in Automotive and Retail Customer Experience
AR is becoming a core differentiator in automotive and retail experiences. Automakers incorporate AR head-up displays to project navigation, safety alerts, and driving assistance data directly onto windshields, enhancing driver awareness. Showrooms use AR apps to help customers configure vehicles, visualize interiors, and assess feature combinations. In retail, AR-powered virtual try-on, product visualization, and interactive marketing campaigns increase purchase confidence and drive stronger engagement. As customer experience becomes a competitive battleground, AR-enabled personalization and immersive storytelling provide tangible advantages across both sectors, opening new revenue streams and customer-centric applications.
KEY CHALLENGES:
High Hardware Costs and Limited Consumer-Grade Accessibility
Despite rapid innovation, AR devices remain expensive for mass-market adoption. High-quality optical components, advanced sensors, spatial tracking systems, and thermal management solutions significantly raise manufacturing costs. As a result, premium headsets and smart glasses remain largely targeted at enterprises or high-income consumers. Limited affordability constrains adoption outside gaming and specialized corporate settings. Additionally, hardware miniaturization challenges hinder development of compact, comfortable devices with long battery life. Until manufacturing economies of scale improve and component costs decline, broader consumer penetration will remain limited, slowing AR’s mainstream momentum.
Technical Limitations, Privacy Concerns, and Integration Complexity
AR faces persistent technical hurdles including latency, field-of-view limitations, battery constraints, and inconsistent environmental mapping in dynamic settings. These issues can disrupt user experience, particularly in high-precision applications such as surgery, aviation, or industrial inspection. Privacy concerns also intensify as AR devices integrate cameras and sensors that continuously capture surroundings, raising regulatory scrutiny and public resistance. Furthermore, integrating AR with legacy enterprise systems, 3D data, and real-time analytics requires specialized skills and significant IT investment. These challenges collectively slow deployment, especially in tightly regulated or safety-critical sectors.
Regional Analysis:
North America
North America holds the largest share of the augmented reality market at around 38%, driven by strong technology adoption, high investment in enterprise digital transformation, and the presence of leading AR innovators across the U.S. The region benefits from advanced 5G infrastructure, strong demand for AR-enabled training, logistics optimization, and healthcare visualization. Major companies continue expanding AR hardware and software capabilities for consumer and industrial applications. Growing integration of AR into gaming ecosystems, automotive HUDs, and defense training further strengthens regional dominance. Continued R&D funding and rising enterprise deployment will keep North America a primary growth hub.
Europe
Europe accounts for approximately 24% of the global AR market, supported by strong adoption in automotive, aerospace, manufacturing, and medical applications. The region’s advanced industrial base drives demand for AR-assisted maintenance, worker training, and real-time monitoring solutions. Automotive OEMs across Germany, France, and the U.K. increasingly integrate AR head-up displays and showroom visualization tools. Healthcare systems adopt AR for surgical planning and telemedicine, strengthening adoption across major economies. EU-backed digitalization initiatives and smart manufacturing programs continue to accelerate enterprise-grade AR deployment, ensuring stable growth across the region.
Asia-Pacific (APAC)
Asia-Pacific represents one of the fastest-growing regions, capturing around 30% of the market due to rapid expansion in consumer electronics, manufacturing, and digital commerce. China, Japan, and South Korea lead AR technology development, supported by strong hardware production capabilities and growing 5G network penetration. AR adoption in gaming, social media, and mobile apps is significantly higher compared to other regions, boosting consumer-driven growth. Enterprises increasingly rely on AR for factory automation, logistics support, and training. Rising investment in smart cities, digital retail, and automotive innovation positions APAC as a central driver of future AR market expansion.
Latin America
Latin America holds approximately 5% of the global AR market, with adoption gradually increasing across retail, education, and industrial training applications. Brazil and Mexico lead regional demand, driven by expanding digital commerce ecosystems and the growing use of AR-based customer engagement tools. Enterprises adopt AR for workforce training, field maintenance, and remote assistance to counter resource constraints. Gaming and entertainment applications also contribute to rising consumer usage. Although limited by slower infrastructure development and higher device costs, increasing 5G rollout and digital transformation programs are expected to gradually strengthen regional AR adoption.
Middle East & Africa (MEA)
The Middle East & Africa region accounts for around 3% of the AR market, supported by growing investment in smart infrastructure, retail innovation, and industrial modernization. Gulf countries such as the UAE and Saudi Arabia lead adoption through government-backed digital initiatives, AR-integrated tourism services, and advanced training programs in energy and aviation. Retailers increasingly use AR for product visualization and customer engagement, while educational institutions incorporate AR modules to improve interactive learning. Despite challenges related to device affordability and skilled workforce availability, MEA’s strong smart-city momentum continues to create emerging AR opportunities.
Market Segmentations:
By Component
- Hardware
- Head-Mounted Displays (HMDs)
- Head-Up Displays (HUDs)
- Smart Glasses
- Software
By Application
- Medical
- Automotive
- Aerospace & Defense
- Gaming
- Retail
- Industrial
By Geography
- North America
- Europe
- Germany
- France
- U.K.
- Italy
- Spain
- Rest of Europe
- Asia Pacific
- China
- Japan
- India
- South Korea
- South-east Asia
- Rest of Asia Pacific
- Latin America
- Brazil
- Argentina
- Rest of Latin America
- Middle East & Africa
- GCC Countries
- South Africa
- Rest of the Middle East and Africa
Competitive Landscape:
The augmented reality market features an increasingly competitive landscape shaped by rapid hardware innovation, expanding software ecosystems, and accelerating enterprise adoption. Leading technology companies focus on advanced optics, lightweight headset designs, and high-performance processors to strengthen hardware capabilities, while software developers invest in spatial computing engines, AI-driven scene understanding, and real-time 3D rendering frameworks. Strategic partnerships between AR platform providers, telecom operators, and industrial solution integrators enhance cross-industry deployment. Start-ups play a significant role by introducing niche applications in remote assistance, training, e-commerce visualization, and medical imaging. Meanwhile, major consumer-focused brands continue expanding AR features within gaming, retail, and social media ecosystems to capture younger demographics. Ongoing mergers, acquisitions, and R&D investments reinforce competition as companies race to deliver more immersive, reliable, and scalable AR solutions for enterprise and consumer markets.
Shape Your Report to Specific Countries or Regions & Enjoy 30% Off!
Key Player Analysis:
- Google Inc
- Magic Leap
- Qualcomm
- HTC Corporation
- Blippar
- Microsoft Corporation
- Daqri
- Apple Inc.
- Marxent Labs, LLC
- Facebook Inc
- Wikitude GmbH
Recent Developments:
- In October 29 2025, Magic Leap revealed an AR glasses prototype and extended its strategic partnership with Google, focusing on optics, waveguides and wearable-AR ecosystem development.
- In July 2025, Qualcomm held a “Snapdragon XR Day” event in India showcasing AR/XR technologies and indicating its commitment to future smart glasses platforms.
- In May 2024, Google announced an international pilot programme for location-based AR experiences in Singapore and Paris, aimed at validating real-world use cases for brands.
Report Coverage:
The research report offers an in-depth analysis based on Component, Application and Geography. It details leading market players, providing an overview of their business, product offerings, investments, revenue streams, and key applications. Additionally, the report includes insights into the competitive environment, SWOT analysis, current market trends, as well as the primary drivers and constraints. Furthermore, it discusses various factors that have driven market expansion in recent years. The report also explores market dynamics, regulatory scenarios, and technological advancements that are shaping the industry. It assesses the impact of external factors and global economic changes on market growth. Lastly, it provides strategic recommendations for new entrants and established companies to navigate the complexities of the market.
Future Outlook:
- AR will become a core layer of digital interaction as spatial computing platforms mature and deliver more stable, immersive real-world overlays.
- Enterprise adoption will accelerate as AR improves training efficiency, maintenance precision, and remote collaboration across industrial sectors.
- AR devices will become lighter, more ergonomic, and more power-efficient, enabling longer usage in both consumer and professional environments.
- AI-driven scene understanding will enhance real-time object detection, gesture recognition, and contextual personalization.
- AR head-up displays will expand rapidly in automotive applications, supporting safer navigation and driver-assistance workflows.
- Healthcare adoption will grow as AR strengthens surgical planning, remote tele-mentoring, and medical education.
- Retail and e-commerce will rely more heavily on AR try-on tools, product visualization, and experiential marketing.
- Education and workforce training will increasingly use AR simulations to improve learning retention and reduce training costs.
- Smart city initiatives will integrate AR for infrastructure visualization, public services, and tourism experiences.
- Interoperable AR ecosystems will emerge as major tech companies unify hardware, software, and cloud platforms for seamless cross-device experiences.


