
Walls, AR glasses and optical links scale micro LED chips
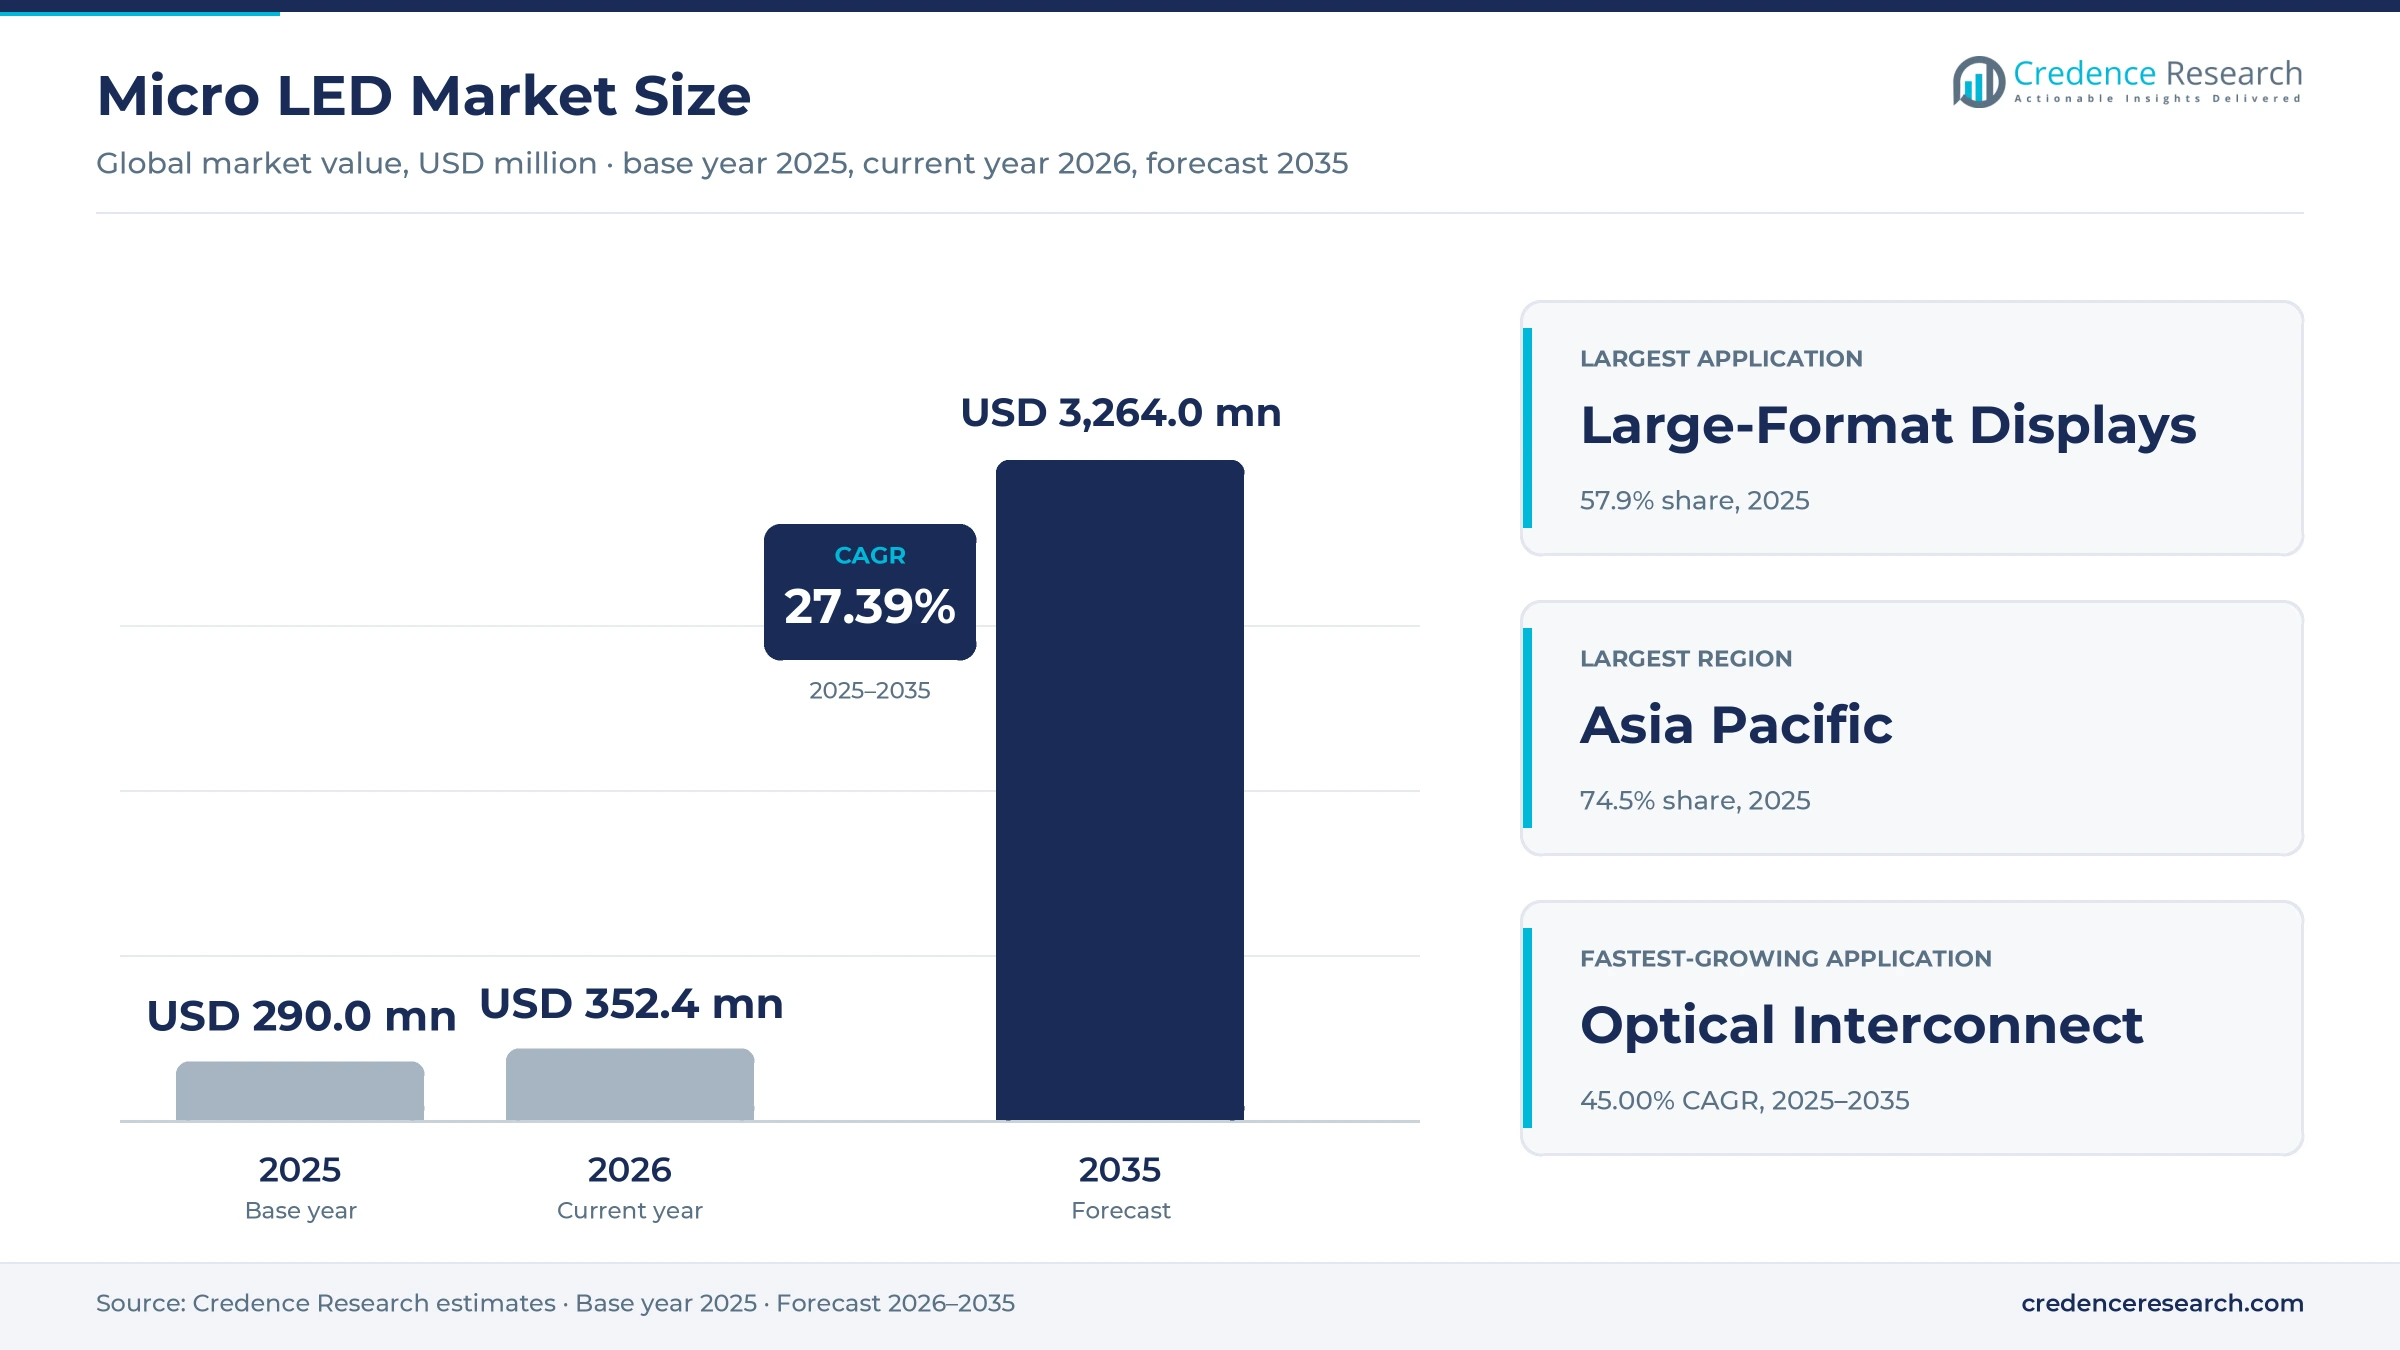
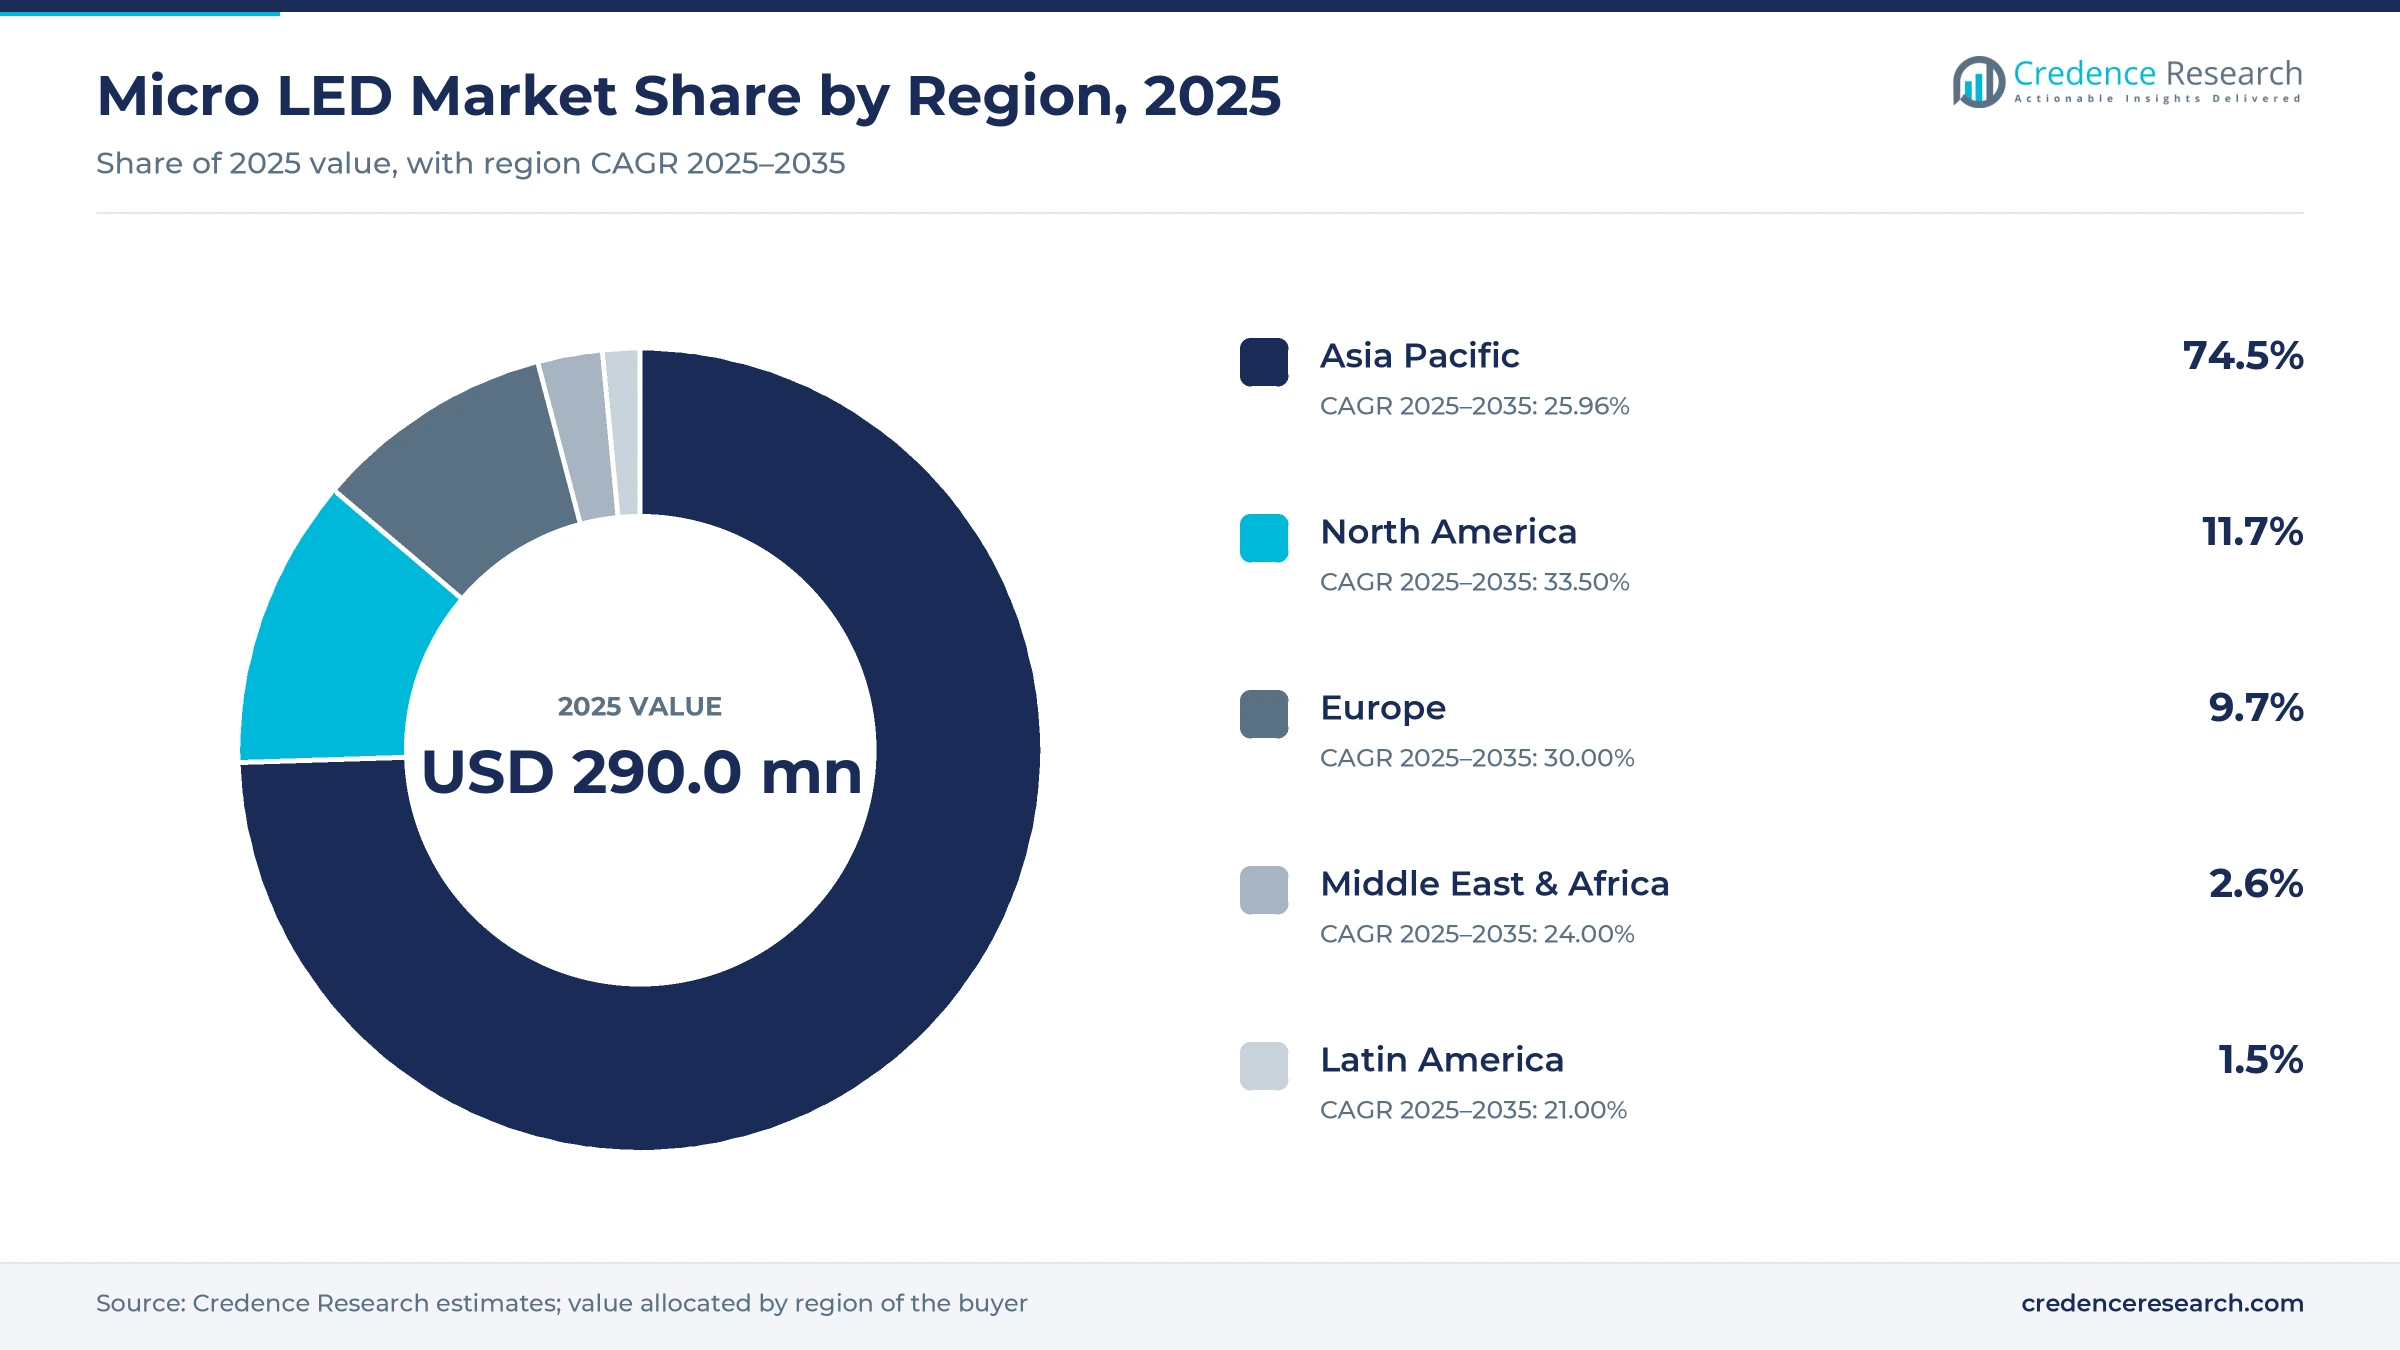
The micro LED market was valued at USD 290.0 million in 2025 and is projected to increase from USD 352.4 million in 2026 to USD 3.26 billion by 2035, registering a CAGR of 27.39% during 2025–2035. Demand comes from bright large video walls and outdoor wearables, augmented reality glasses that need tiny, intense emitters and AI data centers looking for lower-power optical links. Asia Pacific held the largest regional share, 74.5% in 2025, because most chip fabs, panel lines and glasses assemblers sit in Taiwan, mainland China and South Korea. North America is the fastest-growing region at 33.50% a year, pulled by hyperscale data centers and AR developers. The main technology change is the move to larger, silicon-matched wafers. JBD shifted microdisplay production to a 12-inch reconstructed-wafer platform in May 2026, and Aledia began volume output of nanowire emitters on silicon in France.
What counts as a micro LED emitter, and who buys it?
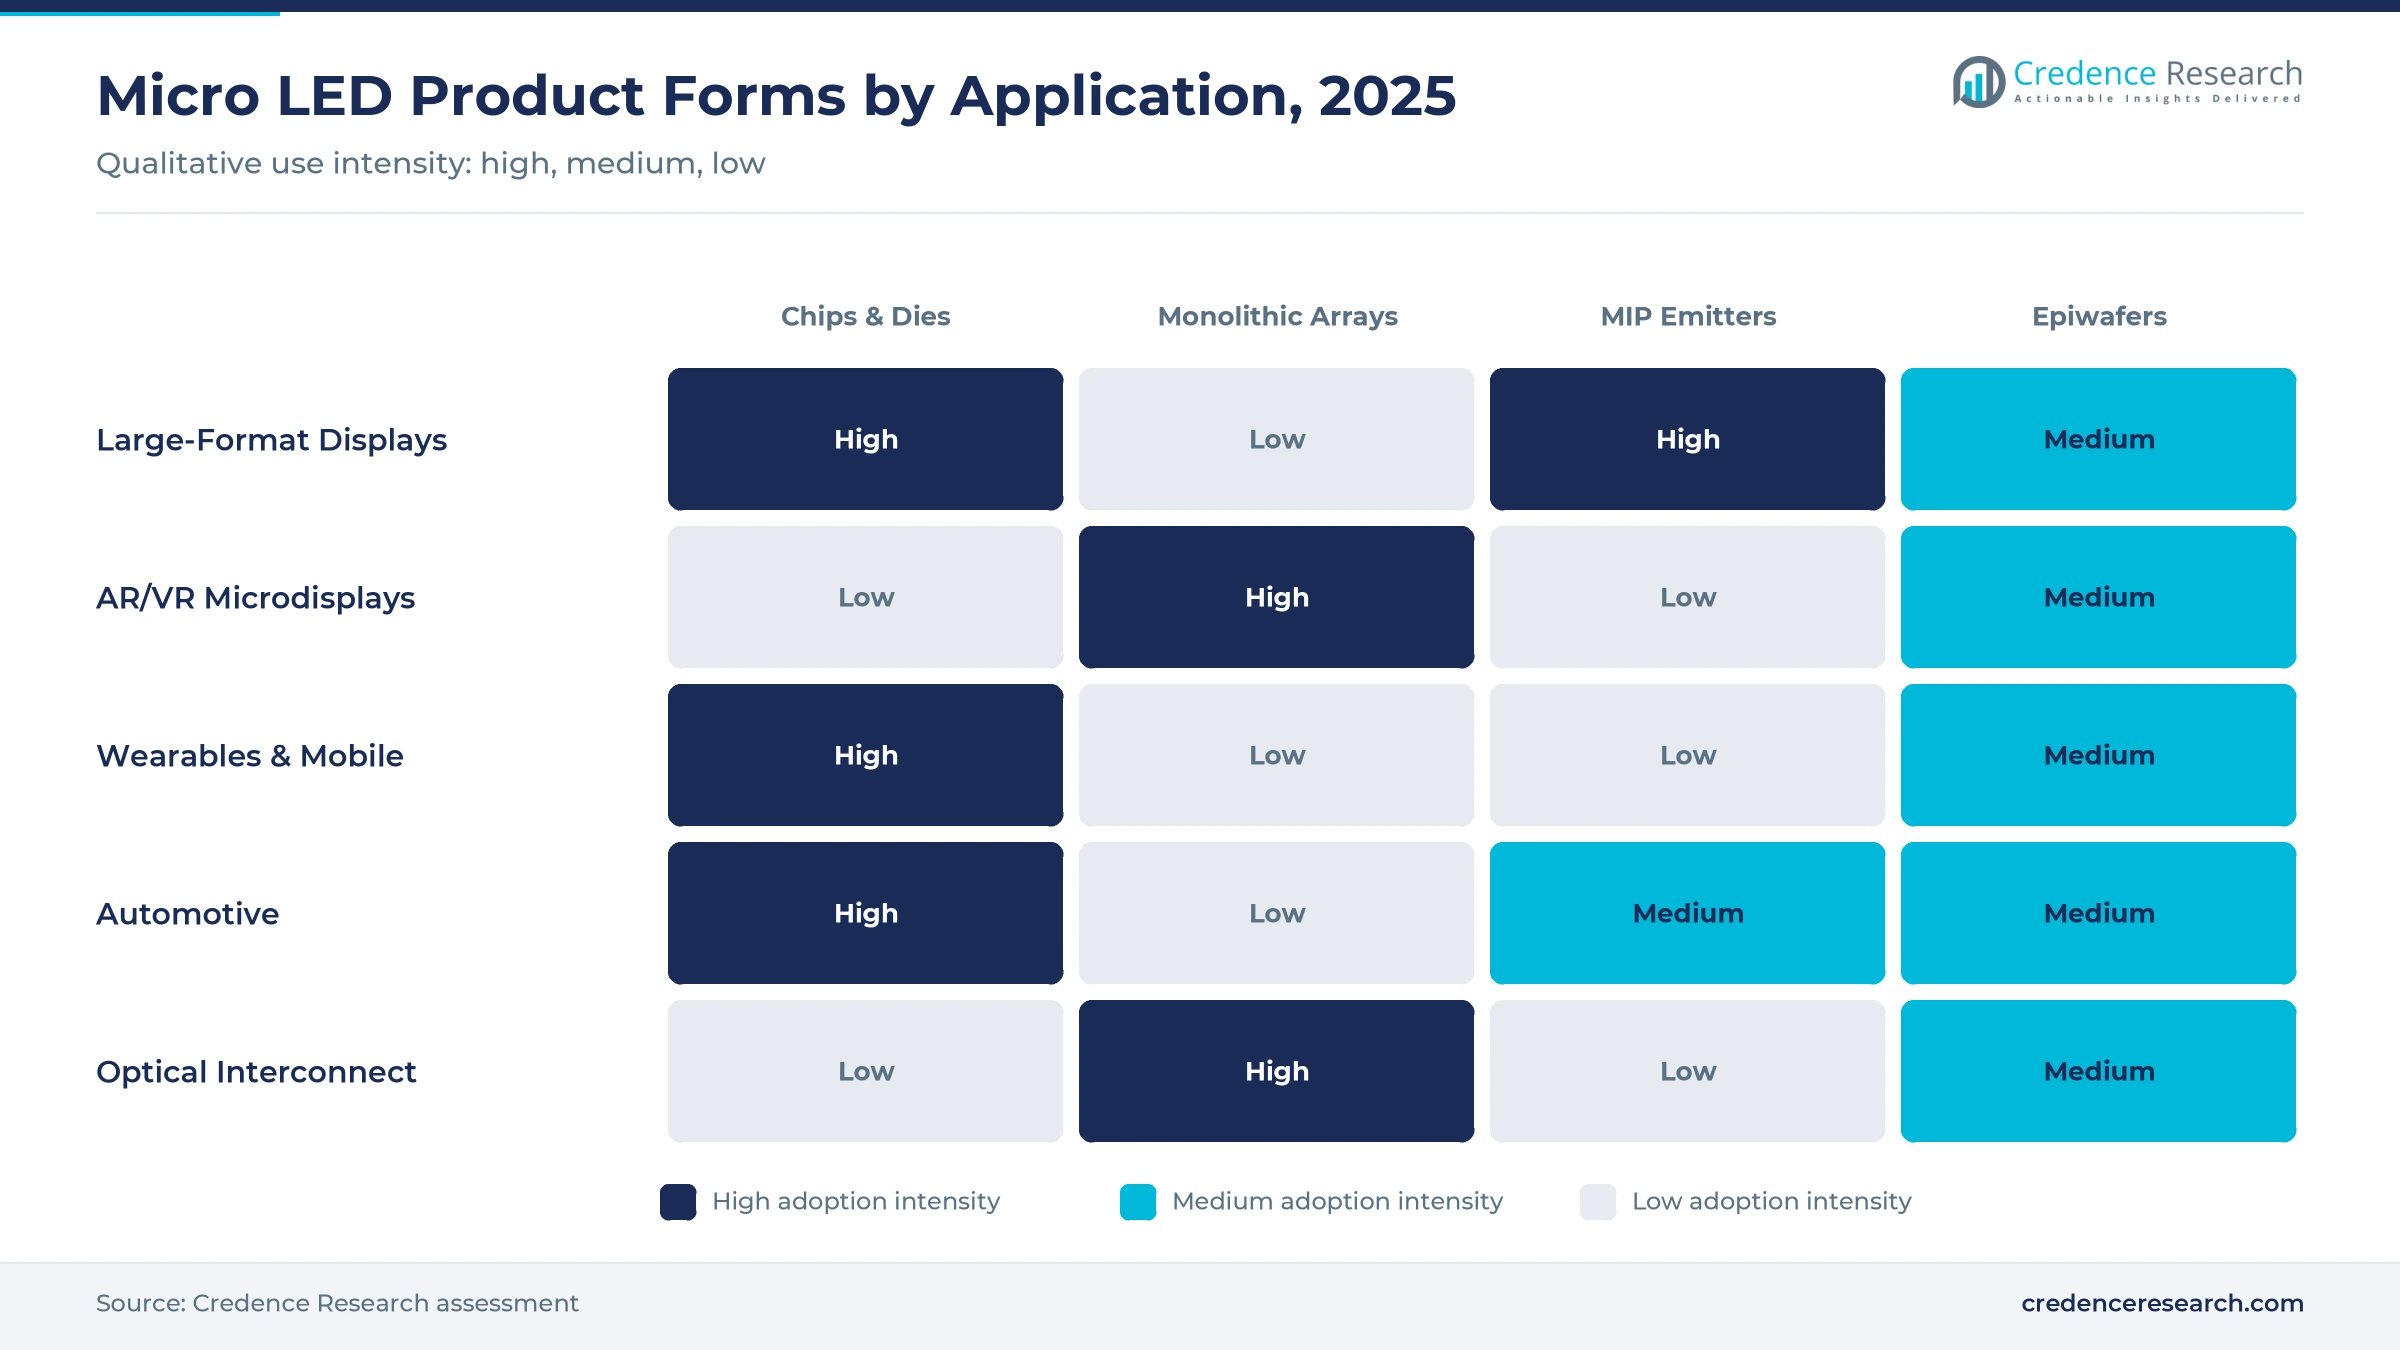
Micro LEDs are gallium nitride and related emitters with a chip edge below roughly 100 microns. They reach buyers in four forms, namely discrete chips and dies shipped on carriers ready for mass transfer, monolithic arrays bonded to a CMOS backplane for near-eye displays and optical links, micro LED-in-package (MIP) emitters that standard surface-mount lines can place, and epitaxial wafers for firms that run their own chip process. Buyers are panel makers, microdisplay houses, module makers and system builders.
The market values the emitter, not the screen, so finished panels, TVs and video walls, TFT or CMOS backplanes, driver ICs, mass-transfer equipment and mini LED backlight chips are all excluded. Valuing the chip matters because panel value also counts glass, drivers and assembly, which hides how small and concentrated the emitter business still is. Merchant suppliers and panel groups that grow emitters in-house sit side by side.
Micro LED Market Insights
- The micro LED market is projected to grow from USD 352.4 million in 2026 to USD 3.26 billion by 2035, a 27.39% CAGR, as emitters reach walls, glasses and links.
- Asia Pacific held 74.5% of 2025 value, the largest regional share, because Taiwan, mainland China and South Korea host most chip fabs, panel lines and glasses assemblers.
- Large-format displays and TVs accounted for 57.9% of 2025 chip value, the largest application, as hotels, control rooms and studios buy seamless, bright modular walls.
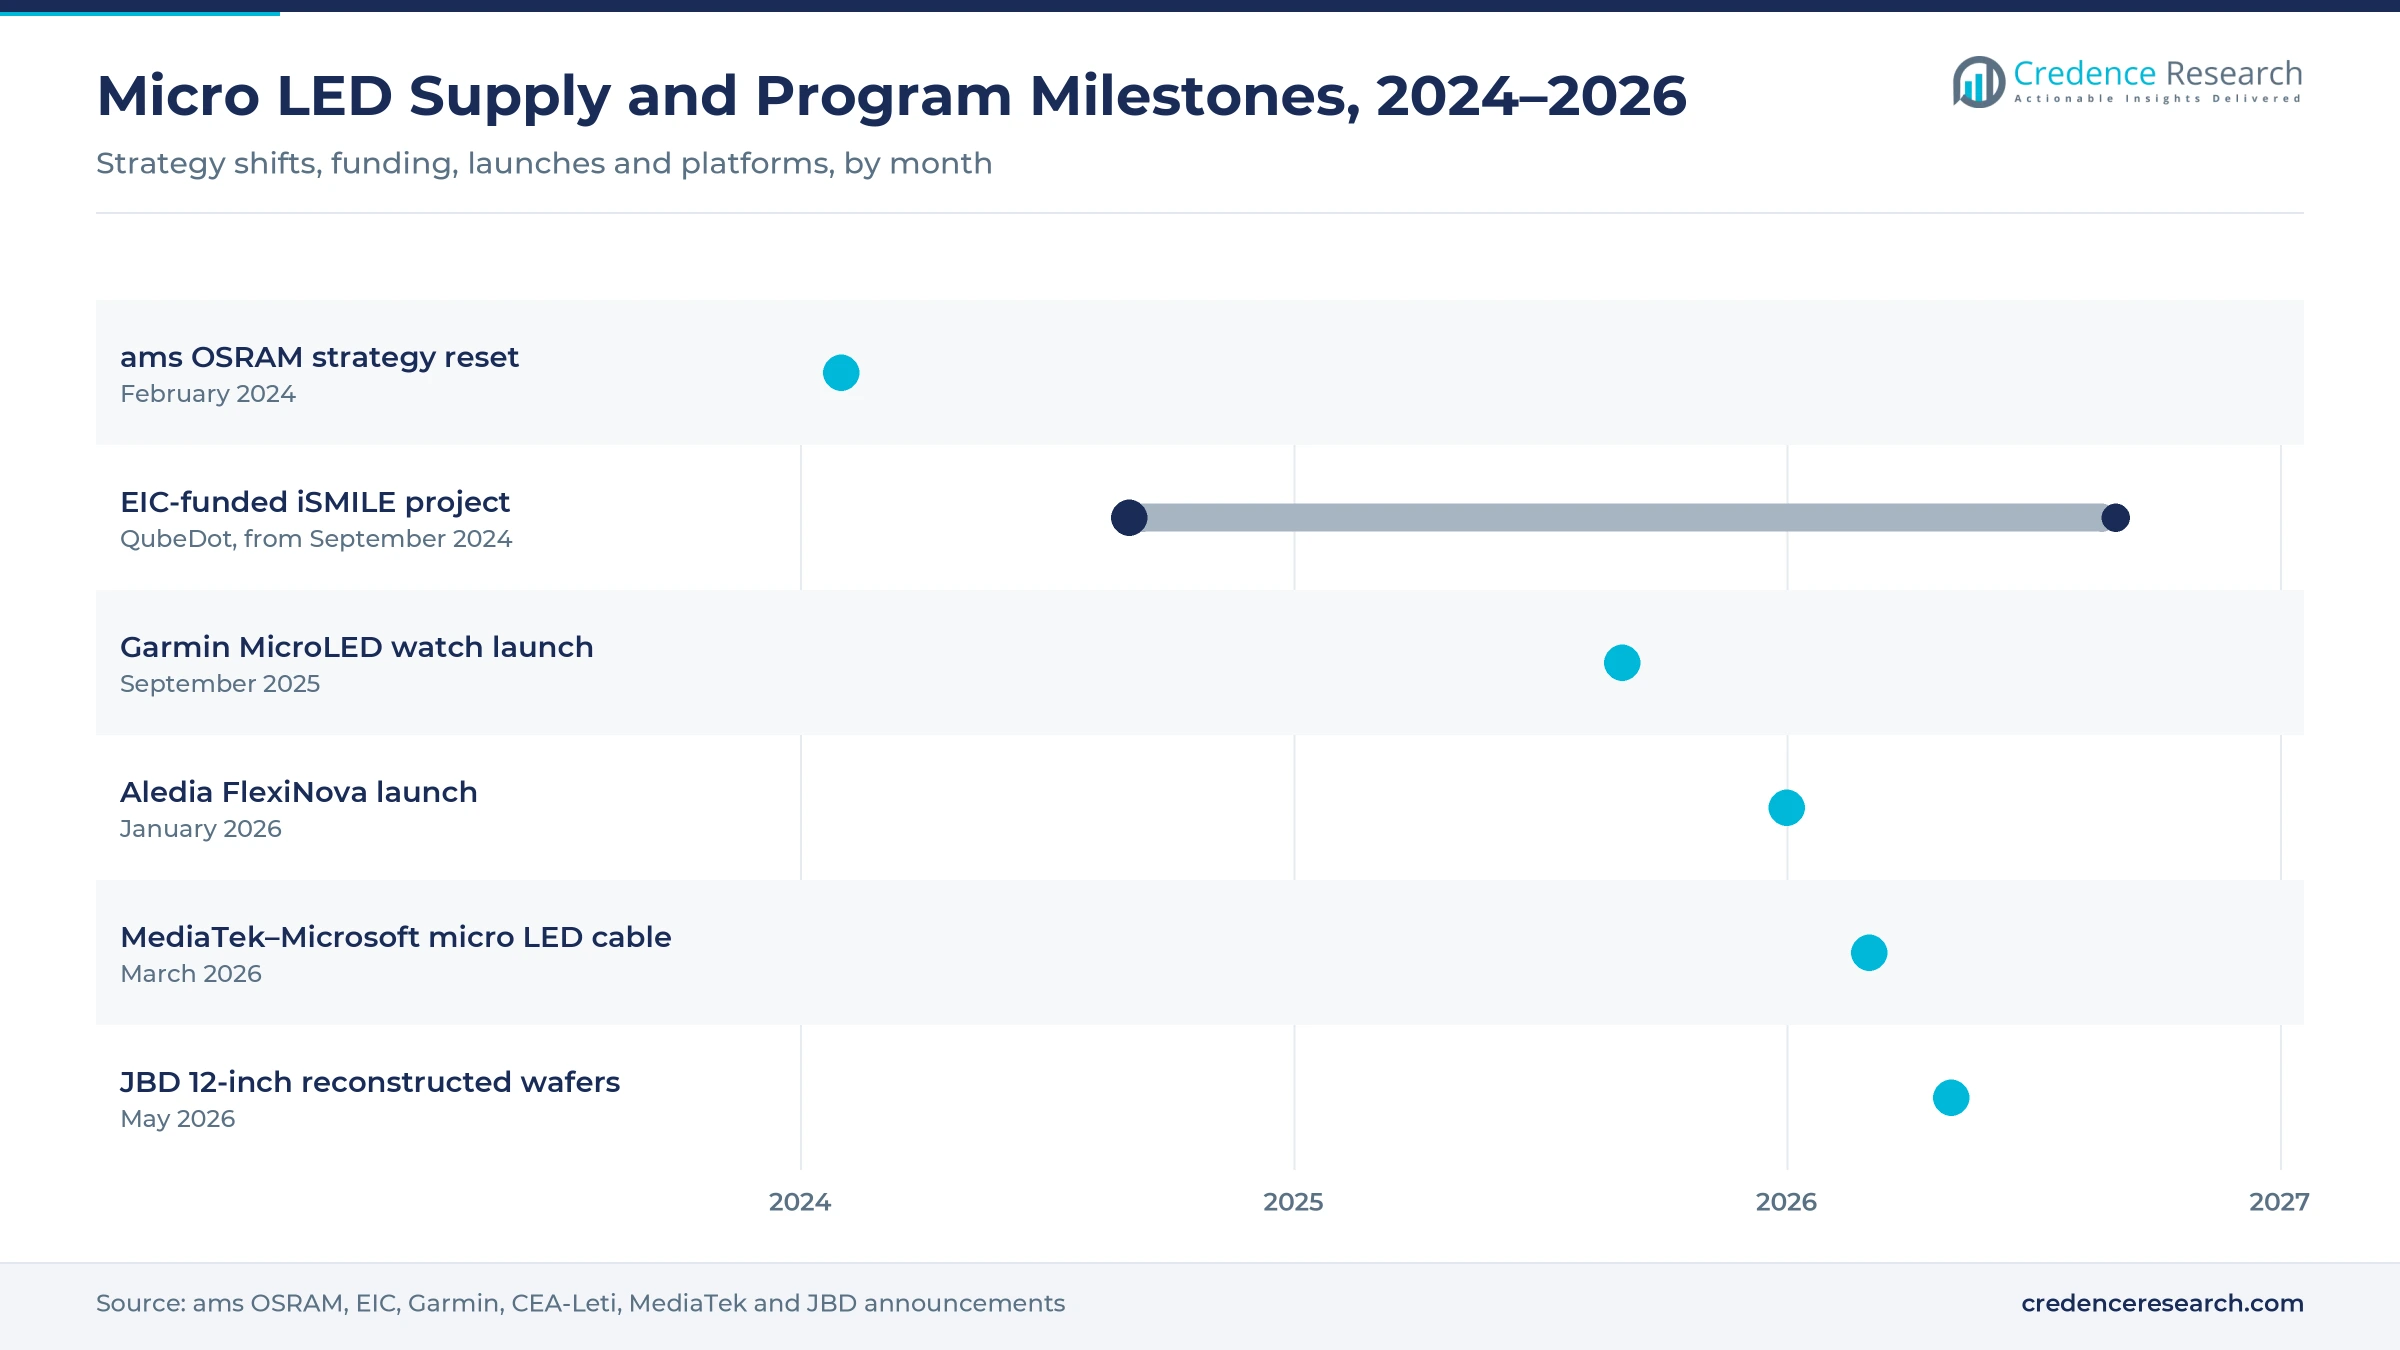
- Production is scaling. JBD moved microdisplay output to a 12-inch reconstructed-wafer platform in May 2026, and Aledia launched its FlexiNova nanowire platform in January 2026.
- Optical interconnect is the fastest-growing application at 45.00% a year through 2035 after MediaTek and Microsoft Research unveiled a lower-power micro LED cable design.
Video walls and discrete chips hold most of the value
Large-format displays lead applications while optical interconnect grows fastest
Based on application, the market is categorized into large-format displays and TVs, AR/VR and near-eye microdisplays, wearables and mobile devices, automotive displays and lighting, and optical interconnect and other non-display uses. Large-format displays led with 57.9% of 2025 chip value, since modular walls for studios, control rooms and luxury homes use millions of emitters each. Optical interconnect grows fastest at 45.00% a year from a base of samples and qualification lots, as AI clusters seek lower-power links.
Discrete chips lead the product mix while monolithic emitter arrays grow fastest
Based on product, the market is categorized into micro LED chips and dies, monolithic emitter arrays, micro LED-in-package (MIP) emitters and epitaxial wafers. Discrete chips and dies led with 44.2% of 2025 value, because they feed walls, watches and car displays on carriers ready for mass transfer. Monolithic emitter arrays grow fastest at 39.00% a year, since one array on CMOS serves both AR glasses and optical transmitters and keeps the value with the emitter maker.
| Segment Group | Leading Sub-segment | Share, 2025 | Fastest-growing Sub-segment | CAGR, 2025–2035 |
|---|---|---|---|---|
| By Application | Large-Format Displays & TVs | 57.9% | Optical Interconnect & Other Non-Display | 45.00% |
| By Product | Micro LED Chips & Dies | 44.2% | Monolithic Emitter Arrays | 39.00% |
Request a Free Sample
Fill in your details and we'll send you a free sample report.
- Sample data tables & charts
- Research methodology
Bright walls, near-eye optics and AI clusters drive demand
Brightness without burn-in wins walls and outdoor watches
A self-emitting inorganic pixel does not burn in like OLED and needs no backlight like LCD, so it stays readable in direct sun. Garmin's fēnix 8 Pro MicroLED, launched in September 2025, packs over 400,000 individual LEDs delivering up to 4,500 nits, which Garmin calls the brightest smartwatch ever. Hotels, control rooms and broadcast studios buy direct-view walls for the same reason, an effect that is immediate and global.
Augmented reality glasses need emitters only micro LED can supply
Waveguide glasses lose most of the light they generate, so only an emitter with very high brightness per square micron leaves enough at the eye for daylight use. Monolithic arrays on silicon are also small enough to fit in a temple arm. Chinese glasses brands moved first with monochrome green arrays for text and navigation, and full-color arrays at a 2.5-micron pixel pitch are now sampling. Each color step adds emitter content per pair of augmented reality glasses, a medium-term driver concentrated in Asia Pacific.
AI data centers look to micro LED links to cut interconnect power
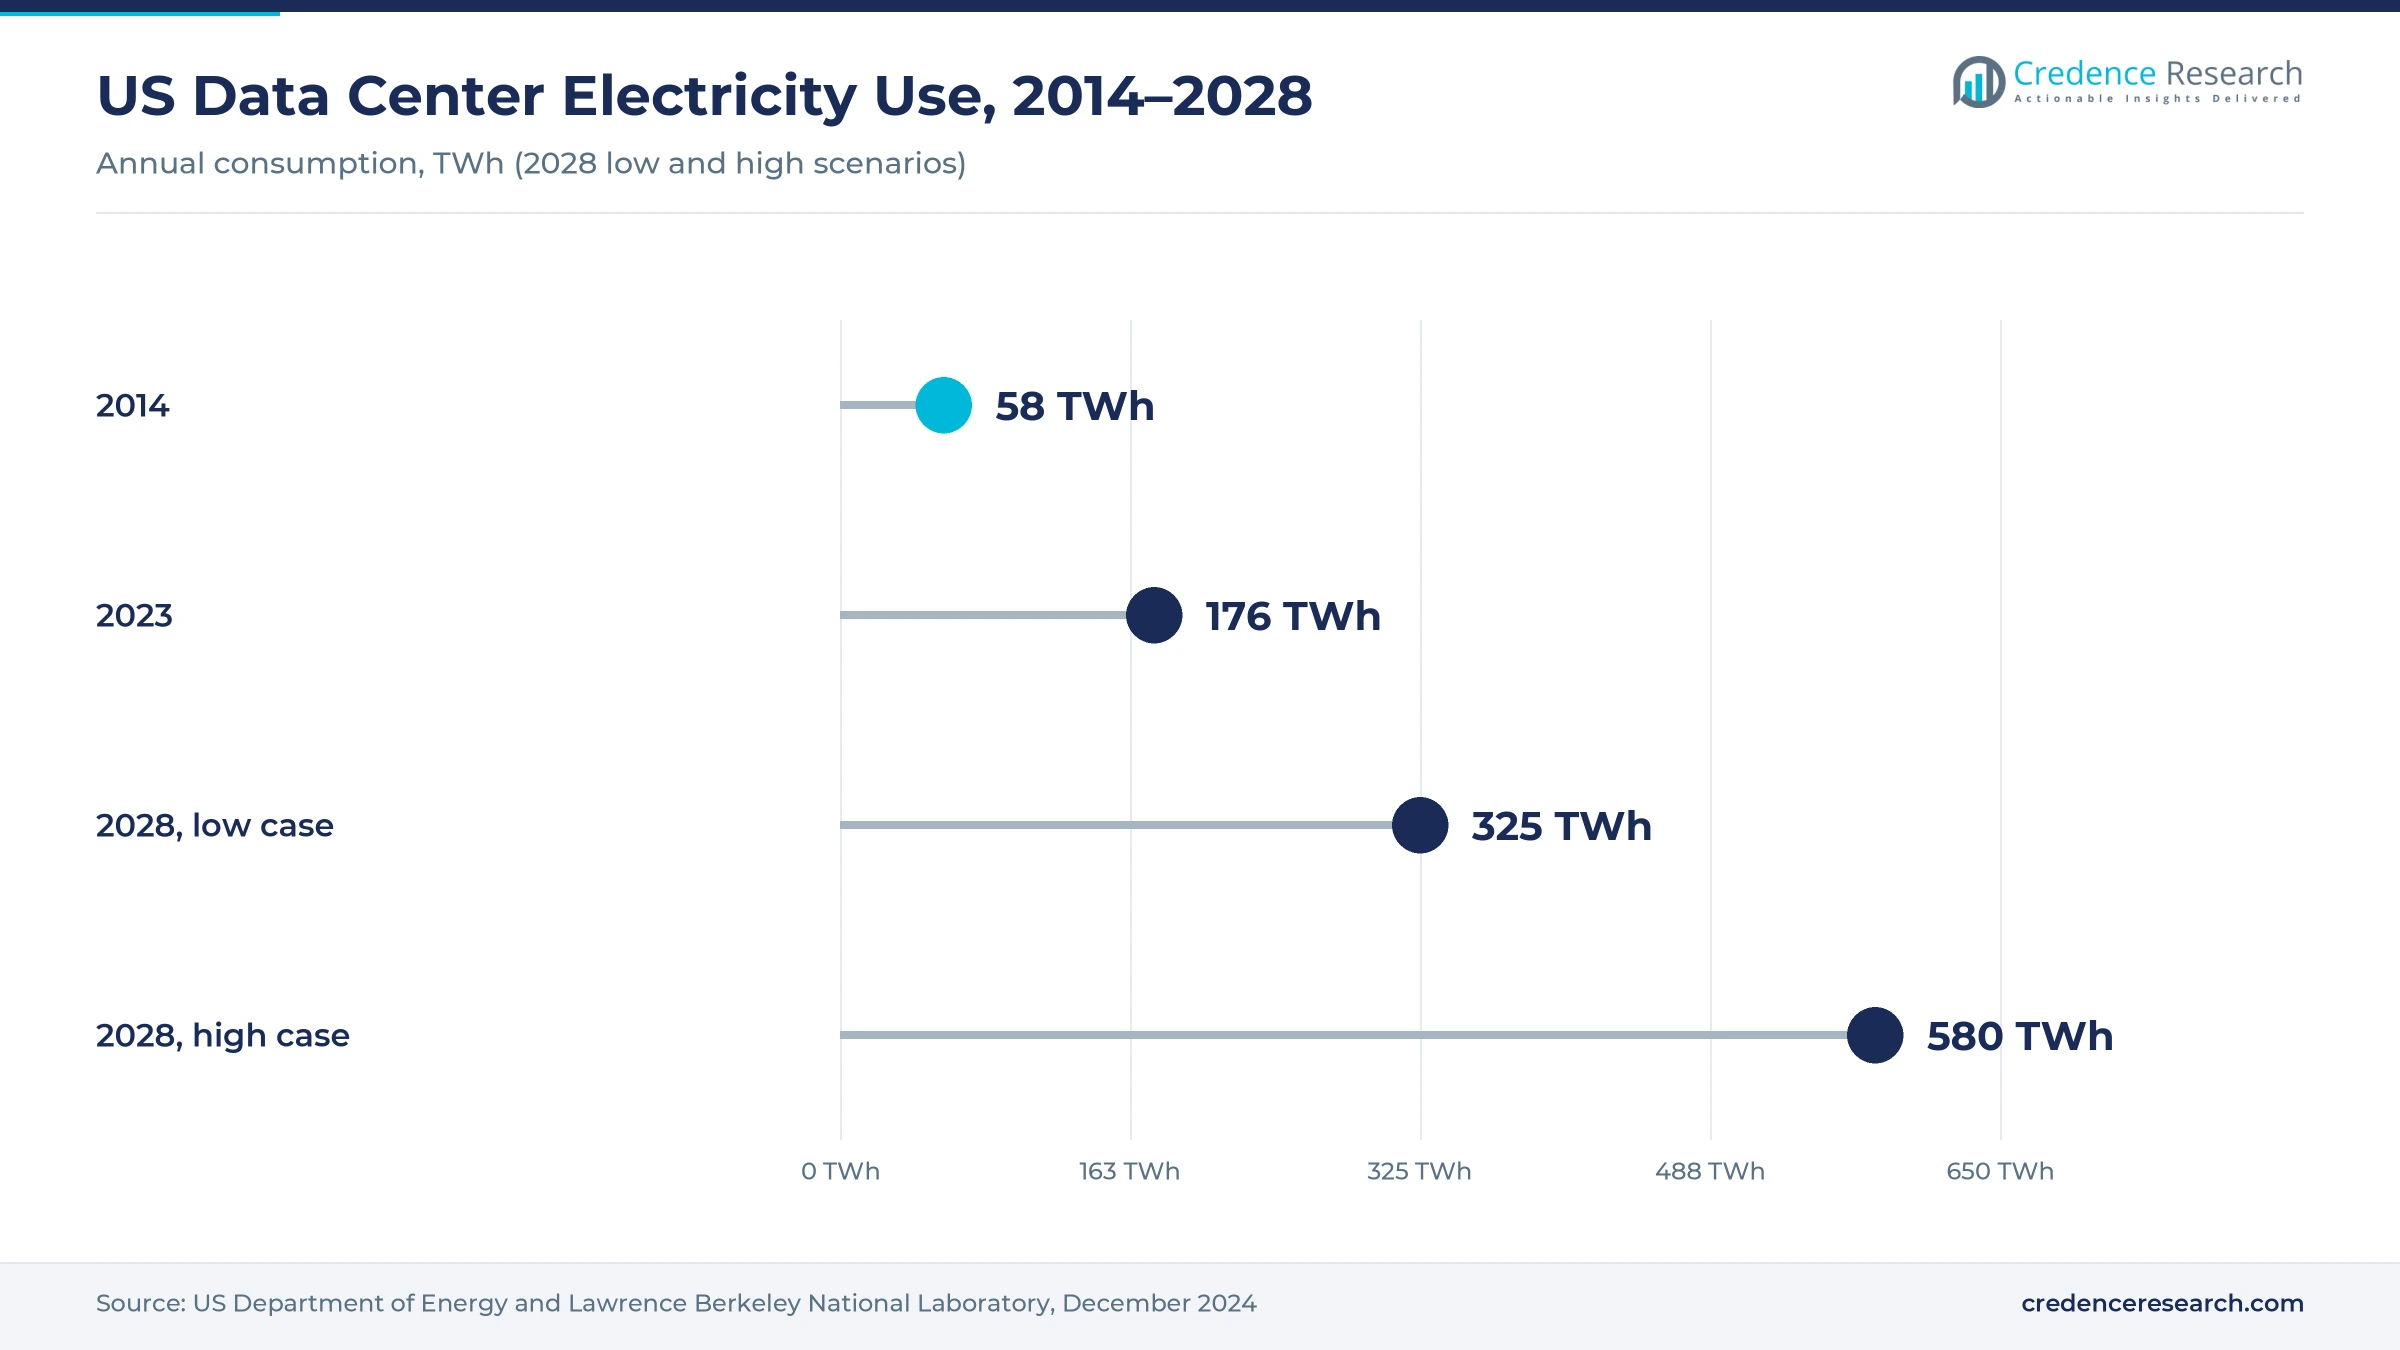
U.S. data centers used 176 TWh of electricity in 2023, about 4.4% of the national total, and could use 325 to 580 TWh by 2028, according to the U.S. Department of Energy. Moving data between chips takes a growing share of that power. In March 2026, MediaTek and Microsoft Research unveiled a micro LED active optical cable that could use up to 50% less power than VCSEL-based cables and scale to 800 Gbps. That demand makes data center links a long-term driver led by North America.
Vehicle cockpits add heat-tolerant display and lighting demand
Car makers want transparent pillars, freeform dashboards, head-up projection and pixelated headlamps, and micro LED handles heat and sunlight better than OLED. AUO showed transparent micro LED tiles and a 13-inch micro LED head-up display at SID Display Week in May 2025. Qualification cycles are long, so demand builds as programs move from show cars to series cockpits in the early 2030s. Chip makers with automotive-grade binning, repair and reliability data, mainly in Taiwan and Korea, gain first.
Bigger wafers and nanowires on silicon shift chip supply
Emitter wafers are moving toward 12-inch sizes that match CMOS backplanes
Microdisplay makers are moving emitter layers onto the same wafer size as the CMOS backplane underneath. In May 2026, JBD announced that it had moved its mass-production architecture from 4-inch wafers to a 12-inch reconstructed-wafer platform, placing tested good dies from small epiwafers onto a carrier with reconstitution yield above 98% on its pilot line. Matching backplane size cuts silicon wasted under bad emitters, which favors monolithic arrays, the fastest-growing product.
Nanowire emitters on silicon reach volume in France
Aledia grows 3D gallium nitride nanowires on silicon instead of planar layers on sapphire. The CEA-Leti spin-off opened its factory in Champagnier, near Grenoble, in 2021, and in January 2026 it launched FlexiNova, its first product platform, according to CEA-Leti. Sample devices measure 15 by 30 microns and run at 6 volts on a 400-micron-pitch backplane. Target customers are TFT panel makers in Asia that buy chips rather than run their own epitaxy, which widens the merchant chip market.
Optical links offer an opportunity as a forgiving first volume market
Interconnect needs fast, cool-running emitters but not perfect color or near-zero defects across millions of pixels, which makes it an easier volume market for chip fabs. Copper links reach less than 2 meters at high speed. Avicena reported 80 fJ/bit transmitter energy at SC25 in November 2025, after starting work with TSMC on photodetector arrays in April 2025. If hyperscalers adopt micro LED cables, link emitters could become a steady wafer load from the early 2030s.
European gallium nitride capacity and merchant epiwafers open an opportunity
European groups want micro LED supply that does not depend on Asian fabs. The EIC Accelerator funds QubeDot's iSMILE project in Braunschweig, running since September 2024, and backs Belgium's QustomDot, whose quantum dot inks convert blue micro LEDs to red and green, with an EU contribution of about EUR 2.5 million. Panel makers and start-ups that prefer to buy epitaxial wafers rather than run reactors open a second route for merchant suppliers in Europe and Asia.
Yield losses, transfer cost and few buyers limit supply
Red emitters and pixel yield remain the core barrier
A 4K screen needs tens of millions of working emitters, and every dead pixel shows. Small wavelength drift across a wafer also creates visible color patches, so chip makers bin, test and repair at every step. Red emitters are the weakest link because efficiency falls sharply as the chip shrinks. Panel makers and microdisplay houses absorb the cost through lower usable output and higher prices. Mitigation comes from quantum dot color conversion, repair tools and wafer-level testing before transfer.
Mass transfer is slow and equipment bets are risky
Moving millions of chips from the growth wafer to a backplane at high speed and near-perfect yield remains the slowest step in production. Equipment choices are still unsettled, so a panel maker or chip supplier that bets on the wrong transfer method can strand capital, and repair adds time to every panel. As a result, the cost falls hardest on direct-view walls and watches. Suppliers respond with MIP emitters that standard surface-mount lines can place and with monolithic arrays that avoid transfer altogether.
Dependence on a few large buyers exposes suppliers
Many chip makers still depend on a handful of panel or device customers. On Feb. 28, 2024, ams OSRAM announced that a cornerstone micro LED project had been unexpectedly canceled, expected non-cash impairment charges of EUR 600 million to 900 million and said it would revisit the use of its new 8-inch LED facility in Kulim, Malaysia. The case shows how one lost program can strand a fab. Suppliers now spread risk across walls, glasses, vehicles and optical links.
Improving OLED and mini LED narrow the window in devices
OLED keeps getting brighter and cheaper, and mini LED backlit LCD offers high brightness at a fraction of micro LED cost. In watches, phones and laptops, micro LED needs a clear advantage in brightness, lifetime or power to win a design slot, which limits adoption to premium and outdoor models for now. Device makers and chip suppliers bear the risk of lost designs. Suppliers counter with niches where OLED struggles, such as sunlight readability, heat tolerance and near-eye brightness, often for premium smartwatch brands.
Asian fabs dominate while North America grows fastest
| Region | Share, 2025 | CAGR, 2025–2035 |
|---|---|---|
| Asia Pacific | 74.5% | 25.96% |
| North America | 11.7% | 33.50% |
| Europe | 9.7% | 30.00% |
| Middle East & Africa | 2.6% | 24.00% |
| Latin America | 1.5% | 21.00% |
Asia Pacific combines chip fabs, panel lines and glasses assembly in one region
Asia Pacific held 74.5% of 2025 value and grows at 25.96% a year. Taiwan, mainland China and South Korea host most chip fabs, panel lines and AR glasses assemblers, including PlayNitride, Ennostar, AUO, Sanan Optoelectronics, HC Semitek and JBD. Korea's industry ministry backs micro LED infrastructure, and the Korea Display Industry Association's inorganic emissive display sub-committee met in October 2025 to coordinate national work. Growth trails the market as wall chip prices fall each year.
North America grows fastest on data center links and AR developers
North America held 11.7% of 2025 value and is the fastest-growing region at 33.50% a year. Hyperscale data centers, AR developers and defense buyers drive demand, and optical-link start-ups such as Avicena are based in California. U.S. data center electricity use rose from 58 TWh in 2014 to 176 TWh in 2023, which makes interconnect power a design priority. Most emitters are still imported from Asian fabs, so supply security is a growing concern for buyers.
Europe builds nanowire production and EU-funded capacity
Europe held 9.7% of 2025 value and grows at 30.00% a year. France hosts Aledia and CEA-Leti, Germany hosts QubeDot and ams OSRAM's LED research, and Belgium's QustomDot develops color-conversion inks with EIC Accelerator funding. Car makers and avionics firms are the main local buyers. EU programs aim to build gallium nitride capacity that does not depend on Asian fabs, but volumes remain small against Asian output, and most European demand is still met with imported chips.
Middle East & Africa and Latin America buy venue and broadcast walls
The Middle East & Africa held 2.6% of 2025 value and grows at 24.00% a year, with large venue, hospitality and government display projects in the Gulf accounting for most demand. Latin America held 1.5% and grows at 21.00% a year, driven mainly by broadcast studios and premium retail walls. Both regions import finished walls, so emitter value follows Asian supply chains.
A 12-inch shift, a nanowire launch and an optical cable
| Development | Status and market relevance |
|---|---|
| In May 2026, JBD announced that it had moved micro LED microdisplay production from 4-inch wafers to a 12-inch reconstructed-wafer platform. | In production. Matches emitter wafers to CMOS backplanes and lifts yield. |
| In March 2026, MediaTek and Microsoft Research unveiled a micro LED active optical cable design with up to 50% lower power than VCSEL-based cables. | Design stage. Opens a non-display volume market for emitter arrays. |
| In January 2026, Aledia launched FlexiNova, its first micro LED production platform, built on 3D gallium nitride nanowires. | Launched. Brings a European nanowire chip source into volume. |
| In September 2025, Garmin launched the fēnix 8 Pro MicroLED smartwatch with over 400,000 LEDs and up to 4,500 nits. | On sale. Puts micro LED into a mainstream sports-watch range. |
| In February 2024, ams OSRAM announced the unexpected cancellation of a cornerstone micro LED project and a reassessment of its strategy. | Strategy reset. Ended hopes of one anchor customer carrying the industry. |
Reconstructed wafers and color conversion set the path
- Wafer scale production with reconstructed 12-inch wafers and nanowires grown on silicon aligns emitter output with CMOS fabs and cuts wasted backplane area.
- Color conversion with quantum dot inks that turn blue emitters red and green offers a route around weak red micro LEDs in small pixels.
- Transfer and repair gains from faster mass transfer, MIP packaging and wafer-level testing aim to lift panel yield and cut the cost per working pixel.
- Optical links use hundreds of parallel, low-speed micro LED channels in place of a few fast lasers, trading speed per lane for lower power and simpler electronics.
- Near-eye arrays in full color, built as monolithic arrays at a 2.5-micron pixel pitch, are sampling for AR glasses that must be bright enough for daylight.
Need a Custom Version of This Report?
Tailor the scope, geography, or segments to your exact requirements.
- Custom geography or segment scope
- Direct access to our analyst team
Emitter specialists, LED majors and captive panel makers
Supply sits with three groups, starting with specialist firms that own a single emitter process and sell chips, arrays or licenses. PlayNitride, founded in 2014 and listed in Taiwan, sells chips and PixeLED technology; Jade Bird Display makes monolithic microdisplays for AR glasses; Aledia grows nanowires on silicon; and Avicena builds transmitter arrays for optical links. LED majors Ennostar, Sanan Optoelectronics, HC Semitek and Seoul Viosys adapt existing epitaxy fabs to smaller chips, while ams OSRAM keeps research after its 2024 reset. AUO, Samsung and Sony make or buy emitters for their own walls and displays. Credence Research estimates that the ten largest suppliers hold well over two-thirds of 2025 value. Entry barriers are highest in monolithic arrays, where few firms own a working process, and lowest in MIP chips, where Chinese makers compete on price.
Companies profiled and their roles
| Company | Type | Role in the market |
|---|---|---|
| PlayNitride | Emitter specialist | Micro LED chips, PixeLED display technology and repair tools |
| Jade Bird Display | Emitter specialist | Monolithic microdisplays for AR glasses on a 12-inch reconstructed-wafer platform |
| Aledia | Emitter specialist | 3D nanowire micro LEDs on silicon and the FlexiNova platform |
| Avicena | Interconnect specialist | Micro LED transmitter arrays for LightBundle optical links |
| Ennostar | LED major | Micro LED chips for panel makers (Epistar and Lextar group) |
| Sanan Optoelectronics | LED major | Chips for Chinese fine-pitch wall makers |
| HC Semitek | LED major | Chips for Chinese fine-pitch wall makers |
| Seoul Viosys | LED major | WICOP chip-scale emitters |
| ams OSRAM | LED major | Micro LED research after its 2024 strategy reset |
| AUO | Panel maker | Transparent micro LED tiles and automotive head-up displays |
| Samsung | Device maker | The Wall direct-view displays; emitter sourcing not confirmed |
| Sony | Device maker | Crystal LED direct-view displays; emitter sourcing not confirmed |
Mid-sized markets, not one flagship device, carry micro LED
Credence Research's view is that micro LED has become a real component business with a narrow base, and that its next phase depends less on one flagship device than on several mid-sized markets scaling together. Large walls keep the volume, but the highest-value growth sits in monolithic arrays for AR glasses and optical links for AI clusters. Suppliers that own a working red-emitter or nanowire process, wafer-scale testing and more than one customer group are best placed. The main risk is buyer concentration, as the canceled ams OSRAM project showed. Investors should watch hyperscaler link qualification and AR glasses launches.
How Credence Research valued micro LED emitters
The report uses 2025 as the base year and forecasts to 2035, with CAGR calculated over 2025–2035. Market values come from Credence Research's market model, built application by application from the emitter content of shipped products and checked against chip makers' filed micro LED disclosures and captive emitter value inside panel groups; segment and regional splits are Credence Research estimates. Supporting evidence comes from company announcements, government energy data and EU program records.
Arrays on CMOS and optical links broaden a wall-led market
Through 2035, micro LED emitter demand will broaden from large walls to AR glasses, vehicles and optical links, and value will shift toward monolithic arrays bonded to CMOS. Larger reconstructed wafers, nanowires on silicon and quantum dot color conversion will lower cost per working pixel, while optical interconnect becomes a second core market if hyperscalers qualify micro LED cables. Asia Pacific remains the production center as North America and Europe gain share. The pace depends on transfer yield, red-emitter efficiency and how many buyers commit to volume programs.
Frequently Asked Questions
What was the size of the micro LED market in 2025?
What is the forecast value and CAGR of the micro LED market?
How is the micro LED market different from the micro LED display market?
Which application uses the most micro LED emitters?
Which region leads the micro LED market?
Why are micro LEDs used in optical interconnects?
Who are the main micro LED suppliers?
What holds back micro LED adoption?
Table of Content
Chapter 1 Market Segmentation
- 1.1 Segmentation Framework
- 1.1.1 Product and Service Classification
- 1.1.2 Application and End-Use Classification
- 1.1.3 Technology and Solution Classification
- 1.1.4 Customer and Distribution Channel Classification
- 1.1.5 Geographic Segmentation
- 1.1.6 Market Segment Definitions and Boundaries
- 1.2 By Application
- 1.2.1 Large-Format Displays & TVs
- 1.2.2 AR/VR & Near-Eye Microdisplays
- 1.2.3 Wearables & Mobile Devices
- 1.2.4 Automotive Displays & Lighting
- 1.2.5 Optical Interconnect & Other Non-Display
- 1.3 By Product
- 1.3.1 Micro LED Chips & Dies
- 1.3.2 Monolithic Emitter Arrays
- 1.3.3 Micro LED-in-Package (MIP) Emitters
- 1.3.4 Epitaxial Wafers
Chapter 2 Introduction
- 2.1 Report Objectives and Scope
- 2.2 Product Definition and Industry Terminology
- 2.3 Market Inclusions and Exclusions
- 2.4 Research Process
- 2.4.1 Primary Research and Expert Interviews
- 2.4.2 Secondary Research and Source Review
- 2.4.3 Top-Down and Bottom-Up Estimation
- 2.4.4 Data Triangulation and Verification
- 2.5 Market Size Measurement Basis
- 2.5.1 2025: USD 290.0 million → 2035: USD 3.26 billion
- 2.6 Historical and Forecast Reference Periods
- 2.6.1 Historical Period: 2018-2025
- 2.6.2 Base Year: 2025
- 2.6.3 Forecast Period: 2025-2035
- 2.7 Research Assumptions and Limitations
Chapter 3 Executive Summary
- 3.1 Market Snapshot and Key Findings
- 3.2 Base-Year Market Size, 2025
- 3.3 Forecast Market Size, 2035
- 3.4 Revenue and Volume Growth Outlook
- 3.5 Key Demand and Supply Indicators
- 3.6 Leading Market Segments
- 3.7 Fastest-Growing Market Opportunities
- 3.8 Regional Performance Highlights
- 3.9 Technology and Industry Transformation
- 3.10 Competitive Landscape Summary
- 3.11 Analyst View and Strategic Implications
Chapter 4 Global Micro LED Market Trends and Developments
- 4.1 Historical Industry Development, 2018-2025
- 4.2 Recent Market Trends and Developments
- 4.3 Demand and Customer Behavior Trends
- 4.4 Technology and Product Innovation
- 4.5 Artificial Intelligence, Automation and Digitalization
- 4.6 Local Manufacturing and Supply Chain Realignment
- 4.7 Industry Partnerships, Mergers and Acquisitions
- 4.8 Sustainability and Circular Economy Developments
- 4.9 Government and Private Sector Investment Trends
- 4.10 Emerging Business Models and Commercialization
- 4.11 Industry Developments and Announcements
Chapter 5 Global Micro LED Market Production, Supply and Demand Analysis
- 5.1 Demand Trend and Consumption Analysis, 2018-2025
- 5.2 Demand Forecast, 2025-2035
- 5.3 Production and Output Trend, 2018-2025
- 5.4 Production and Output Forecast, 2025-2035
- 5.5 Installed Capacity and Capacity Utilization
- 5.6 Company-Wise Production Plants and Statistics
- 5.6.1 Installed Production Capacity
- 5.6.2 Actual Production
- 5.6.3 Planned Capacity and Expansion Targets
- 5.7 Supply Chain Structure and Procurement Trends
- 5.8 Supply-Demand Gap and Bottlenecks
- 5.9 Import Dependence and Sourcing Structure
- 5.10 Contract Manufacturing and Outsourcing
- 5.11 Regional Supply and Demand Concentration
Chapter 6 Global Micro LED Market Pricing Analysis
- 6.1 Pricing Structure and Measurement
- 6.2 Historical Pricing Trends, 2018-2025
- 6.3 Pricing Outlook, 2025-2035
- 6.4 Average Selling Price and Unit Economics
- 6.5 Pricing by Product and Market Segment
- 6.6 Geographic Pricing Differences
- 6.7 Key Input, Energy, Labor and Logistics Costs
- 6.8 Contract Pricing and Purchasing Models
- 6.9 Pricing Sensitivity and Competitive Positioning
- 6.10 Price, Margin and Profitability Implications
Chapter 7 Global Micro LED Market Dynamics
- 7.1 Market Growth Drivers
- 7.1.1 Demand-Side Drivers
- 7.1.2 Technology and Innovation Drivers
- 7.1.3 Infrastructure and Investment Drivers
- 7.1.4 Regulatory and Policy Drivers
- 7.2 Market Restraints
- 7.2.1 Cost and Affordability Constraints
- 7.2.2 Technology and Adoption Barriers
- 7.2.3 Supply Chain and Operational Constraints
- 7.3 Market Challenges
- 7.3.1 Competitive Pressure and Margin Erosion
- 7.3.2 Skills, Infrastructure and Implementation Gaps
- 7.4 Emerging Market Opportunities
- 7.5 Market Dynamics Impact and Time-Horizon Assessment
Chapter 8 Global Micro LED Value Chain Analysis
- 8.1 Industry Value Chain Overview
- 8.2 Upstream Suppliers and Critical Inputs
- 8.3 Technology and Component Providers
- 8.4 Manufacturing or Service Delivery
- 8.5 Distribution, Channel Partners and Integrators
- 8.6 Downstream Applications and End Users
- 8.7 Value Addition and Profit Pools
- 8.8 Vertical Integration and Outsourcing
- 8.9 Supplier Concentration and Risk
- 8.10 Supply Chain Localization and Resilience
Chapter 9 Global Micro LED Market Regulations and Policies
- 9.1 Relevant Laws, Standards and Compliance Frameworks
- 9.2 Product, Service, Safety and Quality Requirements
- 9.3 Government Policies, Incentives and Subsidies
- 9.4 Imports, Exports and Trade Barriers
- 9.5 Public Procurement and Local Content Requirements
- 9.6 Environmental and Sustainability Compliance
- 9.7 Upcoming Policy Changes and Market Implications
Chapter 10 Global Micro LED Market Hotspots and Opportunities
- 10.1 Market Opportunity Mapping and Growth Hotspots
- 10.2 High-Growth Applications and Customer Groups
- 10.3 Underserved Markets and White-Space Opportunities
- 10.4 Emerging Technology and Product Opportunities
- 10.5 New Capacity and Investment Hotspots
- 10.6 Market Entry and Expansion Opportunities
- 10.7 Distribution and Partnership Opportunities
- 10.8 Near-Term and Long-Term Commercial Potential
- 10.9 Opportunity Attractiveness and Execution Risks
Chapter 11 Global Micro LED Market Outlook, 2025-2035
- 11.1 Market Size and Analysis
- 11.1.1 Revenue (Market Measurement: 2025: USD 290.0 million → 2035: USD 3.26 billion)
- 11.1.2 Market Volume and Quantity Sold
- 11.1.3 Historical Market Size, 2018-2025
- 11.1.4 Base-Year Market Size, 2025
- 11.2 Market Forecast, 2025-2035
- 11.2.1 Revenue Forecast to 2035
- 11.2.2 Volume Forecast to 2035
- 11.2.3 CAGR and Year-on-Year Growth
- 11.2.4 Incremental Revenue Opportunity
- 11.3 Forecast Assumptions and Scenario Analysis
- 11.3.1 Base-Case Forecast
- 11.3.2 Optimistic and Conservative Scenarios
- 11.3.3 Technology, Pricing and Policy Sensitivities
- 11.4 Market Attractiveness and Growth Outlook
Chapter 12 Global Micro LED Market Segmentation and Outlook
- 12.1 Segmentation Summary and Market Shares, 2025
- 12.2 Largest and Fastest-Growing Segments
- 12.3 By Application - Market Size and Forecast, 2025-2035
- 12.3.1 Segment Definition and Scope
- 12.3.2 Historical Market Size, 2018-2025
- 12.3.3 Revenue Forecast, 2025-2035
- 12.3.4 Volume Forecast, 2025-2035
- 12.3.5 Base-Year Market Share, 2025
- 12.3.6 Segment CAGR and Growth Drivers
- 12.3.7 Subsegment Market Size and Forecast
- 12.3.7.1 Large-Format Displays & TVs
- 12.3.7.2 AR/VR & Near-Eye Microdisplays
- 12.3.7.3 Wearables & Mobile Devices
- 12.3.7.4 Automotive Displays & Lighting
- 12.3.7.5 Optical Interconnect & Other Non-Display
- 12.3.8 Subsegment Pricing and Adoption Trends
- 12.3.9 Leading Suppliers and Competition
- 12.3.10 Regional Demand and Opportunities
- 12.4 By Product - Market Size and Forecast, 2025-2035
- 12.4.1 Segment Definition and Scope
- 12.4.2 Historical Market Size, 2018-2025
- 12.4.3 Revenue Forecast, 2025-2035
- 12.4.4 Volume Forecast, 2025-2035
- 12.4.5 Base-Year Market Share, 2025
- 12.4.6 Segment CAGR and Growth Drivers
- 12.4.7 Subsegment Market Size and Forecast
- 12.4.7.1 Micro LED Chips & Dies
- 12.4.7.2 Monolithic Emitter Arrays
- 12.4.7.3 Micro LED-in-Package (MIP) Emitters
- 12.4.7.4 Epitaxial Wafers
- 12.4.8 Subsegment Pricing and Adoption Trends
- 12.4.9 Leading Suppliers and Competition
- 12.4.10 Regional Demand and Opportunities
- 12.5 Segment Growth Comparison
- 12.6 Segment Attractiveness and Priority Matrix
Chapter 13 Global Micro LED End-Use and Application Market Outlook
- 13.1 End-Use Industry and Customer Demand Structure
- 13.2 Leading Applications and Customer Groups
- 13.3 End-Use Market Size, Share and Forecast
- 13.4 Major End-Use Industry Deep Dives
- 13.4.1 Customer Requirements and Use Cases
- 13.4.2 Demand and Replacement Cycles
- 13.4.3 Technical and Regulatory Considerations
- 13.4.4 Purchasing and Procurement Models
- 13.4.5 Leading Vendors and Distribution Channels
- 13.4.6 Forecast and Commercial Opportunities
- 13.5 Emerging Applications and Cross-Segment Demand
- 13.6 End-Use Industry Investment Priorities
Chapter 14 Global Micro LED Geographic Market Outlook, 2025-2035
- 14.1 Regional Market Size and Share, 2025
- 14.2 Regional Market Forecast, 2025-2035
- 14.3 Regional Pricing, Production and Demand Differences
- 14.4 North America
- 14.4.1 United States
- 14.4.2 Canada
- 14.4.3 Mexico
- 14.5 Europe
- 14.5.1 Germany
- 14.5.2 France
- 14.5.3 Italy
- 14.5.4 United Kingdom
- 14.5.5 Spain
- 14.5.6 Poland
- 14.5.7 Russia
- 14.5.8 Netherlands
- 14.5.9 Belgium
- 14.5.10 Sweden
- 14.5.11 Denmark
- 14.5.12 Norway
- 14.5.13 Rest of Europe
- 14.6 Asia Pacific
- 14.6.1 China
- 14.6.2 India
- 14.6.3 Japan
- 14.6.4 South Korea
- 14.6.5 Thailand
- 14.6.6 Indonesia
- 14.6.7 Vietnam
- 14.6.8 Malaysia
- 14.6.9 Australia
- 14.6.10 Rest of Asia Pacific
- 14.7 Latin America
- 14.7.1 Brazil
- 14.7.2 Argentina
- 14.7.3 Colombia
- 14.7.4 Chile
- 14.7.5 Rest of Latin America
- 14.8 Middle East
- 14.8.1 Saudi Arabia
- 14.8.2 United Arab Emirates
- 14.8.3 Turkey
- 14.8.4 Israel
- 14.8.5 Iran
- 14.8.6 Rest of the Middle East
- 14.9 Africa
- 14.9.1 South Africa
- 14.9.2 Egypt
- 14.9.3 Nigeria
- 14.9.4 Morocco
- 14.9.5 Rest of Africa
- 14.10 Regional Investment, Policy and Supply Chain Differences
- 14.11 Regional Competitive Landscape
- 14.12 Geographic Growth Hotspots
Chapter 15 Global Micro LED Technology, Innovation and Sustainability Outlook
- 15.1 Technology Landscape and Maturity
- 15.2 Product, Process and Service Innovation
- 15.3 AI, Automation and Digital Tools in the Industry
- 15.4 Technology Adoption and Performance Benchmarking
- 15.5 Innovation Pipeline and R&D Investment
- 15.6 Patent and Intellectual Property Trends
- 15.7 Energy Efficiency and Resource Management
- 15.8 Sustainability, Recycling and Circularity
- 15.9 Technology Roadmap, 2025-2035
- 15.10 Risks of Obsolescence and Technology Substitution
Chapter 16 Global Micro LED Market Key Strategic Imperatives
- 16.1 Growth and Market Entry Priorities
- 16.2 High-Return Products and Segments
- 16.3 Pricing, Profitability and Cost Optimization
- 16.4 Technology Investment and Product Differentiation
- 16.5 Supply Chain Localization and Resilience
- 16.6 Distribution and Customer Acquisition
- 16.7 Partnership, Acquisition and Capacity Strategy
- 16.8 Regional Expansion Priorities
- 16.9 Short-, Medium- and Long-Term Actions
Chapter 17 Competition Outlook
- 17.1 Industry Competition Characteristics
- 17.2 Market Structure and Concentration
- 17.3 Market Share and Competitive Positioning, 2025
- 17.4 Company-Wise Revenue and Product Benchmarking
- 17.5 Production and Service Capacity Benchmarking
- 17.6 Technology, Pricing and Differentiation
- 17.7 Regional Footprint and Distribution Strength
- 17.8 Mergers, Acquisitions and Strategic Alliances
- 17.9 New Entrants and Competitive Threats
- 17.10 Porter's Five Forces and Industry Attractiveness
- 17.11 Competitive Outlook, 2025-2035
Chapter 18 Company Profiles
- 18.1 Company Coverage and Selection Criteria
- 18.2 PlayNitride
- 18.2.1 Business Description
- 18.2.2 Company Ownership and Geographic Presence
- 18.2.3 Product and Service Portfolio
- 18.2.4 Manufacturing and Operating Footprint
- 18.2.5 Production Capacity and Expansion Plans
- 18.2.6 Financial Performance and Investment
- 18.2.7 Market Share and Competitive Position
- 18.2.8 Technology and Innovation Capabilities
- 18.2.9 Strategic Alliances or Partnerships
- 18.2.10 Recent Developments
- 18.2.11 Growth Strategy and Outlook
- 18.3 Jade Bird Display
- 18.4 Ennostar
- 18.5 Sanan Optoelectronics
- 18.6 Aledia
- 18.7 Seoul Viosys
- 18.8 ams OSRAM
- 18.9 Avicena
- 18.10 AUO
- 18.11 Samsung
- 18.12 Sony
- 18.13 HC Semitek
- 18.14 Other Relevant Market Participants
Note: Every listed company is profiled on the structure shown under the first company. The company list is preliminary and may change based on research findings, market developments, data availability and client requirements.
Chapter 19 Disclaimer
- 19.1 Research and Forecast Disclaimer
- 19.2 Data Source and Estimation Limitations
Note: The depth of individual sections depends on data availability for this market. Volume, capacity, trade and other unit-based metrics are included where applicable.

