Bioprocess technology market runs on recurring consumables
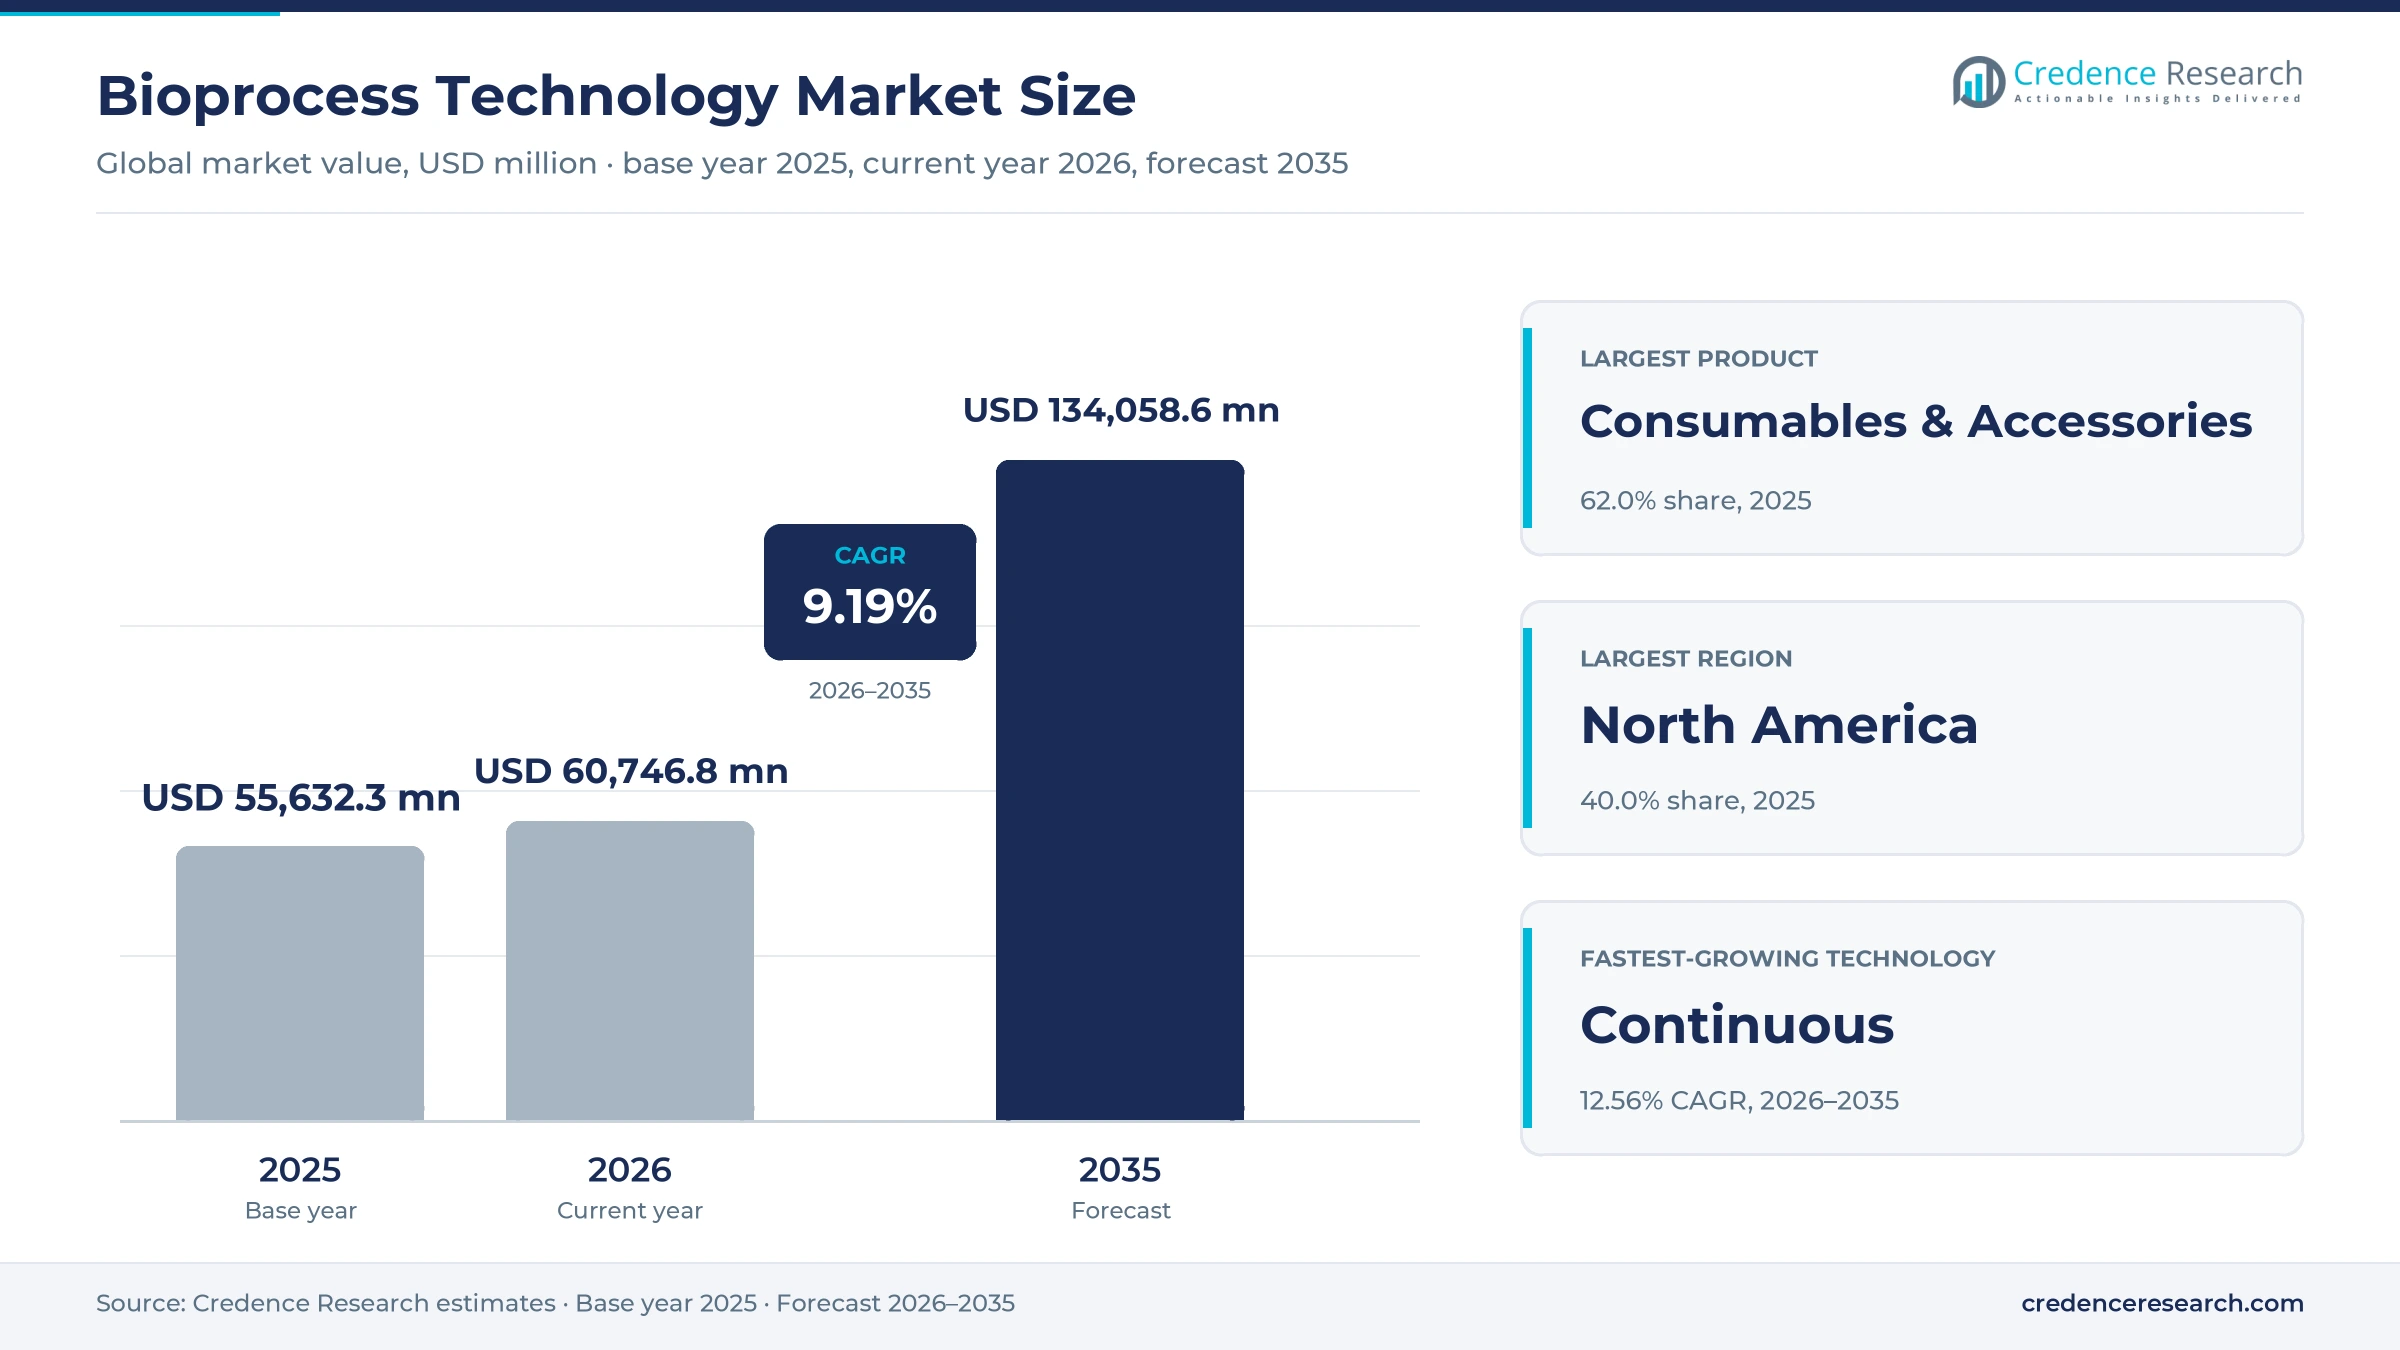
The global bioprocess technology market was valued at USD 55.63 billion in 2025 and is projected to increase from USD 60.75 billion in 2026 to USD 134.06 billion by 2035, registering a CAGR of 9.19% during 2026–2035. Demand comes from biopharmaceutical companies and contract manufacturers that grow cells, harvest proteins and purify drug substance for antibodies, vaccines, recombinant proteins and cell and gene therapies. North America held the largest regional share, 40.0% in 2025, because the region hosts the largest biologics pipelines and many commercial plants. Asia Pacific is the fastest-growing region at 10.38% a year, as South Korea, China, India and Singapore add contract capacity. A regulatory change also supports investment, because the U.S. Food and Drug Administration finalized guidance in December 2024 for its advanced manufacturing technologies designation program. As a result, plant owners have clearer incentives to adopt intensified and continuous processing.
Which tools and processes does this analysis cover?
The analysis counts instruments such as bioreactors, chromatography systems, filtration skids, cell counters and process analyzers, together with consumables such as media, resins, membranes, single-use bags and reagents used to make biologic drugs. Buyers purchase instruments as capital projects, while consumables are bought every batch, which gives suppliers a steady recurring revenue base.
Fill-finish lines, building construction, drug substance sales and contract manufacturing service fees sit outside the scope of this analysis. The value chain runs from raw material and component makers through tool suppliers and distributors to biopharmaceutical companies, contract manufacturers and research institutes.
Bioprocess Technology Market Insights
- The bioprocess technology market grows from USD 55.63 billion in 2025 to USD 134.06 billion by 2035, a 9.19% CAGR driven by antibody, vaccine and cell therapy production.
- North America held 40.0% of global bioprocess tool value in 2025, supported by large biologics pipelines and commercial plants.
- Consumables and accessories led products with 62.0% of 2025 value, while continuous processing grows fastest among technologies at 12.56% a year.
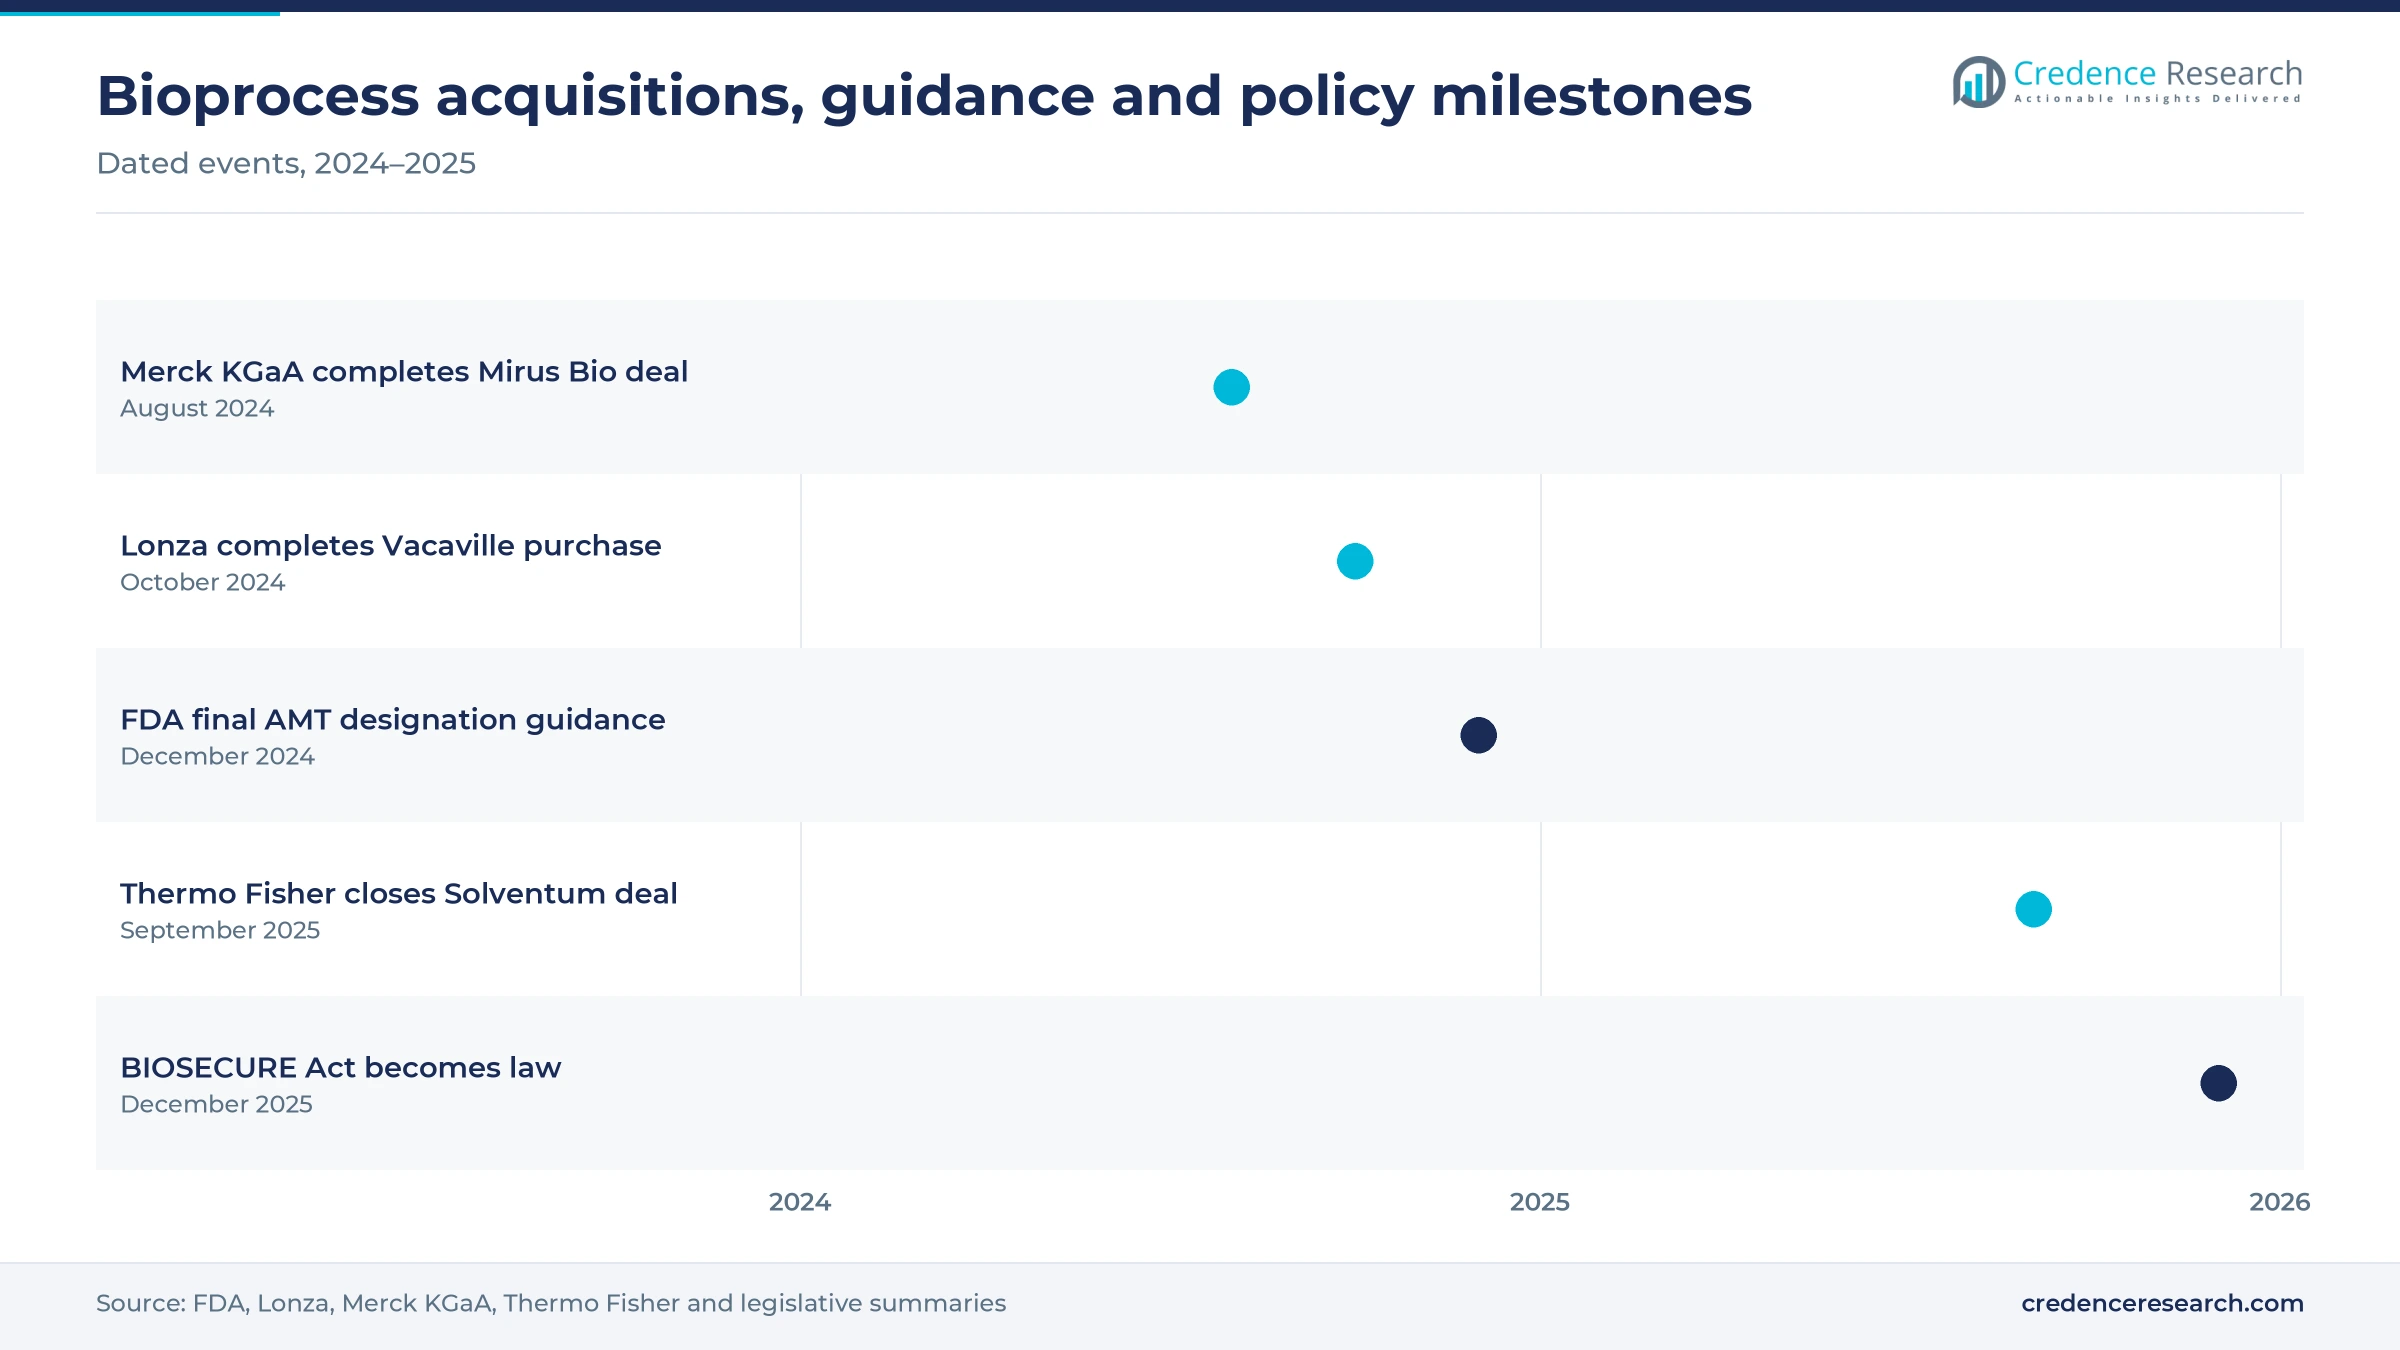
- In December 2024, the U.S. Food and Drug Administration finalized guidance for its advanced manufacturing technologies designation program.
- In September 2025, Thermo Fisher Scientific completed its USD 4.0 billion purchase of a purification and filtration business that serves bioprocessing.
Consumables lead as continuous processing gains pace
Why do consumables outsell instruments every year?
Based on product, the market is categorized into instruments and consumables and accessories. Consumables & Accessories led with a 62.0% share of 2025 value, because media, resins, filters and single-use bags are replaced after every batch or campaign. Consumables also grow fastest at 9.49% a year, as single-use formats replace cleaning and sterilization steps. Instruments remain essential, although buyers replace bioreactors and chromatography skids only every several years.
Where does most spending sit across the production train?
Based on process type, the market is categorized into upstream processing and downstream processing. Downstream Processing led with a 54.0% share of 2025 value, because chromatography resins, viral filtration and membranes carry high costs per gram of protein. Upstream Processing grows fastest at 9.56% a year, as higher cell densities and new cell culture media formulations raise titers. This shift then increases the purification load on downstream steps.
Can continuous processing displace fed-batch production?
Based on technology, the market is categorized into batch, fed-batch and continuous processing. Fed-Batch led with a 58.0% share of 2025 value, because most approved antibodies were developed and validated with fed-batch cell culture. Continuous processing grows fastest at 12.56% a year, as perfusion and connected purification shrink plant footprints. However, regulatory filings tie each product to its validated process, which slows conversion of existing commercial lines.
Which biologic modalities consume the most bioprocess tools?
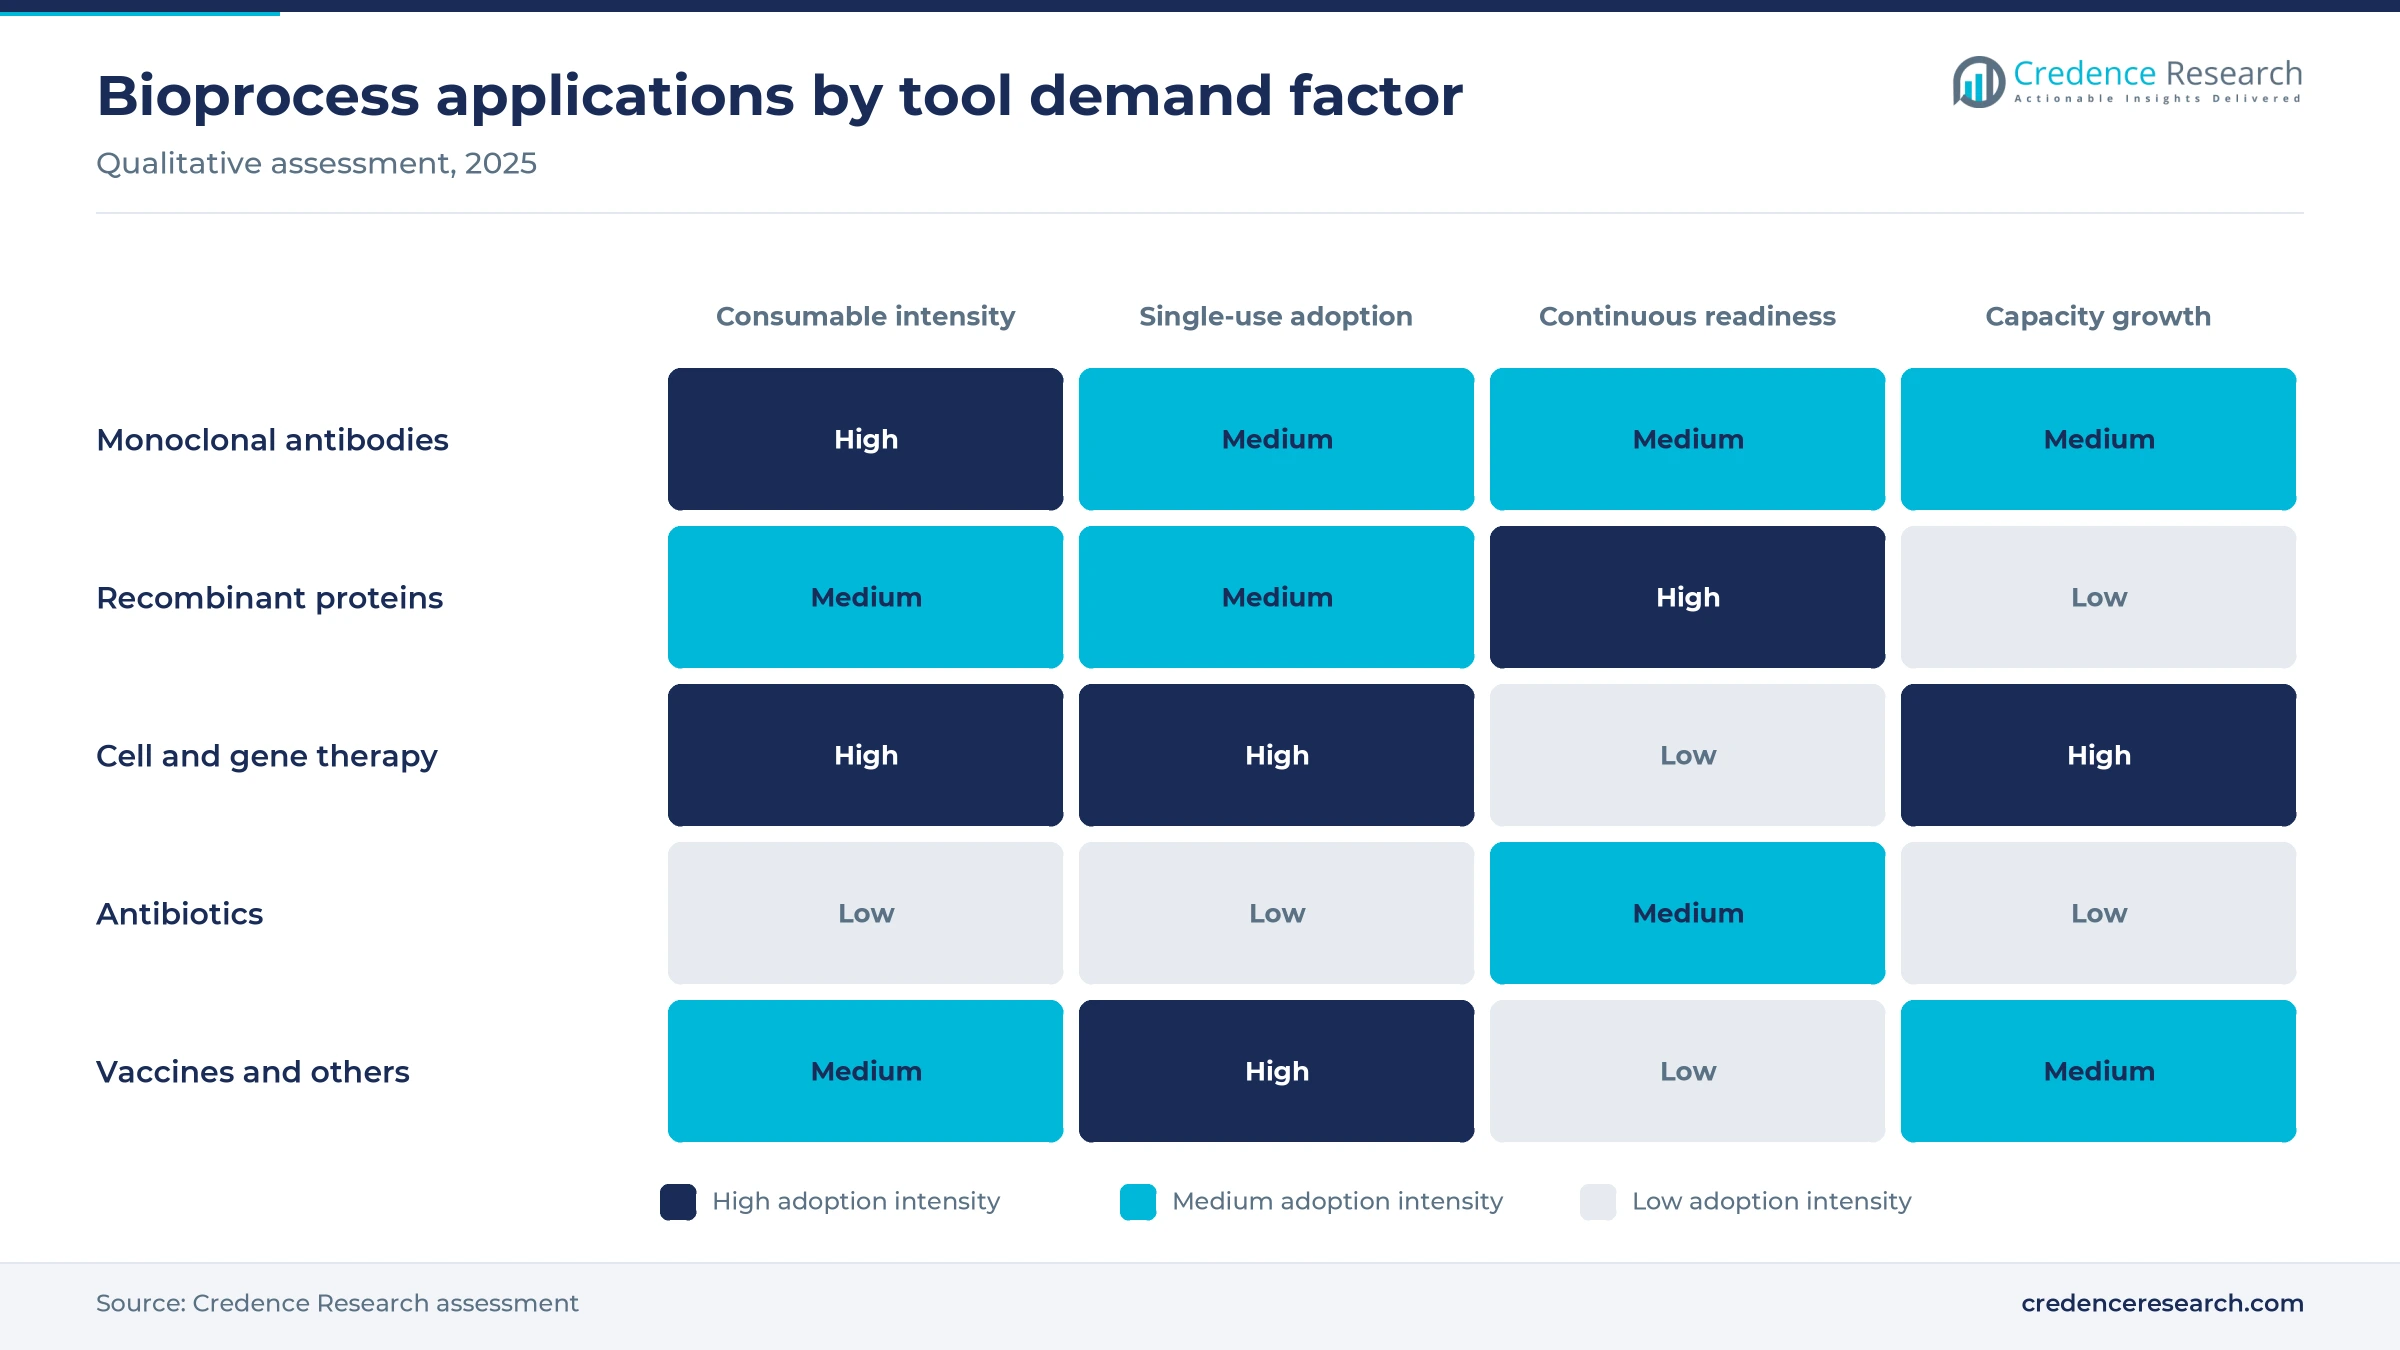
Based on application, the market is categorized into recombinant proteins, monoclonal antibodies, cell and gene therapy products, antibiotics and other applications. Monoclonal Antibodies led with a 46.0% share of 2025 value, because large antibody volumes require extensive cell culture and protein A purification. Cell & Gene Therapy Products grow fastest at 12.11% a year, as viral vector and cell expansion steps move from clinical to commercial scale. Antibiotics remain a smaller and mature use with limited new plant investment.
Why are contract manufacturers adding capacity fastest?
Based on end user, the market is categorized into biopharmaceutical companies, contract manufacturing organizations, academic and research institutes and other end users. Biopharmaceutical Companies led with a 58.0% share of 2025 value, because drug owners still run most commercial biologics plants. Contract Manufacturing Organizations grow fastest at 10.35% a year, as drug developers outsource more production to contract biologics manufacturers with large stainless and single-use capacity.
| Segment Group | Leading Sub-segment | Share, 2025 | Fastest-growing Sub-segment | CAGR, 2026–2035 |
|---|---|---|---|---|
| By Product | Consumables & Accessories | 62.0% | Consumables & Accessories | 9.49% |
| By Process Type | Downstream Processing | 54.0% | Upstream Processing | 9.56% |
| By Technology | Fed-Batch | 58.0% | Continuous | 12.56% |
| By Application | Monoclonal Antibodies | 46.0% | Cell & Gene Therapy Products | 12.11% |
| By End User | Biopharmaceutical Companies | 58.0% | Contract Manufacturing Organizations | 10.35% |
Request a Free Sample
Fill in your details and we'll send you a free sample report.
- Sample data tables & charts
- Research methodology
Antibody pipelines and CDMO capacity lift equipment demand
How do antibody and biosimilar pipelines sustain tool demand?
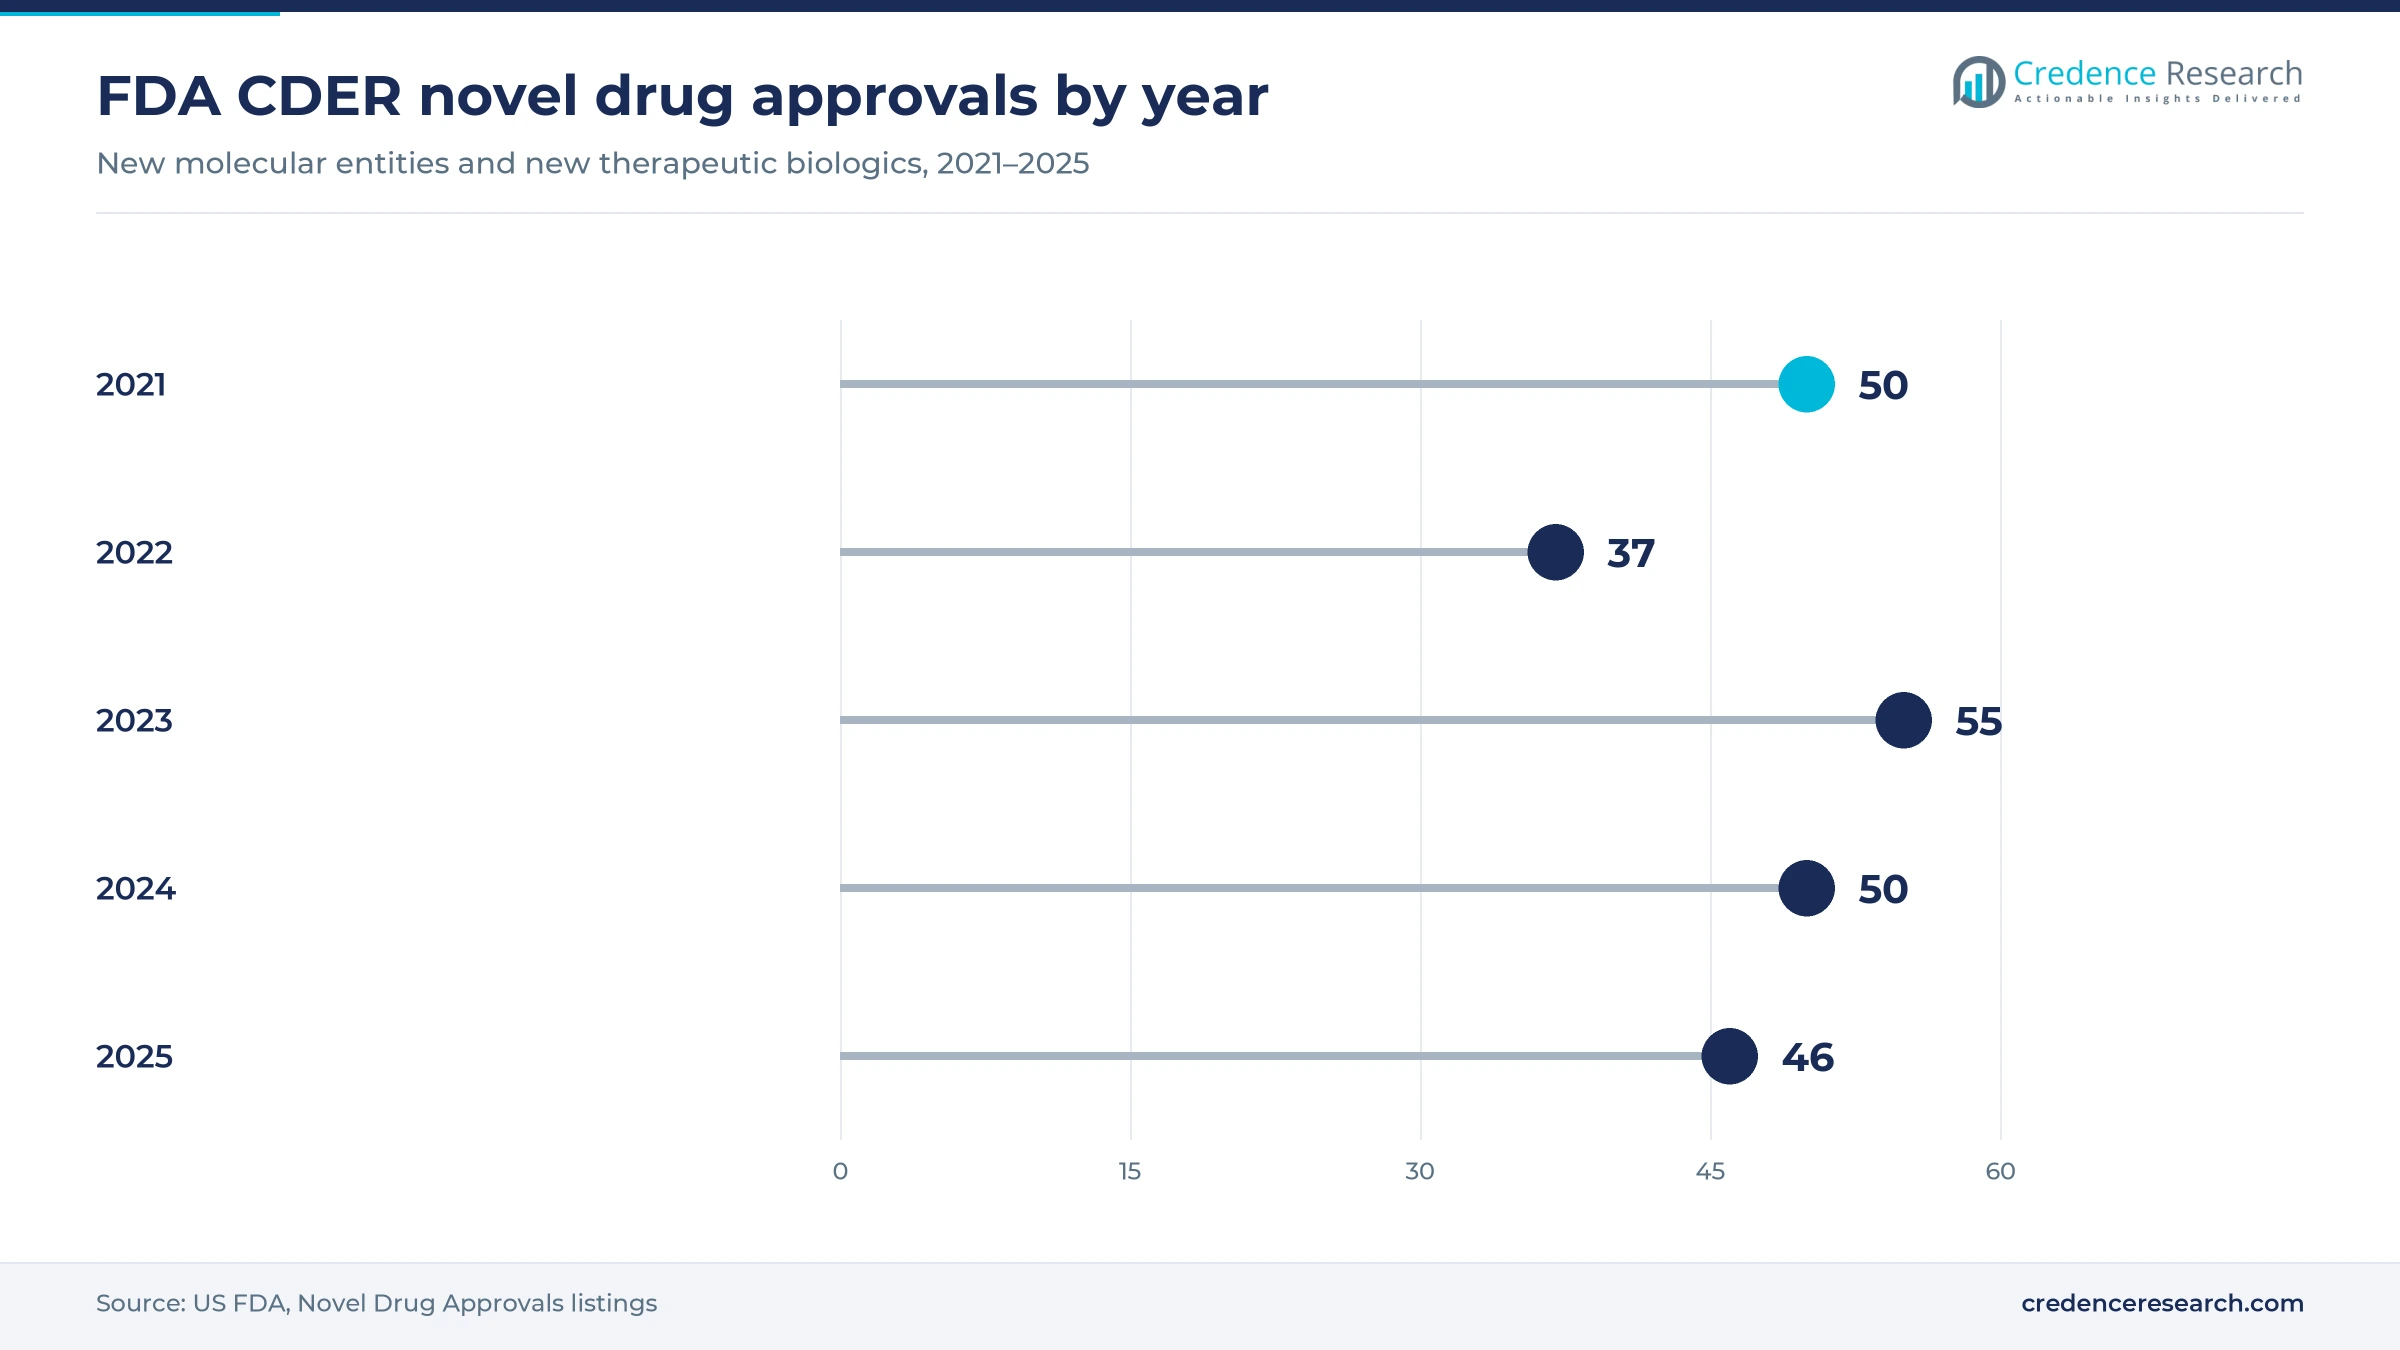
Antibody production is the largest source of demand, because each commercial antibody needs cell culture, harvest, protein A capture and several polishing steps. Patent expiries are adding biosimilars that need low-cost plants to compete on price. According to the U.S. Department of Health and Human Services, biologics made up 5% of U.S. prescriptions but 51% of drug spending in 2024, which keeps capital flowing into biologic capacity. The FDA also approved 50 novel drugs in 2024 and 46 in 2025. As a result, each new launch adds steady orders for resins, filters and single-use bags.
Why is contract manufacturing capacity expanding so quickly?
Contract manufacturers are buying more equipment, because drug owners prefer to rent capacity rather than build plants for uncertain products. In October 2024, Lonza acquired the Vacaville site from Roche, which brought about 330,000 liters of bioreactor capacity into its contract network for USD 1.2 billion. Such deals lead to upgrade programs for purification, analytics and single-use systems. In turn, contract manufacturers become a larger share of tool demand each year, because outsourcing lets drug owners avoid building plants for products that may fail in late-stage trials.
How are cell and gene therapies changing equipment needs?
Cell and gene therapies need different tools, because they rely on viral vectors, transfection reagents and closed cell processing systems. In August 2024, Merck KGaA, through MilliporeSigma, acquired Mirus Bio for USD 600 million, a maker of transfection reagents used in viral vector production. This purchase shows how toolmakers are adding inputs for advanced therapies. As a result, demand grows for small-scale bioreactors, closed systems and analytics designed for patient-specific batches.
Do regulators reward investment in advanced manufacturing?
Regulatory incentives support new technology, because agencies want more reliable supply and fewer quality failures. In December 2024, the U.S. Food and Drug Administration finalized guidance for its advanced manufacturing technologies designation program, which finalized a December 2023 draft and offers early engagement for qualifying methods. Continuous processing and real-time release testing are among the methods that manufacturers may bring to the agency. This clarity encourages plant owners to fund process intensification projects over the next decade.
Intensified processing and supplier consolidation advance
Is perfusion and connected processing moving into commercial plants?
Intensified processing is spreading from pilot to commercial use, because perfusion bioreactors produce more protein per liter of capacity. Manufacturers are linking upstream perfusion to multicolumn chromatography, which cuts hold steps and reduces plant size. This shift is strongest for new products, since existing products would need costly regulatory changes. As a result, continuous production tools gain share in new facilities in the United States, Europe and Asia.
How is supplier consolidation widening product portfolios?
Toolmakers are buying adjacent businesses, because customers prefer suppliers that cover more of the production train. In September 2025, Thermo Fisher Scientific acquired the Solventum purification and filtration business for about USD 4.0 billion. The deal added membranes and filters used in bioprocessing to its life sciences portfolio. In turn, larger suppliers can bundle resins, filters, bags and media into single supply agreements.
Where can supplier localization open new demand?
Localized supply is a clear opening for toolmakers, because buyers now want second sources and regional stock after past shortages. In December 2025, the BIOSECURE Act became law through the fiscal 2026 defense authorization act, which restricts U.S. federal procurement involving biotechnology companies of concern, with a fuller list due by December 2026. Drug developers with federal contracts may therefore shift work to other contract manufacturers. This reshoring creates demand for new equipment in the United States, Europe, India and South Korea.
Can digital process control create a premium tool segment?
Digital process control is a growing opening, because plants need real-time data to run continuous and intensified processes safely. Inline sensors, Raman probes and process analytical technology let operators adjust feeds and detect drift before batches fail, which protects high-value batches from loss. The December 2024 FDA guidance on advanced manufacturing gives these methods a clearer review path. Suppliers that combine hardware with control software can charge more and lock in long service contracts. As a result, analytics and automation add value even in plants that keep fed-batch production.
Cost, validation burden and supply policy slow adoption
Why does process validation slow equipment changes?
Validation burden is the main barrier to change, because every approved biologic is tied to a defined manufacturing process. Switching a resin, filter or bioreactor type often requires comparability studies and a regulatory filing in each market where the product is sold. Many plant owners therefore keep legacy equipment for the full commercial life of a product, often well beyond 2035 for products launched this decade. This caution slows replacement cycles, even when newer tools would lower the cost of each gram produced.
How do high capital costs affect smaller developers?
High capital costs limit smaller buyers, because a commercial biologics plant requires large bioreactors, purification trains and clean rooms. Start-ups and academic groups often cannot fund this equipment and depend on contract manufacturers for clinical and commercial supply. Funding cycles for young biotechnology companies also shift orders from one year to the next, which makes demand uneven. As a result, instrument sales swing more than consumable sales across the forecast period, and suppliers lean on recurring consumables for stability.
Do single-use plastics raise waste and supply concerns?
Single-use systems raise waste and supply concerns, because bags, tubing and connectors are discarded after each batch. Plants must manage plastic waste and secure enough film, connectors and gamma irradiation capacity for sterilization of every assembly. Supply gaps during the 2020 and 2021 demand spike showed how lead times for single-use parts can stretch for months. In turn, buyers ask for dual sourcing, regional stock and standard connectors before they commit new plants to single-use designs.
Why is skilled labor a constraint on new plants?
Skilled labor shortages slow new plants, because bioprocess operators, validation engineers and quality staff need years of training. New facilities in the United States, Ireland, South Korea and Singapore compete for the same small pool of specialists. Delays in hiring push back plant start dates, equipment qualification and the first commercial batches. As a result, suppliers that offer operator training, automation and remote technical support gain an advantage with buyers that are opening their first large plants.
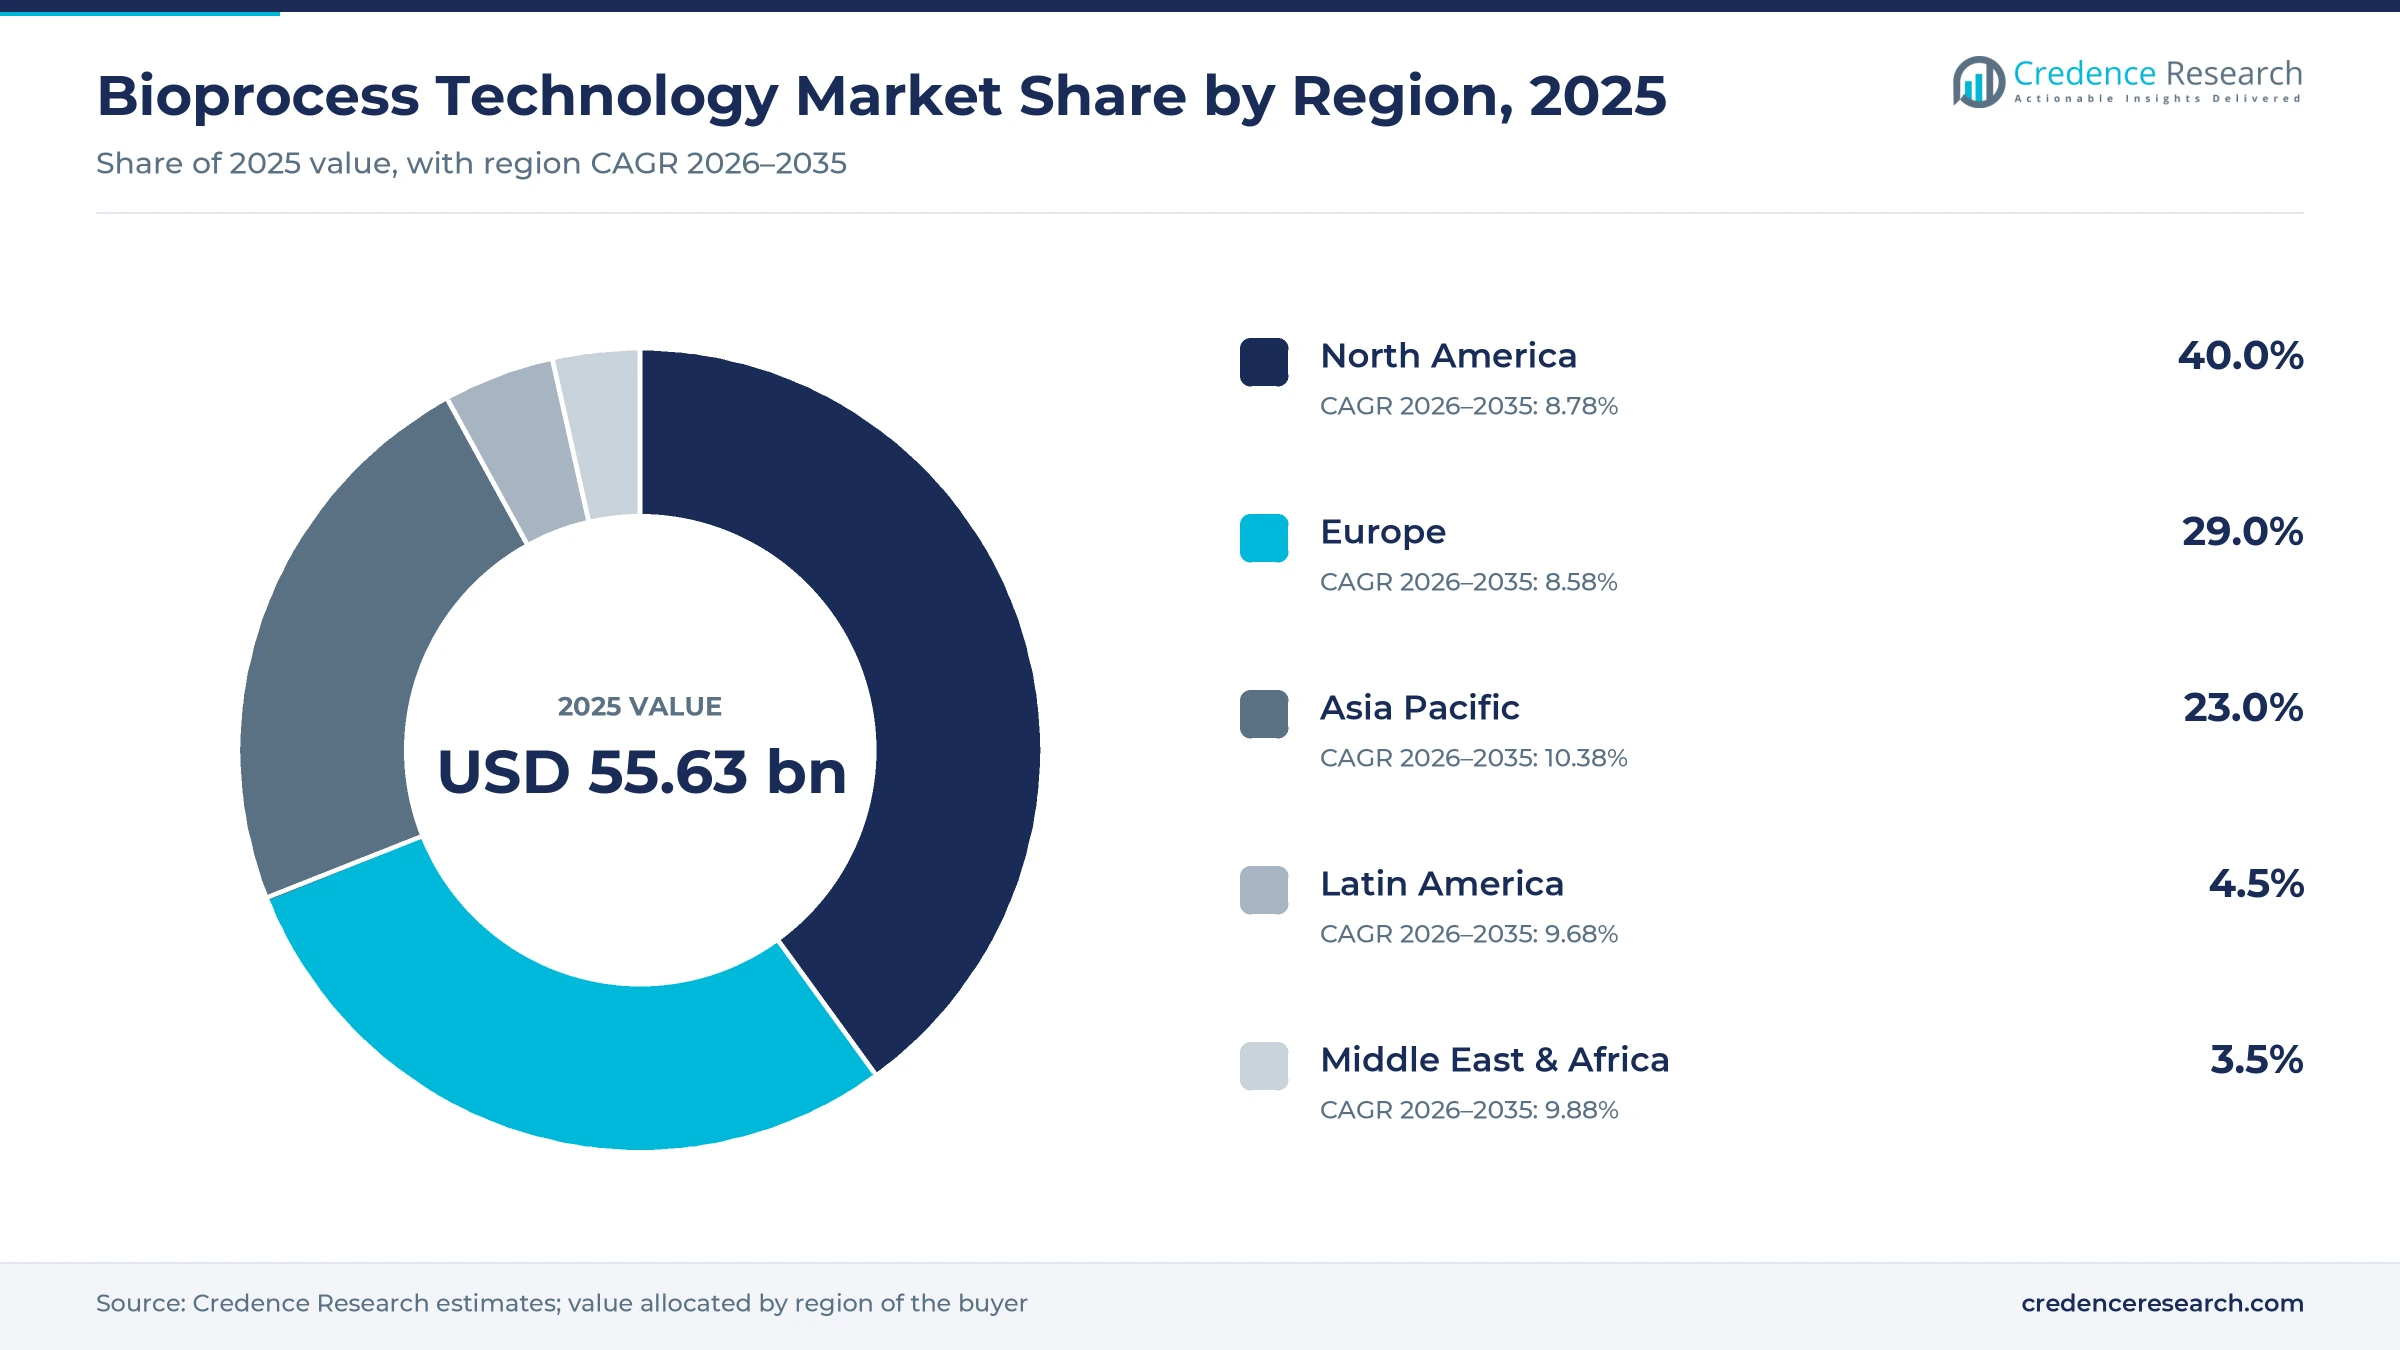
North America leads as Asia Pacific adds biologics plants
| Region | Value, 2025 (USD billion) | Share, 2025 | CAGR, 2026–2035 |
|---|---|---|---|
| North America | 22.25 | 40.0% | 8.78% |
| Europe | 16.13 | 29.0% | 8.58% |
| Asia Pacific | 12.80 | 23.0% | 10.38% |
| Latin America | 2.50 | 4.5% | 9.68% |
| Middle East & Africa | 1.95 | 3.5% | 9.88% |
Why does North America hold the largest regional share?
North America held a 40.0% share of 2025 value and grows at 8.78% a year through 2035. The United States hosts the largest biologics pipeline and many commercial antibody plants, which drives repeat purchases of media, resins and filters. Reshoring policy and contract capacity additions, such as the 330,000 liter Lonza site in California acquired in 2024, support new equipment orders. However, a mature installed base keeps regional growth slightly below the global rate, because many plants already run validated fed-batch lines.
How fast is Asia Pacific adding biologics capacity?
Asia Pacific held a 23.0% share of 2025 value and is the fastest-growing region at 10.38% a year. South Korea hosts some of the largest contract biologics plants, and Samsung Biologics plans total capacity of 1,324,000 liters by 2032, while China, India and Singapore are adding antibody and biosimilar capacity. Lower construction costs and government support attract many new projects to the region. As a result, the region buys a rising share of bioreactors, resins and single-use systems, and local suppliers of media and bags are expanding to serve these plants.
What shapes demand across Europe?
Europe held a 29.0% share of 2025 value and grows at 8.58% a year through 2035. Germany, Switzerland, Ireland, Denmark and the United Kingdom host major biologics plants and 3 profiled German toolmakers, Sartorius, Merck KGaA and Eppendorf. European regulators accept advanced manufacturing methods, which supports early use of continuous processing in new facilities. However, high energy and labor costs slow new plant construction compared with Asia, so much of the regional spending goes to upgrades.
Where is Latin America adding demand?
Latin America held a 4.5% share of 2025 value and grows at 9.68% a year through 2035. Brazil and Mexico lead regional demand, where public laboratories and private producers make vaccines, insulin and biosimilars. Technology transfer agreements with multinational drug makers bring new bioreactors and purification lines into the region.
What limits growth in the Middle East and Africa?
The Middle East and Africa held a 3.5% share of 2025 value and grows at 9.88% a year through 2035. Saudi Arabia, the United Arab Emirates and South Africa are funding local vaccine and biologics production to reduce import reliance. However, small plant sizes and limited trained staff keep regional spending modest.
Acquisitions, guidance and policy milestones since 2024
| Development | Status and market relevance |
|---|---|
| In October 2024, Lonza completed its USD 1.2 billion acquisition of the Vacaville biologics site from Roche. | Completed; adds about 330,000 liters of bioreactor capacity to a contract network |
| In December 2024, the U.S. Food and Drug Administration finalized guidance for its advanced manufacturing technologies designation program. | Final guidance; supports adoption of continuous and intensified processing |
| In September 2025, Thermo Fisher Scientific completed its acquisition of the Solventum purification and filtration business. | Completed; expands bioprocess filtration and membrane supply |
| In November 2025, Samsung Biologics completed the spin-off of its investment and subsidiary unit into Samsung Epis Holdings to operate as a pure-play contract manufacturer. | Completed; sharpens focus on contract capacity planned to reach 1,324,000 liters by 2032 |
| In December 2025, the BIOSECURE Act became law through the fiscal 2026 National Defense Authorization Act. | Enacted; restricts U.S. federal procurement involving biotechnology companies of concern |
Single-use, sensors and continuous systems shape plants
- Single-use bioreactors and assemblies remove cleaning and sterilization steps, which shortens changeover time between products and lets contract manufacturers run several clients in one suite.
- Perfusion and continuous chromatography raise output per liter of capacity, which lets new plants run with smaller footprints and lower resin use per gram of protein.
- Process analytical technology such as inline Raman and capacitance probes tracks cell growth and product quality in real time, which supports real-time release testing.
- Closed and automated cell processing systems reduce manual handling in cell therapy production, which lowers contamination risk and cuts the labor needed for each patient batch.
Need a Custom Version of This Report?
Tailor the scope, geography, or segments to your exact requirements.
- Custom geography or segment scope
- Direct access to our analyst team
Toolmakers compete on breadth, supply and plant integration
Competition centers on a group of large toolmakers that supply most of the production train, along with specialists in instruments and analytics. The 4 full-line suppliers, Thermo Fisher Scientific, Danaher through Cytiva, Sartorius and Merck KGaA, compete across media, bioreactors, chromatography and filtration, and each has used acquisitions to widen its portfolio. Lonza and Roche act as large buyers and operators of capacity, while Eppendorf supplies benchtop and pilot bioreactors used in process development. Bio-Rad Laboratories and Agilent Technologies supply chromatography resins and analytical instruments, and Getinge and Advanced Instruments serve bioreactor and process analytics niches. The 12 companies profiled below span full-line suppliers, specialists and operators. However, validated processes make it hard for buyers to switch suppliers once a product is approved, which protects incumbents.
Companies profiled and their roles in this market
| Company | Type | Role in the market |
|---|---|---|
| Thermo Fisher Scientific Inc. | Full-line supplier | Media, single-use systems and filtration after the Solventum deal |
| Danaher Corporation | Full-line supplier | Parent of Cytiva and Pall bioprocess businesses |
| Cytiva (GE Healthcare Life Sciences) | Full-line supplier | Chromatography resins, systems and single-use technology |
| Sartorius AG | Full-line supplier | Bioreactors, filters, single-use bags and process analytics |
| Merck KGaA | Full-line supplier | Filtration, resins, media and Mirus Bio transfection reagents |
| Lonza Group AG | Contract manufacturer | Large-scale biologics capacity including Vacaville |
| F. Hoffmann-La Roche Ltd | Biopharmaceutical operator | Major buyer of antibody production equipment |
| Eppendorf SE | Instrument specialist | Benchtop and pilot bioreactors for process development |
| Bio-Rad Laboratories Inc. | Specialist | Process chromatography resins and analytics |
| Agilent Technologies Inc. | Analytics specialist | Analytical instruments for process and quality testing |
| Getinge AB | Equipment specialist | Bioreactors and sterile processing equipment |
| Advanced Instruments LLC | Analytics specialist | Osmometry and cell line analytics for bioprocessing |
Consumable pull-through outpaces new plant spending
Credence Research's view is that recurring consumables will drive most value in bioprocess technology through 2035, because every new batch consumes media, resins, filters and single-use assemblies. The overall market grows at 9.19% a year, supported by antibody volumes, biosimilars and the scale-up of cell and gene therapies. Contract manufacturers will add capacity faster than drug owners, which shifts purchasing power toward large outsourcing networks. Suppliers with broad portfolios, regional stock and digital process control are best placed to win long supply agreements.
How Credence Research sized biomanufacturing tool spending
The report uses 2025 as the base year and 2026 to 2035 as the forecast period. Market values come from the Credence Research model, which builds spending by product, process type, technology, application and end user. Regional and segment splits are Credence Research estimates informed by regulator guidance, U.S. Food and Drug Administration approval records, company press releases and public legislative summaries. No primary interviews or surveys were used in preparing this edition of the report.
Biomanufacturing tool spending outlook to 2035
By 2035, the bioprocess technology market is projected to reach USD 134.06 billion, with growth led by consumables, contract manufacturers and Asia Pacific capacity. Fed-batch production will remain the core of commercial antibody manufacturing, while continuous processing takes a rising share of new plants. Cell and gene therapy tools will grow from a small base as more products reach commercial scale. North America keeps the largest value, while Asia Pacific adds the most new capacity. As a result, advantage will depend on portfolio breadth, supply security and process data.
Frequently Asked Questions
How big is the global bioprocess technology market?
Which product type leads bioprocess technology spending?
Which region leads bioprocess technology demand?
Which processing technology grows fastest?
Which application uses the most bioprocess tools?
How did FDA guidance affect bioprocess investment?
Who are the leading bioprocess technology companies?
What restrains growth in bioprocess technology?
Table of Content
Chapter 1 Market Segmentation
- 1.1 Segmentation Framework
- 1.1.1 Product and Service Classification
- 1.1.2 Application and End-Use Classification
- 1.1.3 Technology and Solution Classification
- 1.1.4 Customer and Distribution Channel Classification
- 1.1.5 Geographic Segmentation
- 1.1.6 Market Segment Definitions and Boundaries
- 1.2 By Product
- 1.2.1 Instruments
- 1.2.2 Consumables & Accessories
- 1.3 By Process Type
- 1.3.1 Upstream Processing
- 1.3.2 Downstream Processing
- 1.4 By Technology
- 1.4.1 Batch
- 1.4.2 Fed-Batch
- 1.4.3 Continuous
- 1.5 By Application
- 1.5.1 Monoclonal Antibodies
- 1.5.2 Recombinant Proteins
- 1.5.3 Cell & Gene Therapy Products
- 1.5.4 Antibiotics
- 1.5.5 Other Applications
- 1.6 By End User
- 1.6.1 Biopharmaceutical Companies
- 1.6.2 Contract Manufacturing Organizations
- 1.6.3 Academic & Research Institutes
- 1.6.4 Other End Users
Chapter 2 Introduction
- 2.1 Report Objectives and Scope
- 2.2 Product Definition and Industry Terminology
- 2.3 Market Inclusions and Exclusions
- 2.4 Research Process
- 2.4.1 Primary Research and Expert Interviews
- 2.4.2 Secondary Research and Source Review
- 2.4.3 Top-Down and Bottom-Up Estimation
- 2.4.4 Data Triangulation and Verification
- 2.5 Market Size Measurement Basis
- 2.5.1 2025: USD 55.63 billion → 2035: USD 134.06 billion
- 2.6 Historical and Forecast Reference Periods
- 2.6.1 Historical Period: 2018-2025
- 2.6.2 Base Year: 2025
- 2.6.3 Forecast Period: 2025-2035
- 2.7 Research Assumptions and Limitations
Chapter 3 Executive Summary
- 3.1 Market Snapshot and Key Findings
- 3.2 Base-Year Market Size, 2025
- 3.3 Forecast Market Size, 2035
- 3.4 Revenue and Volume Growth Outlook
- 3.5 Key Demand and Supply Indicators
- 3.6 Leading Market Segments
- 3.7 Fastest-Growing Market Opportunities
- 3.8 Regional Performance Highlights
- 3.9 Technology and Industry Transformation
- 3.10 Competitive Landscape Summary
- 3.11 Analyst View and Strategic Implications
Chapter 4 Global Bioprocess Technology Market Trends and Developments
- 4.1 Historical Industry Development, 2018-2025
- 4.2 Recent Market Trends and Developments
- 4.3 Demand and Customer Behavior Trends
- 4.4 Technology and Product Innovation
- 4.5 Artificial Intelligence, Automation and Digitalization
- 4.6 Local Manufacturing and Supply Chain Realignment
- 4.7 Industry Partnerships, Mergers and Acquisitions
- 4.8 Sustainability and Circular Economy Developments
- 4.9 Government and Private Sector Investment Trends
- 4.10 Emerging Business Models and Commercialization
- 4.11 Industry Developments and Announcements
Chapter 5 Global Bioprocess Technology Market Production, Supply and Demand Analysis
- 5.1 Demand Trend and Consumption Analysis, 2018-2025
- 5.2 Demand Forecast, 2025-2035
- 5.3 Production and Output Trend, 2018-2025
- 5.4 Production and Output Forecast, 2025-2035
- 5.5 Installed Capacity and Capacity Utilization
- 5.6 Company-Wise Production Plants and Statistics
- 5.6.1 Installed Production Capacity
- 5.6.2 Actual Production
- 5.6.3 Planned Capacity and Expansion Targets
- 5.7 Supply Chain Structure and Procurement Trends
- 5.8 Supply-Demand Gap and Bottlenecks
- 5.9 Import Dependence and Sourcing Structure
- 5.10 Contract Manufacturing and Outsourcing
- 5.11 Regional Supply and Demand Concentration
Chapter 6 Global Bioprocess Technology Market Pricing Analysis
- 6.1 Pricing Structure and Measurement
- 6.2 Historical Pricing Trends, 2018-2025
- 6.3 Pricing Outlook, 2025-2035
- 6.4 Average Selling Price and Unit Economics
- 6.5 Pricing by Product and Market Segment
- 6.6 Geographic Pricing Differences
- 6.7 Key Input, Energy, Labor and Logistics Costs
- 6.8 Contract Pricing and Purchasing Models
- 6.9 Pricing Sensitivity and Competitive Positioning
- 6.10 Price, Margin and Profitability Implications
Chapter 7 Global Bioprocess Technology Market Dynamics
- 7.1 Market Growth Drivers
- 7.1.1 Demand-Side Drivers
- 7.1.2 Technology and Innovation Drivers
- 7.1.3 Infrastructure and Investment Drivers
- 7.1.4 Regulatory and Policy Drivers
- 7.2 Market Restraints
- 7.2.1 Cost and Affordability Constraints
- 7.2.2 Technology and Adoption Barriers
- 7.2.3 Supply Chain and Operational Constraints
- 7.3 Market Challenges
- 7.3.1 Competitive Pressure and Margin Erosion
- 7.3.2 Skills, Infrastructure and Implementation Gaps
- 7.4 Emerging Market Opportunities
- 7.5 Market Dynamics Impact and Time-Horizon Assessment
Chapter 8 Global Bioprocess Technology Value Chain Analysis
- 8.1 Industry Value Chain Overview
- 8.2 Upstream Suppliers and Critical Inputs
- 8.3 Technology and Component Providers
- 8.4 Manufacturing or Service Delivery
- 8.5 Distribution, Channel Partners and Integrators
- 8.6 Downstream Applications and End Users
- 8.7 Value Addition and Profit Pools
- 8.8 Vertical Integration and Outsourcing
- 8.9 Supplier Concentration and Risk
- 8.10 Supply Chain Localization and Resilience
Chapter 9 Global Bioprocess Technology Market Regulations and Policies
- 9.1 Relevant Laws, Standards and Compliance Frameworks
- 9.2 Product, Service, Safety and Quality Requirements
- 9.3 Government Policies, Incentives and Subsidies
- 9.4 Imports, Exports and Trade Barriers
- 9.5 Public Procurement and Local Content Requirements
- 9.6 Environmental and Sustainability Compliance
- 9.7 Upcoming Policy Changes and Market Implications
Chapter 10 Global Bioprocess Technology Market Hotspots and Opportunities
- 10.1 Market Opportunity Mapping and Growth Hotspots
- 10.2 High-Growth Applications and Customer Groups
- 10.3 Underserved Markets and White-Space Opportunities
- 10.4 Emerging Technology and Product Opportunities
- 10.5 New Capacity and Investment Hotspots
- 10.6 Market Entry and Expansion Opportunities
- 10.7 Distribution and Partnership Opportunities
- 10.8 Near-Term and Long-Term Commercial Potential
- 10.9 Opportunity Attractiveness and Execution Risks
Chapter 11 Global Bioprocess Technology Market Outlook, 2025-2035
- 11.1 Market Size and Analysis
- 11.1.1 Revenue (Market Measurement: 2025: USD 55.63 billion → 2035: USD 134.06 billion)
- 11.1.2 Market Volume and Quantity Sold
- 11.1.3 Historical Market Size, 2018-2025
- 11.1.4 Base-Year Market Size, 2025
- 11.2 Market Forecast, 2025-2035
- 11.2.1 Revenue Forecast to 2035
- 11.2.2 Volume Forecast to 2035
- 11.2.3 CAGR and Year-on-Year Growth
- 11.2.4 Incremental Revenue Opportunity
- 11.3 Forecast Assumptions and Scenario Analysis
- 11.3.1 Base-Case Forecast
- 11.3.2 Optimistic and Conservative Scenarios
- 11.3.3 Technology, Pricing and Policy Sensitivities
- 11.4 Market Attractiveness and Growth Outlook
Chapter 12 Global Bioprocess Technology Market Segmentation and Outlook
- 12.1 Segmentation Summary and Market Shares, 2025
- 12.2 Largest and Fastest-Growing Segments
- 12.3 By Product - Market Size and Forecast, 2025-2035
- 12.3.1 Segment Definition and Scope
- 12.3.2 Historical Market Size, 2018-2025
- 12.3.3 Revenue Forecast, 2025-2035
- 12.3.4 Volume Forecast, 2025-2035
- 12.3.5 Base-Year Market Share, 2025
- 12.3.6 Segment CAGR and Growth Drivers
- 12.3.7 Subsegment Market Size and Forecast
- 12.3.7.1 Instruments
- 12.3.7.2 Consumables & Accessories
- 12.3.8 Subsegment Pricing and Adoption Trends
- 12.3.9 Leading Suppliers and Competition
- 12.3.10 Regional Demand and Opportunities
- 12.4 By Process Type - Market Size and Forecast, 2025-2035
- 12.4.1 Segment Definition and Scope
- 12.4.2 Historical Market Size, 2018-2025
- 12.4.3 Revenue Forecast, 2025-2035
- 12.4.4 Volume Forecast, 2025-2035
- 12.4.5 Base-Year Market Share, 2025
- 12.4.6 Segment CAGR and Growth Drivers
- 12.4.7 Subsegment Market Size and Forecast
- 12.4.7.1 Upstream Processing
- 12.4.7.2 Downstream Processing
- 12.4.8 Subsegment Pricing and Adoption Trends
- 12.4.9 Leading Suppliers and Competition
- 12.4.10 Regional Demand and Opportunities
- 12.5 By Technology - Market Size and Forecast, 2025-2035
- 12.5.1 Segment Definition and Scope
- 12.5.2 Historical Market Size, 2018-2025
- 12.5.3 Revenue Forecast, 2025-2035
- 12.5.4 Volume Forecast, 2025-2035
- 12.5.5 Base-Year Market Share, 2025
- 12.5.6 Segment CAGR and Growth Drivers
- 12.5.7 Subsegment Market Size and Forecast
- 12.5.7.1 Batch
- 12.5.7.2 Fed-Batch
- 12.5.7.3 Continuous
- 12.5.8 Subsegment Pricing and Adoption Trends
- 12.5.9 Leading Suppliers and Competition
- 12.5.10 Regional Demand and Opportunities
- 12.6 By Application - Market Size and Forecast, 2025-2035
- 12.6.1 Segment Definition and Scope
- 12.6.2 Historical Market Size, 2018-2025
- 12.6.3 Revenue Forecast, 2025-2035
- 12.6.4 Volume Forecast, 2025-2035
- 12.6.5 Base-Year Market Share, 2025
- 12.6.6 Segment CAGR and Growth Drivers
- 12.6.7 Subsegment Market Size and Forecast
- 12.6.7.1 Monoclonal Antibodies
- 12.6.7.2 Recombinant Proteins
- 12.6.7.3 Cell & Gene Therapy Products
- 12.6.7.4 Antibiotics
- 12.6.7.5 Other Applications
- 12.6.8 Subsegment Pricing and Adoption Trends
- 12.6.9 Leading Suppliers and Competition
- 12.6.10 Regional Demand and Opportunities
- 12.7 By End User - Market Size and Forecast, 2025-2035
- 12.7.1 Segment Definition and Scope
- 12.7.2 Historical Market Size, 2018-2025
- 12.7.3 Revenue Forecast, 2025-2035
- 12.7.4 Volume Forecast, 2025-2035
- 12.7.5 Base-Year Market Share, 2025
- 12.7.6 Segment CAGR and Growth Drivers
- 12.7.7 Subsegment Market Size and Forecast
- 12.7.7.1 Biopharmaceutical Companies
- 12.7.7.2 Contract Manufacturing Organizations
- 12.7.7.3 Academic & Research Institutes
- 12.7.7.4 Other End Users
- 12.7.8 Subsegment Pricing and Adoption Trends
- 12.7.9 Leading Suppliers and Competition
- 12.7.10 Regional Demand and Opportunities
- 12.8 Segment Growth Comparison
- 12.9 Segment Attractiveness and Priority Matrix
Chapter 13 Global Bioprocess Technology End-Use and Application Market Outlook
- 13.1 End-Use Industry and Customer Demand Structure
- 13.2 Leading Applications and Customer Groups
- 13.3 End-Use Market Size, Share and Forecast
- 13.4 Major End-Use Industry Deep Dives
- 13.4.1 Customer Requirements and Use Cases
- 13.4.2 Demand and Replacement Cycles
- 13.4.3 Technical and Regulatory Considerations
- 13.4.4 Purchasing and Procurement Models
- 13.4.5 Leading Vendors and Distribution Channels
- 13.4.6 Forecast and Commercial Opportunities
- 13.5 Emerging Applications and Cross-Segment Demand
- 13.6 End-Use Industry Investment Priorities
Chapter 14 Global Bioprocess Technology Geographic Market Outlook, 2025-2035
- 14.1 Regional Market Size and Share, 2025
- 14.2 Regional Market Forecast, 2025-2035
- 14.3 Regional Pricing, Production and Demand Differences
- 14.4 North America
- 14.4.1 United States
- 14.4.2 Canada
- 14.4.3 Mexico
- 14.5 Europe
- 14.5.1 Germany
- 14.5.2 France
- 14.5.3 Italy
- 14.5.4 United Kingdom
- 14.5.5 Spain
- 14.5.6 Poland
- 14.5.7 Russia
- 14.5.8 Netherlands
- 14.5.9 Belgium
- 14.5.10 Sweden
- 14.5.11 Denmark
- 14.5.12 Norway
- 14.5.13 Rest of Europe
- 14.6 Asia Pacific
- 14.6.1 China
- 14.6.2 India
- 14.6.3 Japan
- 14.6.4 South Korea
- 14.6.5 Thailand
- 14.6.6 Indonesia
- 14.6.7 Vietnam
- 14.6.8 Malaysia
- 14.6.9 Australia
- 14.6.10 Rest of Asia Pacific
- 14.7 Latin America
- 14.7.1 Brazil
- 14.7.2 Argentina
- 14.7.3 Colombia
- 14.7.4 Chile
- 14.7.5 Rest of Latin America
- 14.8 Middle East
- 14.8.1 Saudi Arabia
- 14.8.2 United Arab Emirates
- 14.8.3 Turkey
- 14.8.4 Israel
- 14.8.5 Iran
- 14.8.6 Rest of the Middle East
- 14.9 Africa
- 14.9.1 South Africa
- 14.9.2 Egypt
- 14.9.3 Nigeria
- 14.9.4 Morocco
- 14.9.5 Rest of Africa
- 14.10 Regional Investment, Policy and Supply Chain Differences
- 14.11 Regional Competitive Landscape
- 14.12 Geographic Growth Hotspots
Chapter 15 Global Bioprocess Technology Technology, Innovation and Sustainability Outlook
- 15.1 Technology Landscape and Maturity
- 15.2 Product, Process and Service Innovation
- 15.3 AI, Automation and Digital Tools in the Industry
- 15.4 Technology Adoption and Performance Benchmarking
- 15.5 Innovation Pipeline and R&D Investment
- 15.6 Patent and Intellectual Property Trends
- 15.7 Energy Efficiency and Resource Management
- 15.8 Sustainability, Recycling and Circularity
- 15.9 Technology Roadmap, 2025-2035
- 15.10 Risks of Obsolescence and Technology Substitution
Chapter 16 Global Bioprocess Technology Market Key Strategic Imperatives
- 16.1 Growth and Market Entry Priorities
- 16.2 High-Return Products and Segments
- 16.3 Pricing, Profitability and Cost Optimization
- 16.4 Technology Investment and Product Differentiation
- 16.5 Supply Chain Localization and Resilience
- 16.6 Distribution and Customer Acquisition
- 16.7 Partnership, Acquisition and Capacity Strategy
- 16.8 Regional Expansion Priorities
- 16.9 Short-, Medium- and Long-Term Actions
Chapter 17 Competition Outlook
- 17.1 Industry Competition Characteristics
- 17.2 Market Structure and Concentration
- 17.3 Market Share and Competitive Positioning, 2025
- 17.4 Company-Wise Revenue and Product Benchmarking
- 17.5 Production and Service Capacity Benchmarking
- 17.6 Technology, Pricing and Differentiation
- 17.7 Regional Footprint and Distribution Strength
- 17.8 Mergers, Acquisitions and Strategic Alliances
- 17.9 New Entrants and Competitive Threats
- 17.10 Porter's Five Forces and Industry Attractiveness
- 17.11 Competitive Outlook, 2025-2035
Chapter 18 Company Profiles
- 18.1 Company Coverage and Selection Criteria
- 18.2 Sartorius AG
- 18.2.1 Business Description
- 18.2.2 Company Ownership and Geographic Presence
- 18.2.3 Product and Service Portfolio
- 18.2.4 Manufacturing and Operating Footprint
- 18.2.5 Production Capacity and Expansion Plans
- 18.2.6 Financial Performance and Investment
- 18.2.7 Market Share and Competitive Position
- 18.2.8 Technology and Innovation Capabilities
- 18.2.9 Strategic Alliances or Partnerships
- 18.2.10 Recent Developments
- 18.2.11 Growth Strategy and Outlook
- 18.3 Thermo Fisher Scientific Inc.
- 18.4 Danaher Corporation
- 18.5 Merck KGaA
- 18.6 F. Hoffmann-La Roche Ltd
- 18.7 Cytiva (GE Healthcare Life Sciences)
- 18.8 Eppendorf SE
- 18.9 Lonza Group AG
- 18.10 Bio-Rad Laboratories Inc.
- 18.11 Getinge AB
- 18.12 Advanced Instruments LLC
- 18.13 Agilent Technologies Inc.
- 18.14 Other Relevant Market Participants
Note: Every listed company is profiled on the structure shown under the first company. The company list is preliminary and may change based on research findings, market developments, data availability and client requirements.
Chapter 19 Disclaimer
- 19.1 Research and Forecast Disclaimer
- 19.2 Data Source and Estimation Limitations
Note: The depth of individual sections depends on data availability for this market. Volume, capacity, trade and other unit-based metrics are included where applicable.