Clinical diagnostics shift to molecular and bedside tests
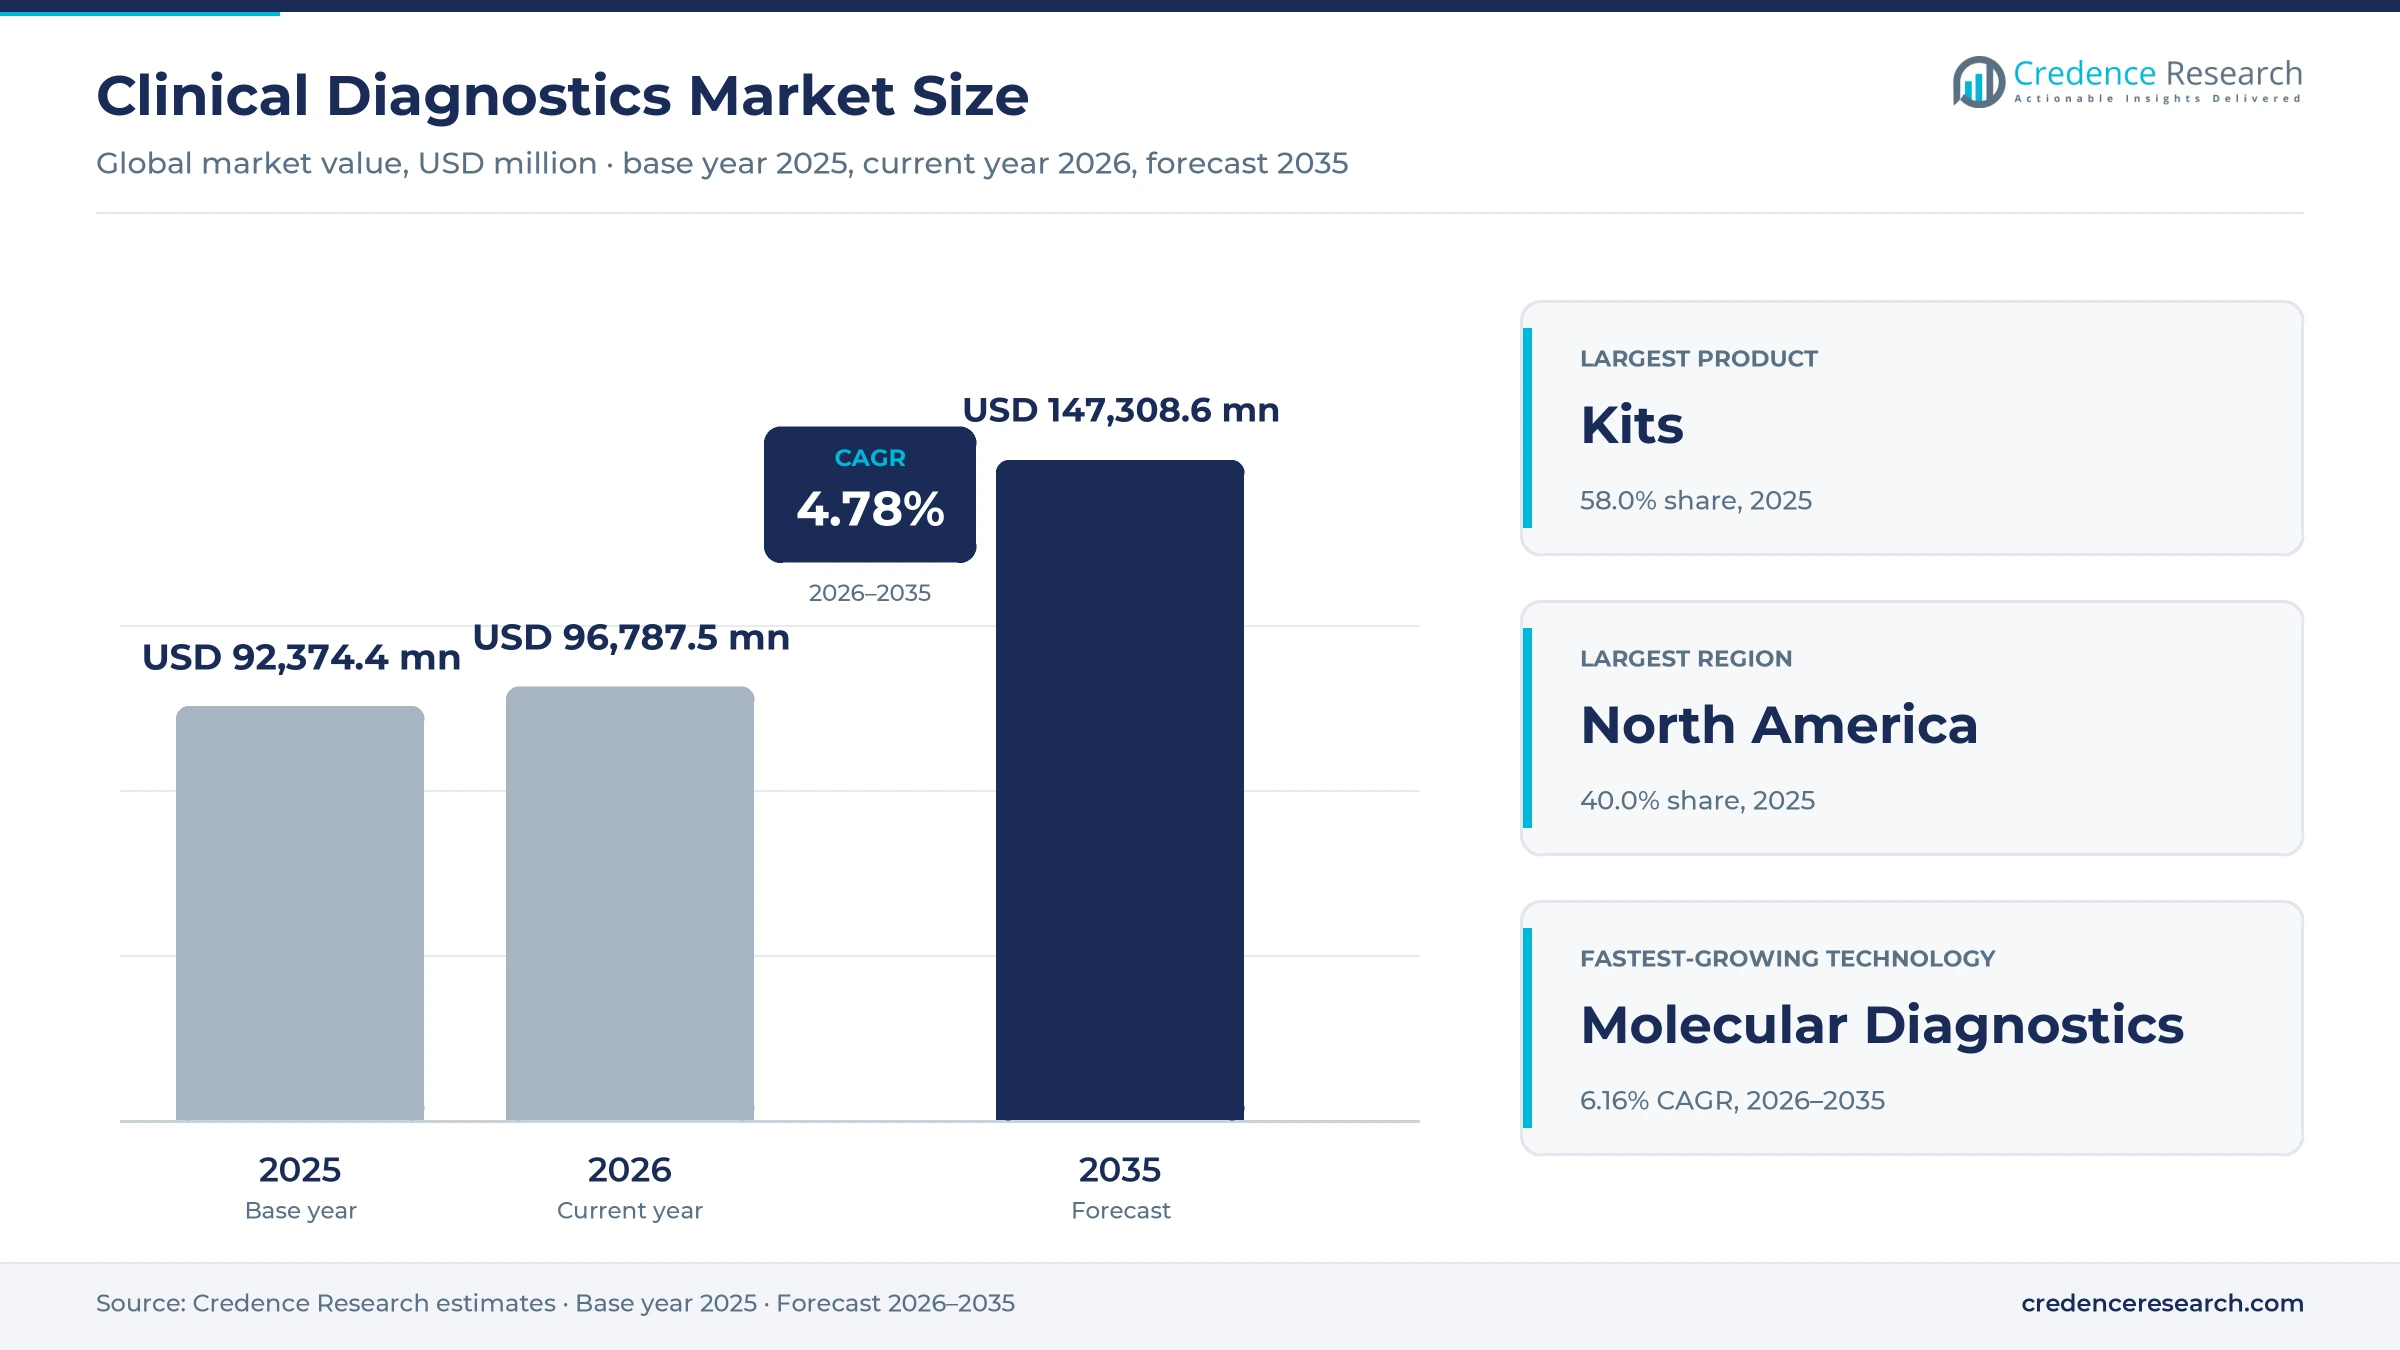
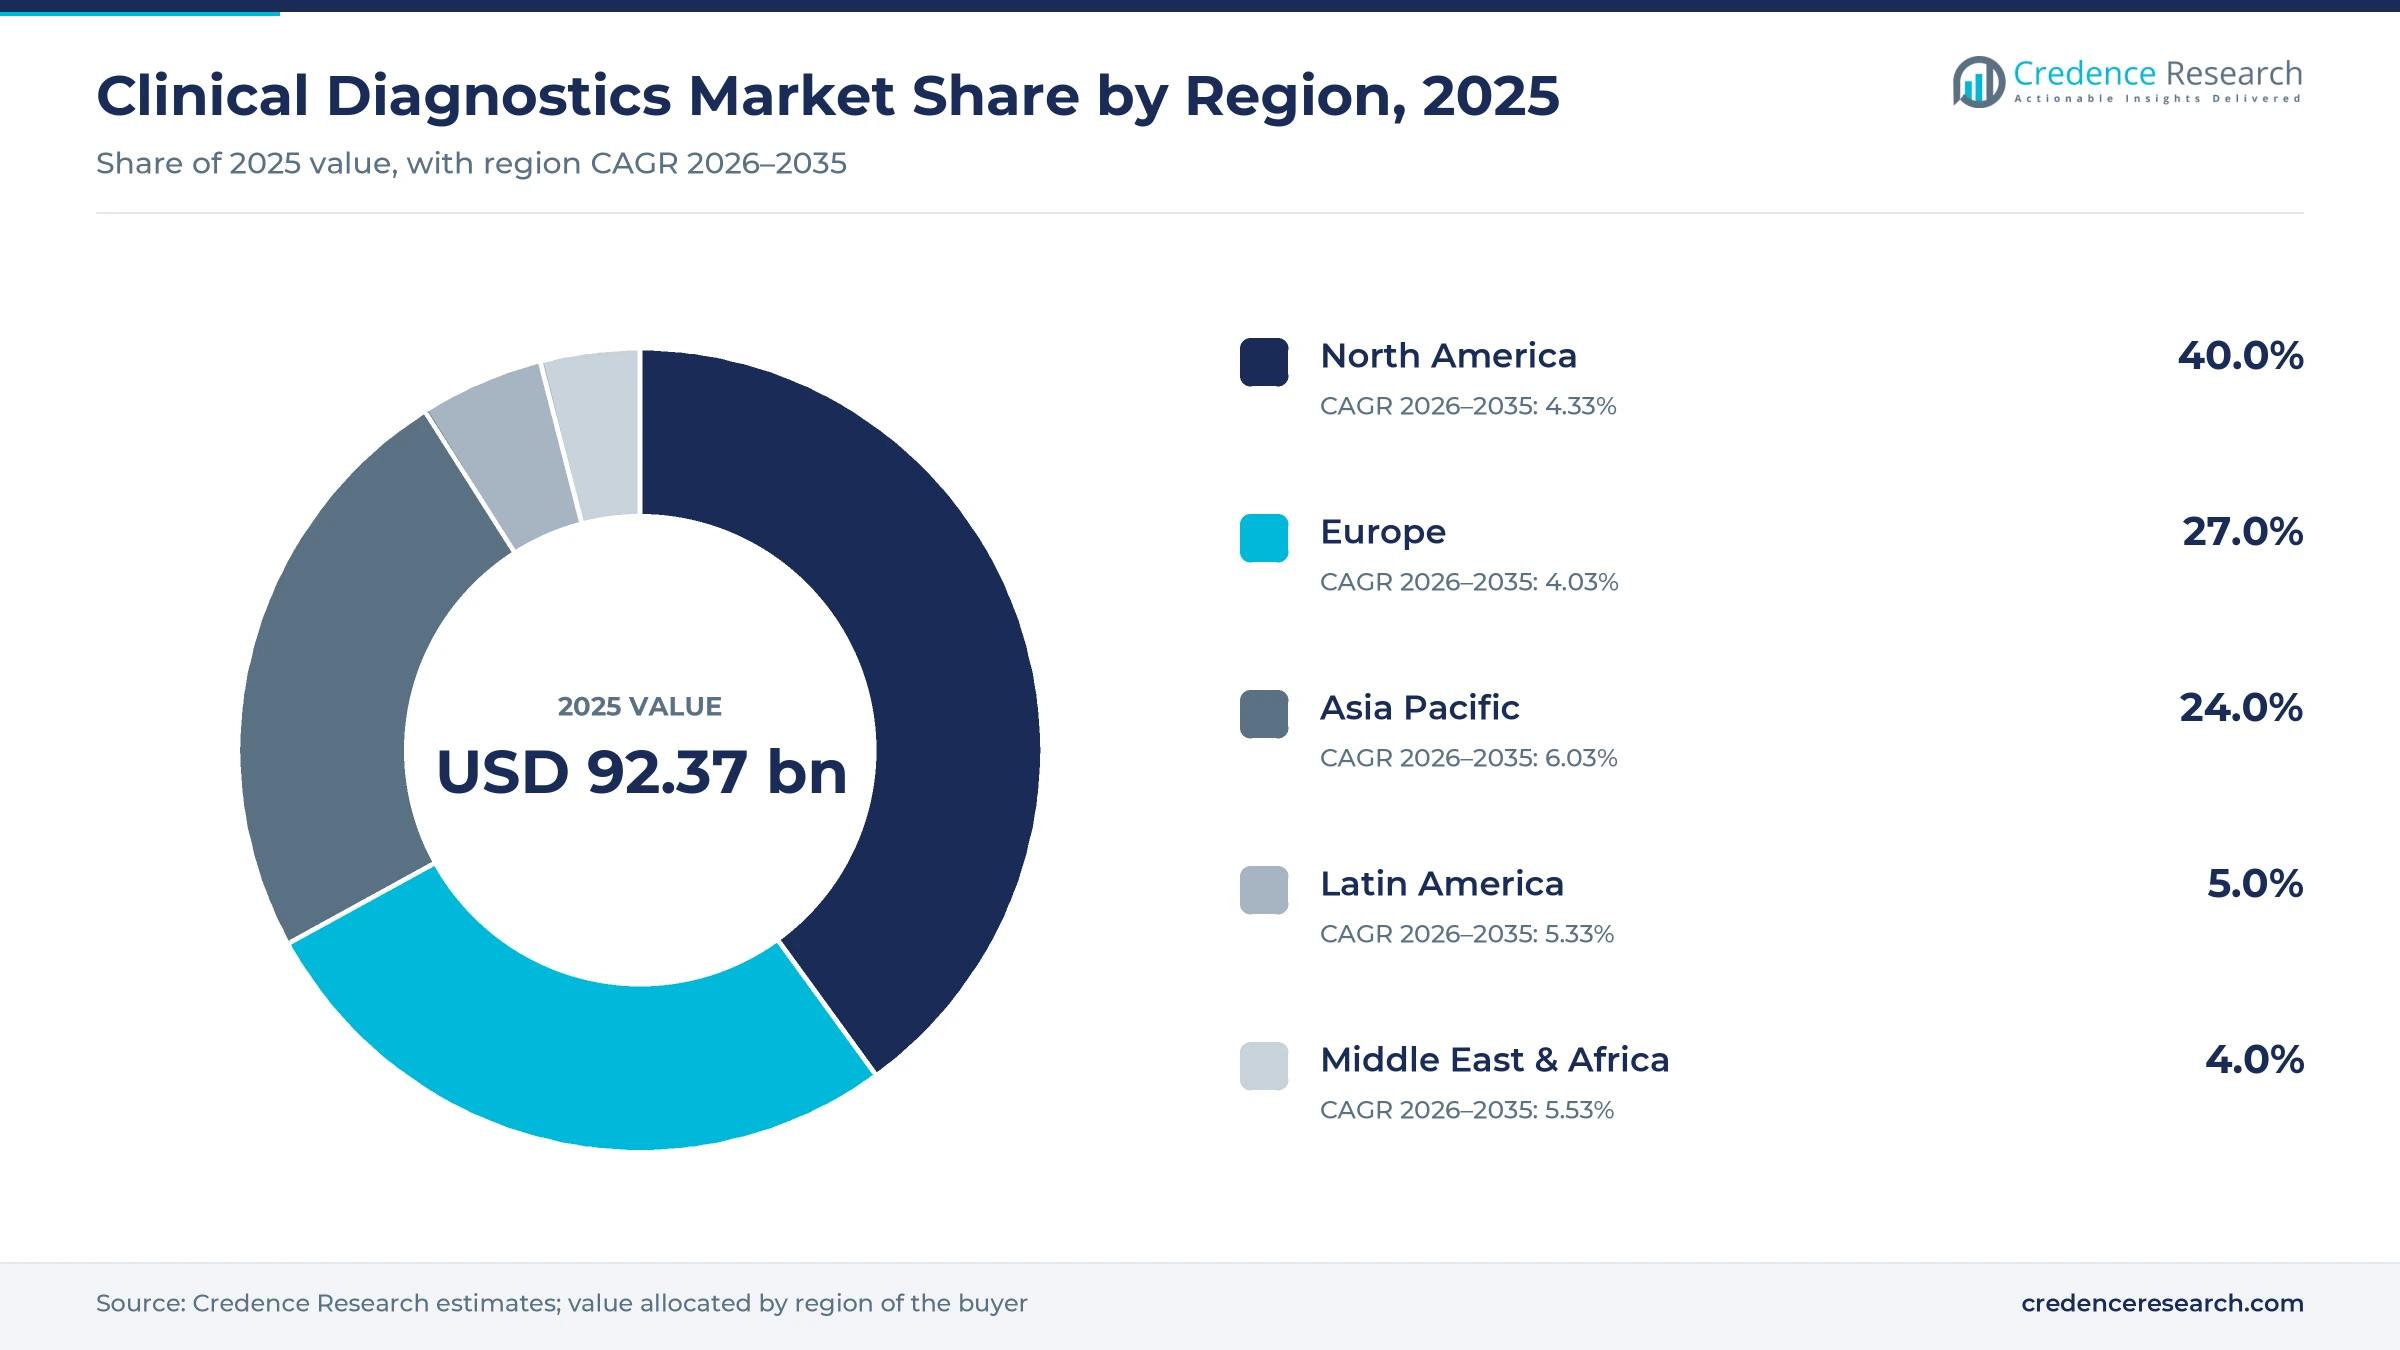
The global clinical diagnostics market was valued at USD 92.37 billion in 2025 and is projected to increase from USD 96.79 billion in 2026 to USD 147.31 billion by 2035, registering a CAGR of 4.78% during 2026–2035. Demand comes from routine blood chemistry, immunoassay and hematology panels ordered in hospitals every day, plus infectious disease, cancer and genetic tests that guide treatment choices. Aging populations and higher rates of diabetes, heart disease and cancer raise test volumes in every region. North America held the largest regional share, 40.0% in 2025, on high test use per person and large reference laboratory networks. Asia Pacific is the fastest-growing region at 6.03% a year, as China and India expand hospital laboratories and insurance coverage. The main commercial change is a wave of consolidation that is reshaping ownership of major laboratory and molecular testing brands.
Which tests, analyzers and buyers fall inside the scope?
The market counts manufacturer revenue from in vitro test instruments, reagent kits and consumables used to analyze blood, urine, tissue and other samples for patient care. It covers clinical chemistry, immunoassay, molecular, hematology, coagulation, microbiology and urinalysis platforms. Buyers include hospital laboratories, independent reference laboratories, physician offices, point-of-care sites and consumers using home tests.
The scope excludes laboratory service fees charged to patients and payers, diagnostic imaging equipment and research-use-only products sold to academic or drug discovery customers. Software sold separately from analyzers and blood glucose meters used for daily self-monitoring are also excluded from the market value.
Clinical Diagnostics Market Insights
- The clinical diagnostics market grows from USD 92.37 billion in 2025 to USD 147.31 billion by 2035, a 4.78% CAGR over 2026–2035, as aging and chronic disease raise test volumes.
- North America held 40.0% of global value in 2025, backed by high per-capita test use, large reference laboratories and fast adoption of molecular panels.
- Kits led product types with 58.0% of 2025 value, because every installed analyzer consumes reagents with each patient sample processed.
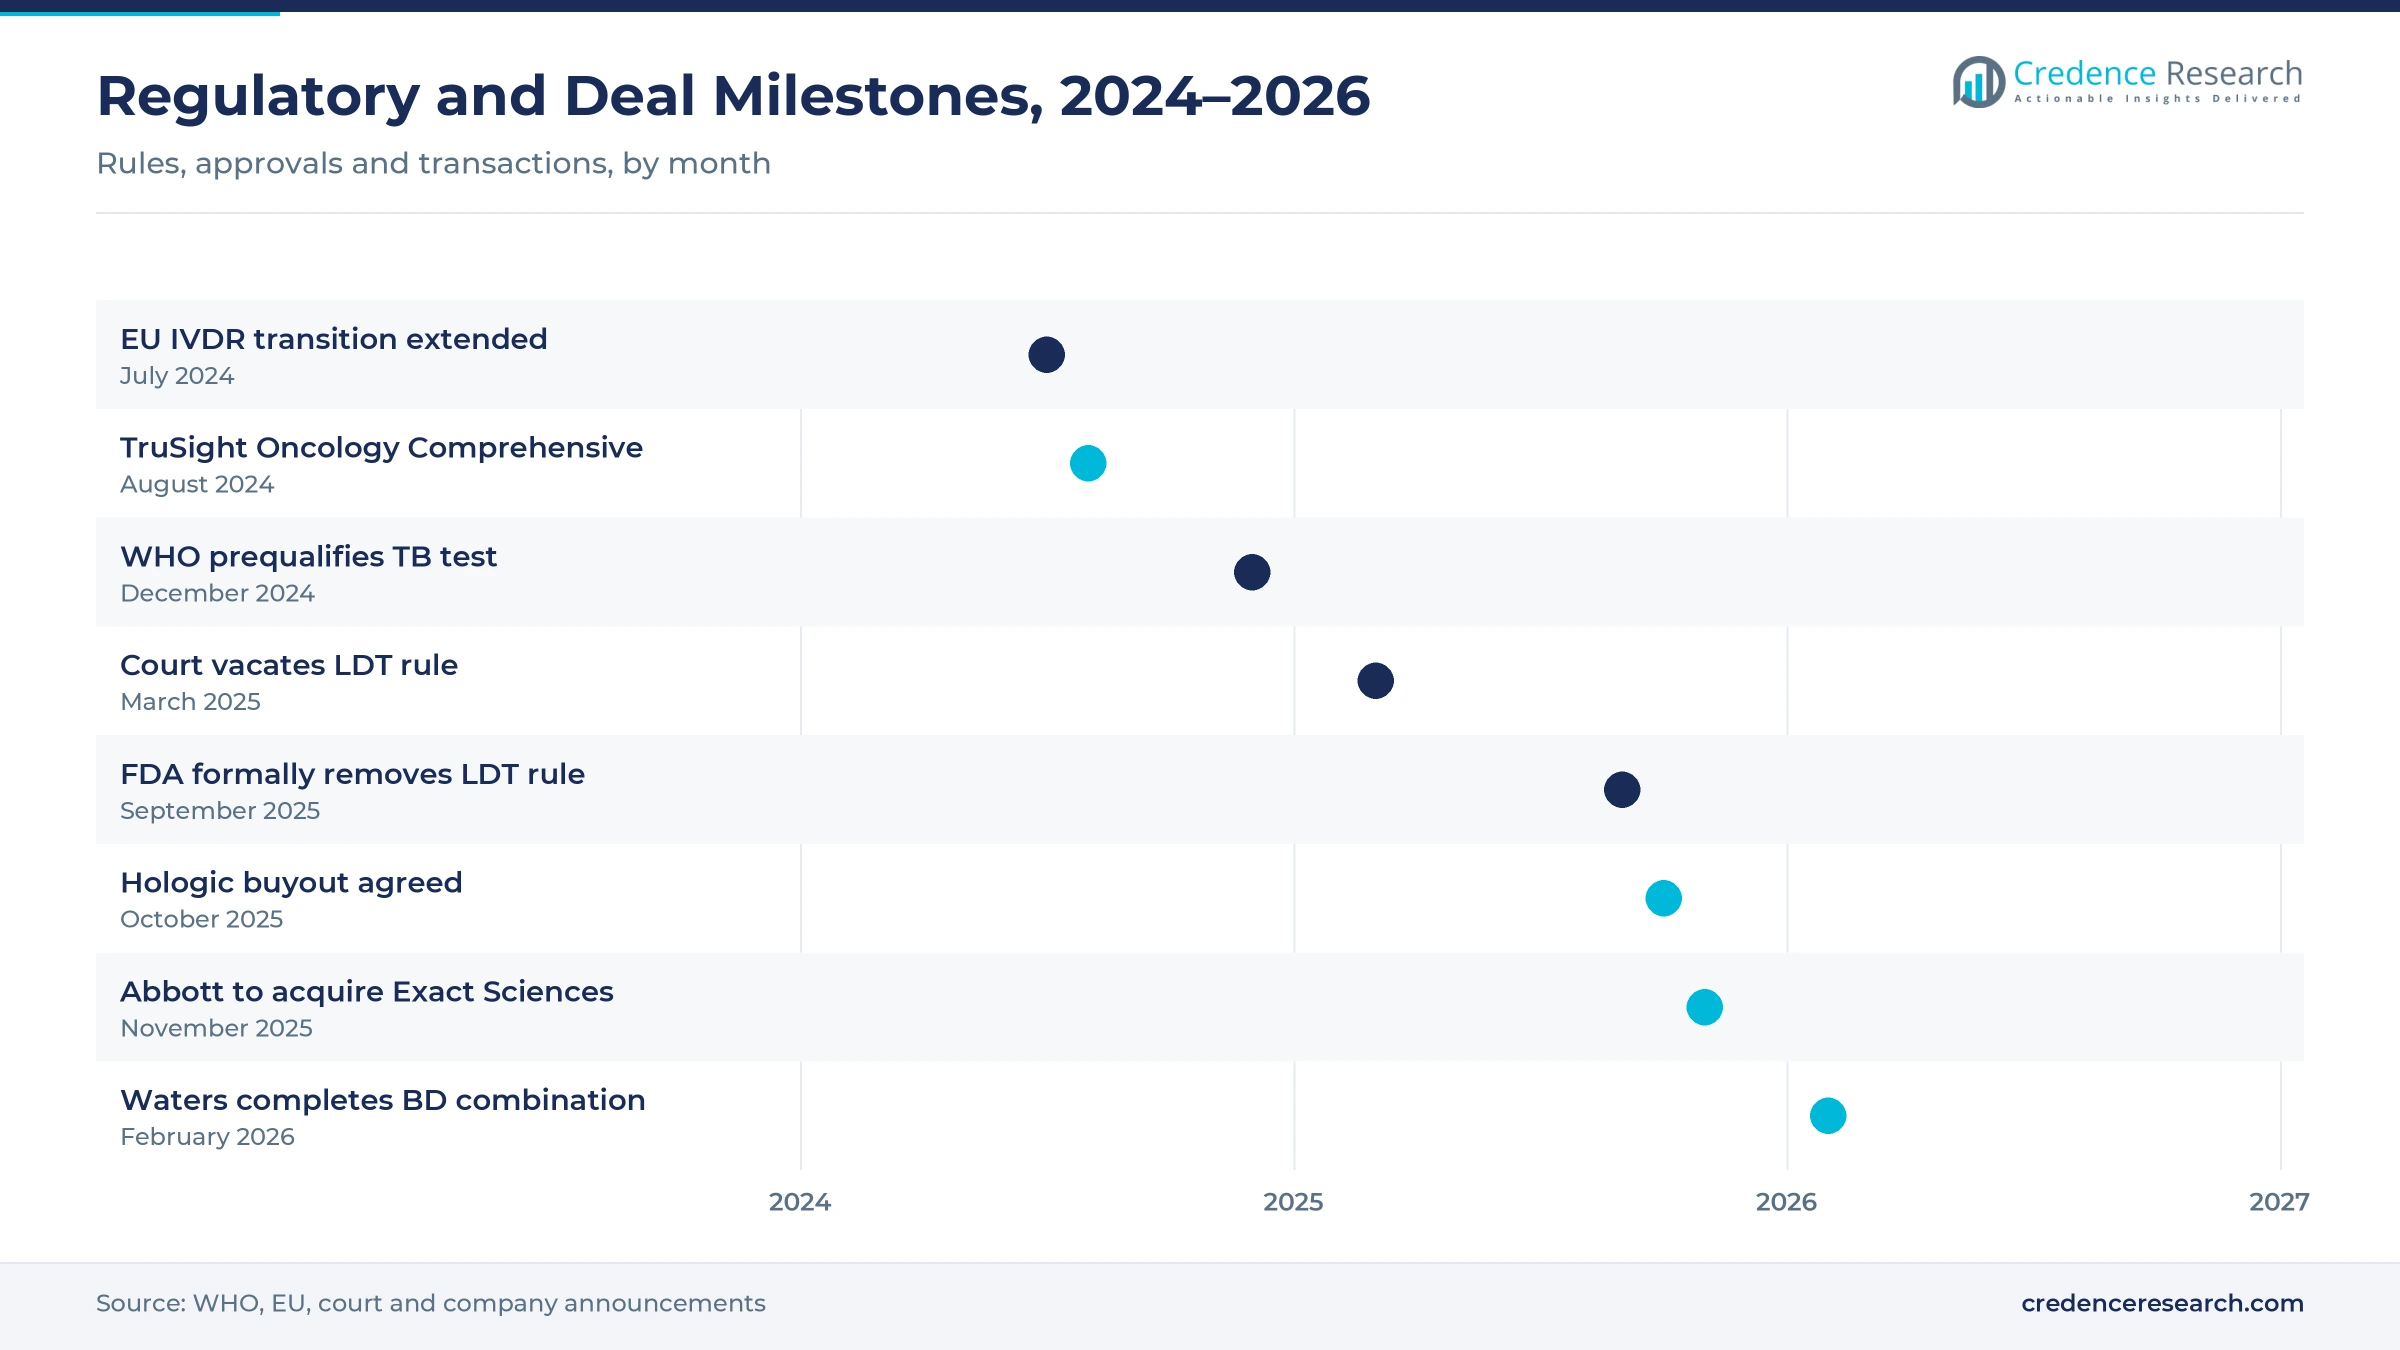
- In March 2025, a federal court in Texas vacated the FDA rule on laboratory-developed tests, and the agency formally removed it in September 2025.
- Blackstone and TPG agreed in October 2025 to acquire Hologic for an enterprise value of up to USD 18.3 billion, a large private equity move into testing.
Reagent kits and immunoassays hold the largest value
Why do kits hold the largest share?
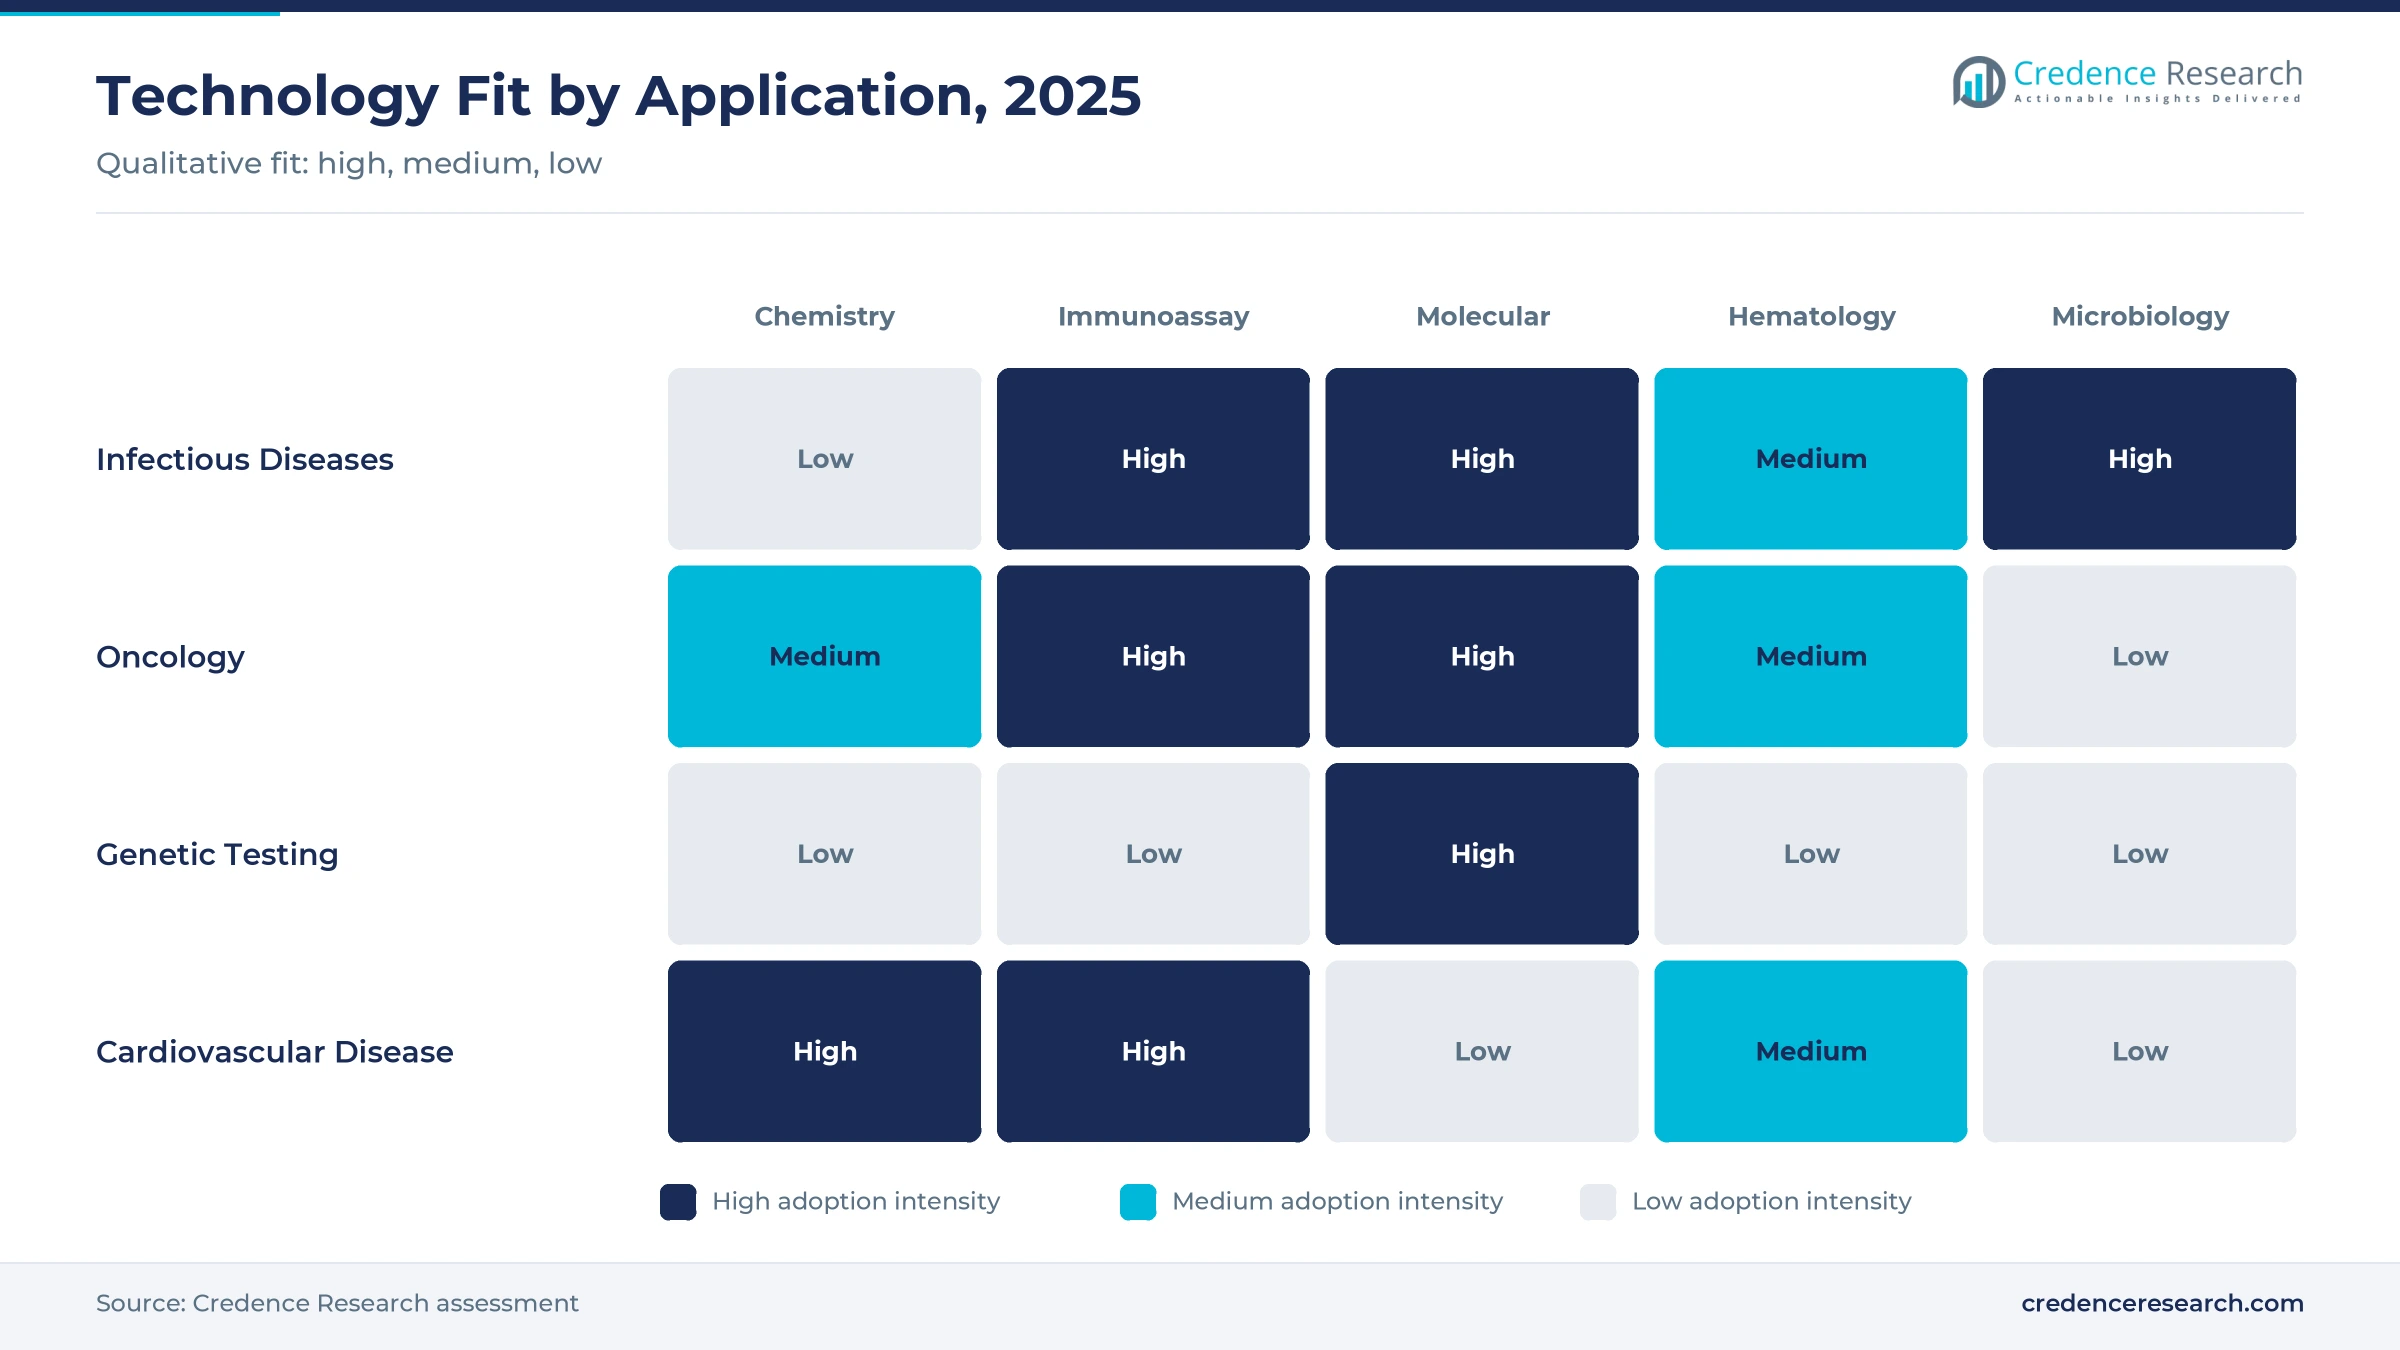
Based on product, the market is categorized into instruments, kits and consumables. Kits led with a 58.0% share of 2025 value, because analyzers are often placed under reagent rental contracts and earn recurring revenue from every test run. Kits grow fastest at 4.97% a year through 2035, as molecular panels, cancer profiling tests and home kits add new reagent demand while instrument replacement cycles stay long.
How fast is testing moving outside the central laboratory?
Based on test type, the market is categorized into lab based, point of care and home based tests. Lab Based testing led with a 74.0% share of 2025 value, because high-throughput hospital and reference laboratories process most routine panels. Home Based Test kits grow fastest at 7.23% a year, as consumers buy self-tests for infections, fertility and chronic disease, and as telehealth providers order sample collection at home.
Which technology leads, and which grows fastest?
Based on technology, the market is categorized into clinical chemistry, immunoassay and immunochemistry, molecular diagnostics, hematology, coagulation and hemostasis, microbiology, urinalysis and others. Immunoassay & Immunochemistry led with a 27.0% share of 2025 value, because immunoassay analyzers run cardiac, thyroid, fertility and infectious disease markers on one platform. Molecular Diagnostics grows fastest at 6.16% a year, as PCR panels and sequencing move into routine care.
Where is test demand concentrated by disease area?
Based on application, the market is categorized into infectious diseases, oncology, genetic testing, cardiovascular disease and others. Infectious Diseases led with a 32.0% share of 2025 value, because respiratory, sexually transmitted, bloodstream and tuberculosis tests are ordered in high volumes worldwide. Genetic Testing grows fastest at 6.81% a year, as hereditary risk panels, newborn screening and carrier testing reach more patients through lower sequencing costs.
| Segment Group | Leading Sub-segment | Share, 2025 | Fastest-growing Sub-segment | CAGR, 2026–2035 |
|---|---|---|---|---|
| By Product | Kits | 58.0% | Kits | 4.97% |
| By Test Type | Lab Based | 74.0% | Home Based Test | 7.23% |
| By Technology | Immunoassay & Immunochemistry | 27.0% | Molecular Diagnostics | 6.16% |
| By Application | Infectious Diseases | 32.0% | Genetic Testing | 6.81% |
Request a Free Sample
Fill in your details and we'll send you a free sample report.
- Sample data tables & charts
- Research methodology
Chronic disease, infection control and cancer screening
How does the infectious disease burden sustain test volumes?
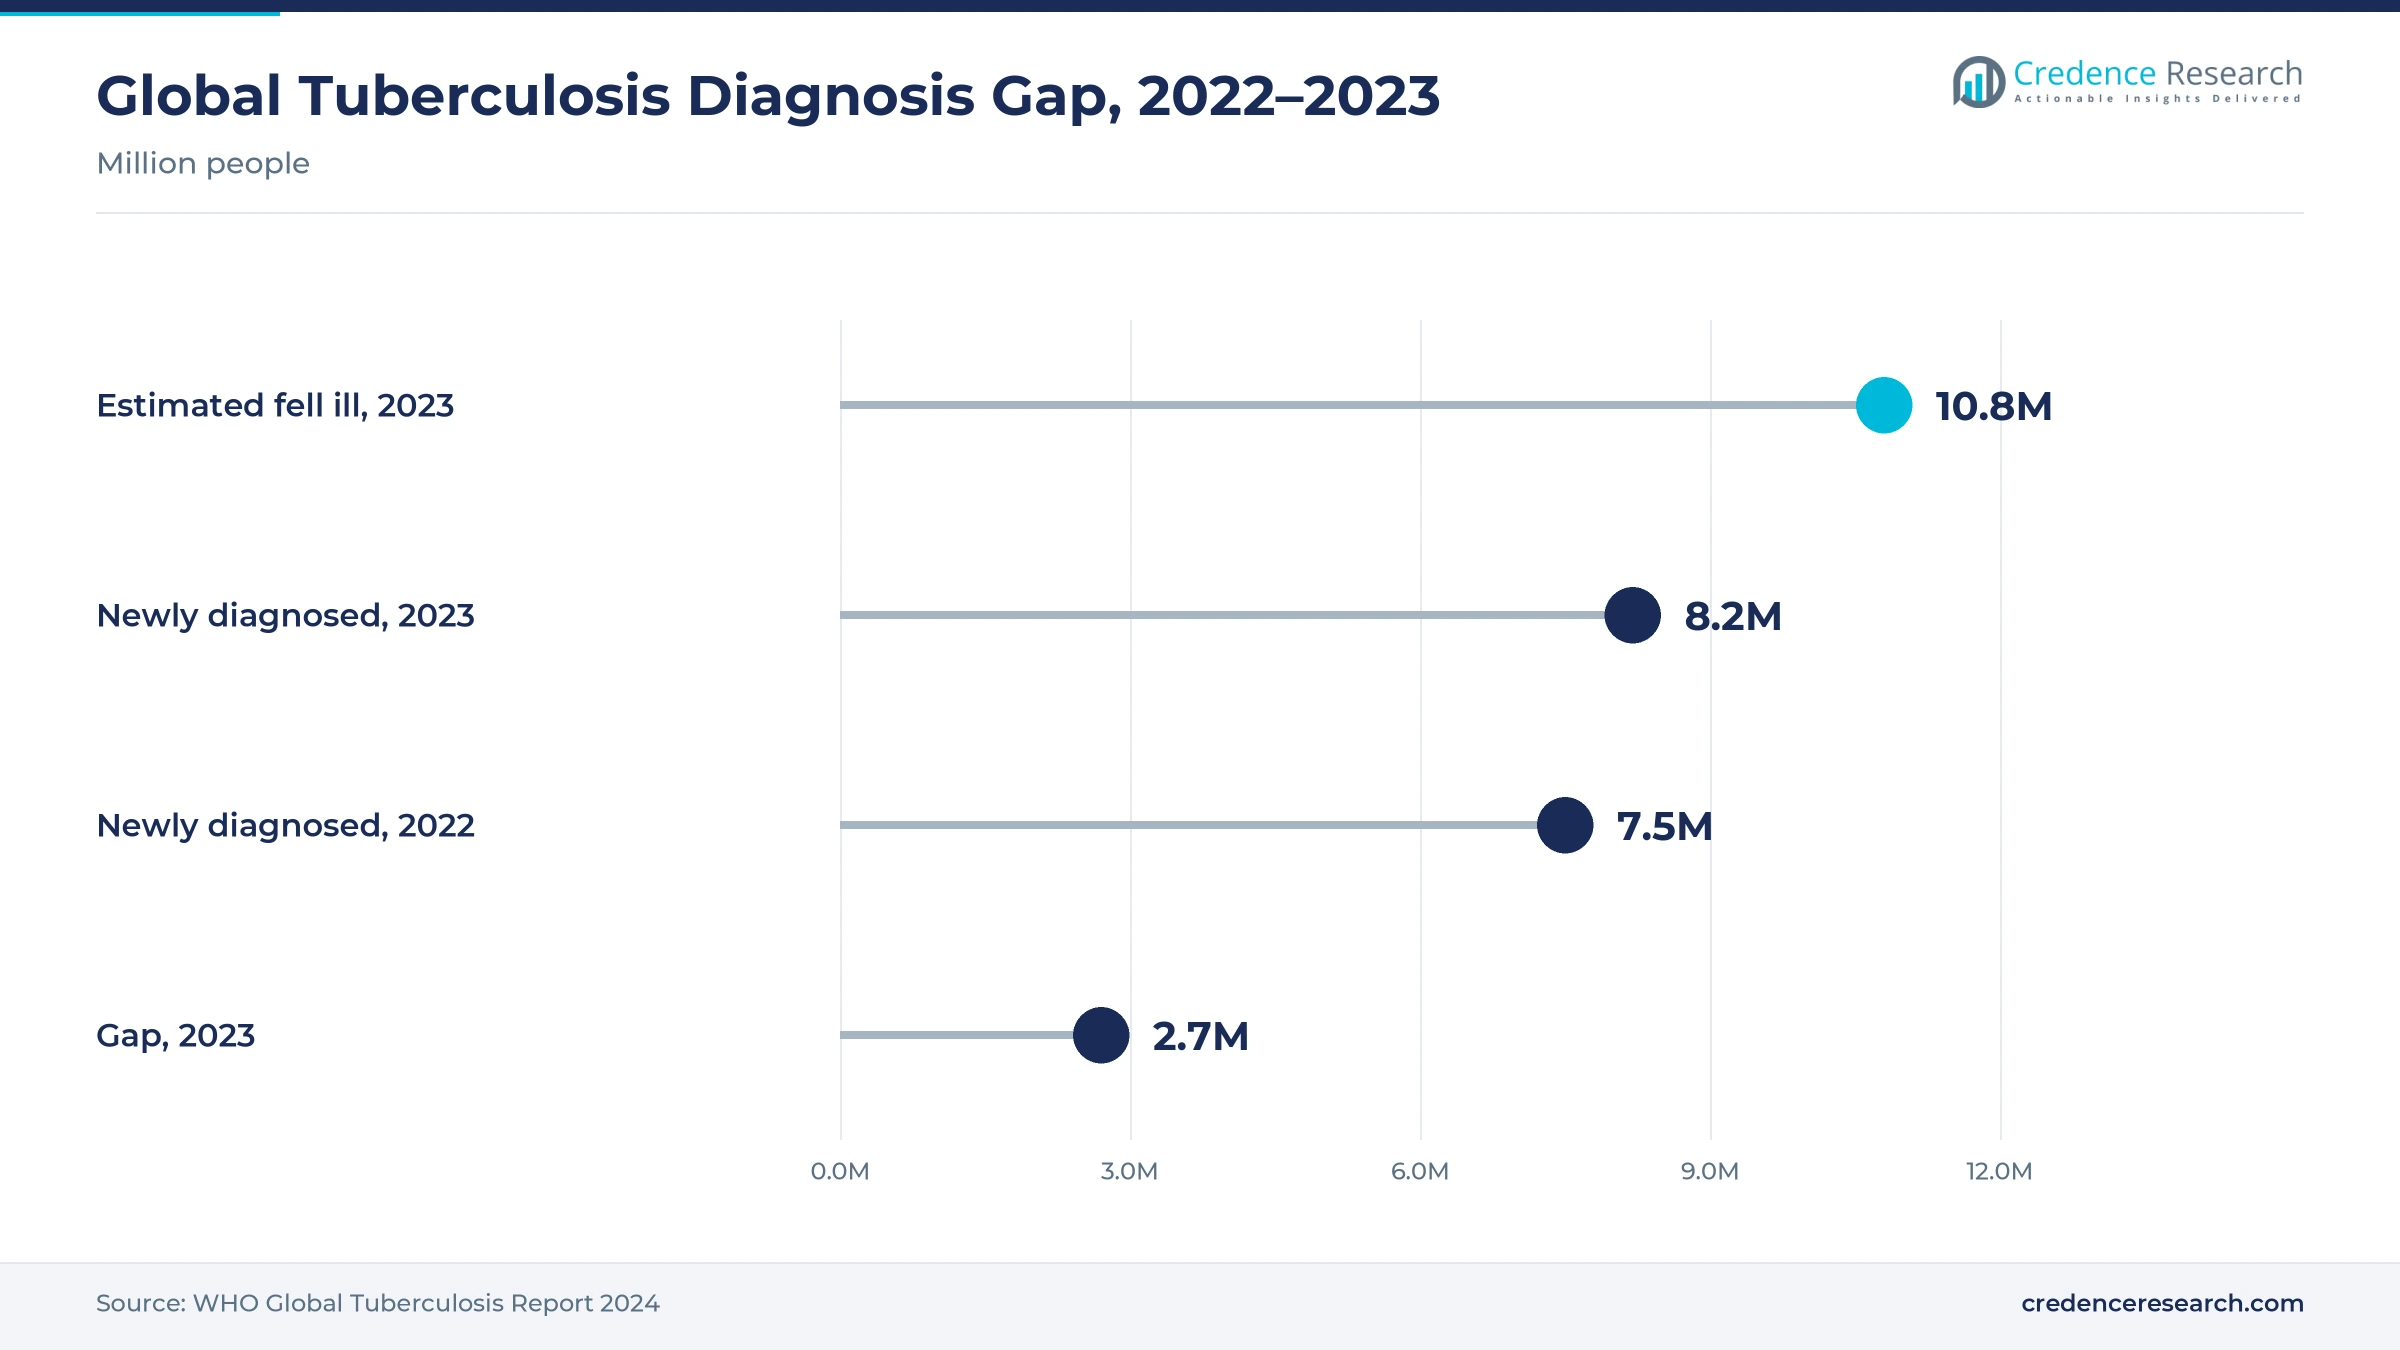
Infectious diseases remain the largest single source of diagnostic demand, especially where detection gaps are wide. In 2023, the WHO reported that about 8.2 million people were newly diagnosed with tuberculosis, up from 7.5 million in 2022, while an estimated 10.8 million fell ill. The gap of about 2.7 million undiagnosed or unreported cases shows the room for wider molecular testing. As a result, national programs keep expanding rapid tests in primary care, which supports volume growth in Asia Pacific and Africa.
Why do aging and chronic disease raise routine testing?
Older adults and patients with diabetes, kidney disease and heart disease need regular blood tests to manage treatment. Routine chemistry and immunoassay panels, such as HbA1c, lipids, troponin and kidney function, account for a large share of daily laboratory work. Because these conditions are chronic, testing repeats several times a year for each patient. This steady demand keeps hospital laboratories investing in high-throughput analyzers and reagent contracts across all regions. In turn, large hospital laboratories process thousands of routine samples each day, which sustains reagent orders.
How does precision oncology expand molecular testing?
Targeted cancer drugs need biomarker tests to select patients, which links new therapies to new diagnostic revenue. In August 2024, Illumina announced FDA approval of TruSight Oncology Comprehensive, a pan-cancer profiling test with companion claims for NTRK fusion solid tumors and RET fusion lung cancer. In November 2025, Abbott and Exact Sciences announced a merger agreement at USD 105.00 per share in cash, adding cancer screening and precision oncology tests. These moves show how oncology testing lifts the value earned per test.
Why are governments funding decentralized testing?
Health systems want faster results closer to patients, which favors point-of-care testing in clinics, emergency rooms and community sites. On Dec. 5, 2024, the WHO announced its first prequalification of a tuberculosis test, Cepheid's Xpert MTB/RIF Ultra molecular assay. Prequalification lets donors and national programs buy approved tests with confidence. In turn, near-patient molecular platforms gain access to large public tenders in low- and middle-income countries.
Consolidation, decentralized testing and genomic profiling
Why is consolidation reshaping supplier ranks?
Large deals are changing who owns key testing franchises, as companies focus portfolios on higher-growth assays. In February 2026, Waters completed its combination with BD's Biosciences and Diagnostic Solutions businesses and formed a new advanced diagnostics division covering microbiology, molecular and point-of-care testing. Waters shareholders own about 60.8% of the combined company and BD shareholders about 39.2%. In October 2025, Hologic agreed to be acquired by Blackstone and TPG for up to USD 79 per share. This shift concentrates scale and investment in fewer, larger owners.
How is laboratory automation changing the workflow?
Laboratories are rising to staff shortages by linking analyzers, sample handlers and middleware into automated lines. Automation lets one technologist oversee chemistry, immunoassay and hematology analyzers at once, which raises throughput per employee. Suppliers sell these systems under long contracts that bundle reagents and service. As a result, large hospital networks and reference laboratories consolidate testing in fewer, more automated sites and smaller hospitals send specialty work to these hubs for faster turnaround.
Where is the opening in home and self-testing?
Home testing offers an opening for suppliers that can deliver accurate results without a laboratory visit. Consumers now buy self-tests for respiratory infections, fertility, colorectal cancer screening and sexually transmitted infections through pharmacies and online stores. Telehealth providers also send home collection kits for blood and urine panels. This channel grows fastest among test types, although regulators require clear labeling and accuracy data before approval. Because results reach patients directly, suppliers also invest in apps that explain results and link users to follow-up care.
Can genomic testing reach routine care?
Falling sequencing costs create an opportunity to move genetic testing from specialist centers into routine care. Hereditary cancer panels, carrier screening, pharmacogenomic tests and newborn sequencing are gaining coverage in the U.S. and parts of Europe. Illumina, QIAGEN and Agilent supply instruments, library preparation kits and analysis software for these workflows. If payers widen coverage, genetic testing could add strong reagent demand through 2035. However, laboratories also need trained genetic counselors and data storage, which raises the cost of each new program.
Pricing pressure, regulatory change and staff shortages
How does reimbursement pressure limit test prices?
Payers cut or freeze fees for routine tests, which squeezes laboratory budgets and supplier prices. In the U.S., public fee schedules for common chemistry and hematology tests have faced repeated reviews, while China uses volume-based procurement for some reagents. These policies push laboratories to demand lower reagent prices from suppliers. As a result, value growth for mature tests trails volume growth, and suppliers shift investment toward higher-value molecular and oncology assays.
Why does regulatory change raise compliance costs?
Diagnostic regulation in Europe and the U.S. has changed sharply since 2024, which adds cost and uncertainty for manufacturers. Regulation (EU) 2024/1860 extended IVDR transition periods to Dec. 31, 2027, for class D devices and to the end of 2028 and 2029 for lower classes. In the U.S., a court vacated the FDA rule on laboratory-developed tests in March 2025. These shifts force suppliers to maintain parallel compliance plans across markets.
What do staff shortages mean for laboratories?
Many hospital laboratories struggle to recruit and keep trained technologists, which limits how many tests they can run. Vacancies lengthen turnaround times and push laboratories to outsource specialty tests to reference networks. Smaller sites may delay adding new assays because they lack staff to validate them. This constraint favors suppliers of automated systems but slows adoption of complex manual tests. In turn, training programs and remote support from suppliers have become part of many analyzer contracts.
Why does post-pandemic normalization weigh on growth?
Respiratory testing surged during the COVID-19 pandemic and then fell sharply, which left some suppliers with excess capacity. Companies wrote down inventories and restructured molecular businesses as demand returned to seasonal patterns. Although multiplex respiratory panels keep some of the gains, infectious disease value now grows more slowly than oncology and genetic testing. This normalization holds the overall market growth rate near 4.78% a year, well below the surge seen in 2020 and 2021.
U.S. laboratories lead while Asia Pacific gains fastest
| Region | Value, 2025 (USD billion) | Share, 2025 | CAGR, 2026–2035 |
|---|---|---|---|
| North America | 36.95 | 40.0% | 4.33% |
| Europe | 24.94 | 27.0% | 4.03% |
| Asia Pacific | 22.17 | 24.0% | 6.03% |
| Latin America | 4.62 | 5.0% | 5.33% |
| Middle East & Africa | 3.69 | 4.0% | 5.53% |
North America leads on test use and molecular adoption
North America held a 40.0% share of 2025 value and grows at 4.33% a year through 2035. The U.S. has large hospital laboratories and national reference networks that process high volumes of chemistry, immunoassay and molecular tests. The FDA rule on laboratory-developed tests was formally vacated in September 2025, according to a notice reported by AABB, which preserves flexibility for laboratories. However, fee pressure still limits value growth for routine chemistry and hematology tests.
Europe adapts to the IVDR transition
Europe held a 27.0% share of 2025 value and grows at 4.03% a year, the slowest pace among the five regions. Germany, France, Italy and the U.K. account for most demand, with public hospital laboratories buying through tenders. The IVDR transition requires new conformity assessments for many tests, which has led some suppliers to retire low-volume assays. However, Siemens Healthineers, bioMerieux, QIAGEN and Randox keep strong positions in their home markets.
Asia Pacific grows on laboratory expansion
Asia Pacific held a 24.0% share of 2025 value and is the fastest-growing region at 6.03% a year. China and India are adding hospital beds, laboratories and insurance coverage, which raises test volumes per person. Japan supports high-value testing, and Sysmex leads in hematology from its home base. Domestic suppliers in China compete on price in chemistry and immunoassay, while multinational firms focus on high-end platforms.
Latin America builds private laboratory networks
Latin America held a 5.0% share of 2025 value and grows at 5.33% a year through 2035. Brazil and Mexico lead the region, where private laboratory chains run large automated centers. Public systems buy tests through tenders and often face budget limits and currency swings. As a result, growth depends on private chains that adopt molecular and immunoassay panels.
Middle East and Africa widen access to testing
The Middle East & Africa held a 4.0% share of 2025 value and grows at 5.53% a year. Gulf states invest in new hospitals and centralized laboratories with modern automation. In sub-Saharan Africa, donor-funded programs for tuberculosis, HIV and malaria drive much of the demand for molecular and rapid tests. Of an estimated 400,000 people who developed multidrug-resistant TB in 2023, only 44% were diagnosed and treated, which shows the need for wider testing. WHO prequalification helps these programs buy approved tests at scale.
Major deals and regulatory changes since 2024
| Development | Status and market relevance |
|---|---|
| In December 2024, the WHO announced its first prequalification of a tuberculosis test, Cepheid's Xpert MTB/RIF Ultra. | Prequalified. Supports donor purchases of molecular TB tests. |
| In September 2025, the FDA formally removed its May 2024 rule on laboratory-developed tests after a court vacated it in March 2025. | In force. Keeps laboratory-developed tests outside device rules in the U.S. |
| In October 2025, Blackstone and TPG announced an agreement to acquire Hologic for up to USD 79 per share. | Announced. Moves a women's health testing leader into private ownership. |
| In November 2025, Abbott announced an agreement to acquire Exact Sciences for USD 105.00 per share in cash. | Announced. Adds cancer screening and precision oncology tests to Abbott. |
| In February 2026, Waters completed its combination with BD's Biosciences and Diagnostic Solutions businesses. | Completed. Creates a new diagnostics division within Waters. |
Automation, multiplex PCR and next-generation sequencing
- Total laboratory automation links sample handling, analyzers and storage so fewer staff can run more tests each day.
- Multiplex PCR panels detect many respiratory, gastrointestinal or bloodstream pathogens from one sample in about an hour.
- Next-generation sequencing profiles hundreds of cancer genes or a full exome in one run to guide therapy choices.
- High-sensitivity immunoassays measure cardiac troponin and other markers at very low levels for faster emergency decisions.
- Connected point-of-care analyzers send results directly to electronic records from clinics, pharmacies and emergency rooms.
Need a Custom Version of This Report?
Tailor the scope, geography, or segments to your exact requirements.
- Custom geography or segment scope
- Direct access to our analyst team
Installed analyzers lock in recurring reagent revenue
Competition centers on installed analyzers, because each system locks in years of reagent sales. Abbott, Siemens Healthineers and Danaher, through Beckman Coulter and Cepheid, lead in chemistry, immunoassay and molecular platforms. Sysmex is the leading hematology specialist, while bioMerieux and BD, now part of Waters in diagnostics, are strong in microbiology. Hologic focuses on women's health and molecular testing, QIAGEN on sample preparation and syndromic panels, and Illumina and Agilent on sequencing and genomic workflows. Bio-Rad supplies quality controls and specialty assays, and Randox Laboratories offers broad chemistry and multiplex arrays. Recent deals show that scale in reagents and service now matters more than single assays, and suppliers compete on menu breadth, automation and connectivity.
Companies profiled and their roles in this market
| Company | Type | Role in the market |
|---|---|---|
| Randox Laboratories | Specialist | Clinical chemistry reagents and multiplex arrays |
| BD | Diversified | Diagnostic business combined with Waters in 2026 |
| bioMerieux SA | Specialist | Microbiology and syndromic molecular panels |
| Bio-Rad Laboratories, Inc. | Specialist | Quality controls and specialty assays |
| Abbott | Diversified | Core laboratory, rapid and molecular tests |
| Agilent Technologies, Inc. | Specialist | Pathology and genomic workflows |
| Danaher Corporation | Diversified | Beckman Coulter and Cepheid platforms |
| Hologic Inc. | Specialist | Women's health and molecular testing |
| Illumina, Inc. | Specialist | Sequencing and oncology profiling |
| QIAGEN | Specialist | Sample preparation and syndromic testing |
| Siemens Healthineers AG | Diversified | Chemistry, immunoassay and automation |
| Sysmex Corporation | Specialist | Hematology and urinalysis analyzers |
Molecular and oncology testing carry the growth premium
Credence Research's view is that molecular, oncology and genetic testing will carry the growth premium in clinical diagnostics through 2035. Routine chemistry and immunoassay still supply most of the value, but fee pressure keeps their growth below the market average. Suppliers with large installed bases, broad test menus and automation earn steady reagent revenue and can cross-sell new assays. Recent deals show that owners are paying for scale in cancer screening and molecular testing, which suggests further consolidation as smaller firms seek partners.
How the 2025 baseline and forecast were built
The report uses 2025 as the base year and forecasts market value to 2035, with growth rates stated for 2026–2035. Market values come from the Credence Research market model, which combines test volumes by technology and region with average reagent and instrument prices. Splits by product, test type, technology, application and region are Credence Research estimates. Sources used include WHO disease statistics and prequalification notices, regulatory records from the U.S. and the EU, and company press releases and filings. No primary interviews or surveys were used to build the estimates in this report.
Testing moves closer to patients through 2035
By 2035, the market reaches USD 147.31 billion, with kits and consumables still providing most of the value. Molecular testing gains share as multiplex panels and sequencing move into routine care, and oncology becomes a larger part of laboratory work. Point-of-care and home testing grow faster than central laboratories as health systems push care closer to patients. Asia Pacific adds the most new test volume, led by China and India. Consolidation continues, and suppliers with automation and broad menus gain share.
Frequently Asked Questions
How big is the clinical diagnostics market?
Which product type leads the market?
Which technology grows fastest?
Which region holds the largest share?
How large is the tuberculosis diagnosis gap?
What regulatory changes affect the market?
Who are the leading companies?
What are the main challenges?
Table of Content
Chapter 1 Market Segmentation
- 1.1 Segmentation Framework
- 1.1.1 Product and Service Classification
- 1.1.2 Application and End-Use Classification
- 1.1.3 Technology and Solution Classification
- 1.1.4 Customer and Distribution Channel Classification
- 1.1.5 Geographic Segmentation
- 1.1.6 Market Segment Definitions and Boundaries
- 1.2 By Product
- 1.2.1 Kits
- 1.2.2 Instrument
- 1.2.3 Consumables
- 1.3 By Test Type
- 1.3.1 Lab Based
- 1.3.2 Point of Care
- 1.3.3 Home Based Test
- 1.4 By Technology
- 1.4.1 Immunoassay & Immunochemistry
- 1.4.2 Clinical Chemistry
- 1.4.3 Molecular Diagnostics
- 1.4.4 Hematology
- 1.4.5 Coagulation & Hemostasis
- 1.4.6 Microbiology
- 1.4.7 Urinalysis
- 1.4.8 Others
- 1.5 By Application
- 1.5.1 Infectious Diseases
- 1.5.2 Oncology
- 1.5.3 Genetic Testing
- 1.5.4 Cardiovascular Disease
- 1.5.5 Others
Chapter 2 Introduction
- 2.1 Report Objectives and Scope
- 2.2 Product Definition and Industry Terminology
- 2.3 Market Inclusions and Exclusions
- 2.4 Research Process
- 2.4.1 Primary Research and Expert Interviews
- 2.4.2 Secondary Research and Source Review
- 2.4.3 Top-Down and Bottom-Up Estimation
- 2.4.4 Data Triangulation and Verification
- 2.5 Market Size Measurement Basis
- 2.5.1 2025: USD 92.37 billion → 2035: USD 147.31 billion
- 2.6 Historical and Forecast Reference Periods
- 2.6.1 Historical Period: 2018-2025
- 2.6.2 Base Year: 2025
- 2.6.3 Forecast Period: 2025-2035
- 2.7 Research Assumptions and Limitations
Chapter 3 Executive Summary
- 3.1 Market Snapshot and Key Findings
- 3.2 Base-Year Market Size, 2025
- 3.3 Forecast Market Size, 2035
- 3.4 Revenue and Volume Growth Outlook
- 3.5 Key Demand and Supply Indicators
- 3.6 Leading Market Segments
- 3.7 Fastest-Growing Market Opportunities
- 3.8 Regional Performance Highlights
- 3.9 Technology and Industry Transformation
- 3.10 Competitive Landscape Summary
- 3.11 Analyst View and Strategic Implications
Chapter 4 Global Clinical Diagnostics Market Trends and Developments
- 4.1 Historical Industry Development, 2018-2025
- 4.2 Recent Market Trends and Developments
- 4.3 Demand and Customer Behavior Trends
- 4.4 Technology and Product Innovation
- 4.5 Artificial Intelligence, Automation and Digitalization
- 4.6 Local Manufacturing and Supply Chain Realignment
- 4.7 Industry Partnerships, Mergers and Acquisitions
- 4.8 Sustainability and Circular Economy Developments
- 4.9 Government and Private Sector Investment Trends
- 4.10 Emerging Business Models and Commercialization
- 4.11 Industry Developments and Announcements
Chapter 5 Global Clinical Diagnostics Market Production, Supply and Demand Analysis
- 5.1 Demand Trend and Consumption Analysis, 2018-2025
- 5.2 Demand Forecast, 2025-2035
- 5.3 Production and Output Trend, 2018-2025
- 5.4 Production and Output Forecast, 2025-2035
- 5.5 Installed Capacity and Capacity Utilization
- 5.6 Company-Wise Production Plants and Statistics
- 5.6.1 Installed Production Capacity
- 5.6.2 Actual Production
- 5.6.3 Planned Capacity and Expansion Targets
- 5.7 Supply Chain Structure and Procurement Trends
- 5.8 Supply-Demand Gap and Bottlenecks
- 5.9 Import Dependence and Sourcing Structure
- 5.10 Contract Manufacturing and Outsourcing
- 5.11 Regional Supply and Demand Concentration
Chapter 6 Global Clinical Diagnostics Market Pricing Analysis
- 6.1 Pricing Structure and Measurement
- 6.2 Historical Pricing Trends, 2018-2025
- 6.3 Pricing Outlook, 2025-2035
- 6.4 Average Selling Price and Unit Economics
- 6.5 Pricing by Product and Market Segment
- 6.6 Geographic Pricing Differences
- 6.7 Key Input, Energy, Labor and Logistics Costs
- 6.8 Contract Pricing and Purchasing Models
- 6.9 Pricing Sensitivity and Competitive Positioning
- 6.10 Price, Margin and Profitability Implications
Chapter 7 Global Clinical Diagnostics Market Dynamics
- 7.1 Market Growth Drivers
- 7.1.1 Demand-Side Drivers
- 7.1.2 Technology and Innovation Drivers
- 7.1.3 Infrastructure and Investment Drivers
- 7.1.4 Regulatory and Policy Drivers
- 7.2 Market Restraints
- 7.2.1 Cost and Affordability Constraints
- 7.2.2 Technology and Adoption Barriers
- 7.2.3 Supply Chain and Operational Constraints
- 7.3 Market Challenges
- 7.3.1 Competitive Pressure and Margin Erosion
- 7.3.2 Skills, Infrastructure and Implementation Gaps
- 7.4 Emerging Market Opportunities
- 7.5 Market Dynamics Impact and Time-Horizon Assessment
Chapter 8 Global Clinical Diagnostics Value Chain Analysis
- 8.1 Industry Value Chain Overview
- 8.2 Upstream Suppliers and Critical Inputs
- 8.3 Technology and Component Providers
- 8.4 Manufacturing or Service Delivery
- 8.5 Distribution, Channel Partners and Integrators
- 8.6 Downstream Applications and End Users
- 8.7 Value Addition and Profit Pools
- 8.8 Vertical Integration and Outsourcing
- 8.9 Supplier Concentration and Risk
- 8.10 Supply Chain Localization and Resilience
Chapter 9 Global Clinical Diagnostics Market Regulations and Policies
- 9.1 Relevant Laws, Standards and Compliance Frameworks
- 9.2 Product, Service, Safety and Quality Requirements
- 9.3 Government Policies, Incentives and Subsidies
- 9.4 Imports, Exports and Trade Barriers
- 9.5 Public Procurement and Local Content Requirements
- 9.6 Environmental and Sustainability Compliance
- 9.7 Upcoming Policy Changes and Market Implications
Chapter 10 Global Clinical Diagnostics Market Hotspots and Opportunities
- 10.1 Market Opportunity Mapping and Growth Hotspots
- 10.2 High-Growth Applications and Customer Groups
- 10.3 Underserved Markets and White-Space Opportunities
- 10.4 Emerging Technology and Product Opportunities
- 10.5 New Capacity and Investment Hotspots
- 10.6 Market Entry and Expansion Opportunities
- 10.7 Distribution and Partnership Opportunities
- 10.8 Near-Term and Long-Term Commercial Potential
- 10.9 Opportunity Attractiveness and Execution Risks
Chapter 11 Global Clinical Diagnostics Market Outlook, 2025-2035
- 11.1 Market Size and Analysis
- 11.1.1 Revenue (Market Measurement: 2025: USD 92.37 billion → 2035: USD 147.31 billion)
- 11.1.2 Market Volume and Quantity Sold
- 11.1.3 Historical Market Size, 2018-2025
- 11.1.4 Base-Year Market Size, 2025
- 11.2 Market Forecast, 2025-2035
- 11.2.1 Revenue Forecast to 2035
- 11.2.2 Volume Forecast to 2035
- 11.2.3 CAGR and Year-on-Year Growth
- 11.2.4 Incremental Revenue Opportunity
- 11.3 Forecast Assumptions and Scenario Analysis
- 11.3.1 Base-Case Forecast
- 11.3.2 Optimistic and Conservative Scenarios
- 11.3.3 Technology, Pricing and Policy Sensitivities
- 11.4 Market Attractiveness and Growth Outlook
Chapter 12 Global Clinical Diagnostics Market Segmentation and Outlook
- 12.1 Segmentation Summary and Market Shares, 2025
- 12.2 Largest and Fastest-Growing Segments
- 12.3 By Product - Market Size and Forecast, 2025-2035
- 12.3.1 Segment Definition and Scope
- 12.3.2 Historical Market Size, 2018-2025
- 12.3.3 Revenue Forecast, 2025-2035
- 12.3.4 Volume Forecast, 2025-2035
- 12.3.5 Base-Year Market Share, 2025
- 12.3.6 Segment CAGR and Growth Drivers
- 12.3.7 Subsegment Market Size and Forecast
- 12.3.7.1 Kits
- 12.3.7.2 Instrument
- 12.3.7.3 Consumables
- 12.3.8 Subsegment Pricing and Adoption Trends
- 12.3.9 Leading Suppliers and Competition
- 12.3.10 Regional Demand and Opportunities
- 12.4 By Test Type - Market Size and Forecast, 2025-2035
- 12.4.1 Segment Definition and Scope
- 12.4.2 Historical Market Size, 2018-2025
- 12.4.3 Revenue Forecast, 2025-2035
- 12.4.4 Volume Forecast, 2025-2035
- 12.4.5 Base-Year Market Share, 2025
- 12.4.6 Segment CAGR and Growth Drivers
- 12.4.7 Subsegment Market Size and Forecast
- 12.4.7.1 Lab Based
- 12.4.7.2 Point of Care
- 12.4.7.3 Home Based Test
- 12.4.8 Subsegment Pricing and Adoption Trends
- 12.4.9 Leading Suppliers and Competition
- 12.4.10 Regional Demand and Opportunities
- 12.5 By Technology - Market Size and Forecast, 2025-2035
- 12.5.1 Segment Definition and Scope
- 12.5.2 Historical Market Size, 2018-2025
- 12.5.3 Revenue Forecast, 2025-2035
- 12.5.4 Volume Forecast, 2025-2035
- 12.5.5 Base-Year Market Share, 2025
- 12.5.6 Segment CAGR and Growth Drivers
- 12.5.7 Subsegment Market Size and Forecast
- 12.5.7.1 Immunoassay & Immunochemistry
- 12.5.7.2 Clinical Chemistry
- 12.5.7.3 Molecular Diagnostics
- 12.5.7.4 Hematology
- 12.5.7.5 Coagulation & Hemostasis
- 12.5.7.6 Microbiology
- 12.5.7.7 Urinalysis
- 12.5.7.8 Others
- 12.5.8 Subsegment Pricing and Adoption Trends
- 12.5.9 Leading Suppliers and Competition
- 12.5.10 Regional Demand and Opportunities
- 12.6 By Application - Market Size and Forecast, 2025-2035
- 12.6.1 Segment Definition and Scope
- 12.6.2 Historical Market Size, 2018-2025
- 12.6.3 Revenue Forecast, 2025-2035
- 12.6.4 Volume Forecast, 2025-2035
- 12.6.5 Base-Year Market Share, 2025
- 12.6.6 Segment CAGR and Growth Drivers
- 12.6.7 Subsegment Market Size and Forecast
- 12.6.7.1 Infectious Diseases
- 12.6.7.2 Oncology
- 12.6.7.3 Genetic Testing
- 12.6.7.4 Cardiovascular Disease
- 12.6.7.5 Others
- 12.6.8 Subsegment Pricing and Adoption Trends
- 12.6.9 Leading Suppliers and Competition
- 12.6.10 Regional Demand and Opportunities
- 12.7 Segment Growth Comparison
- 12.8 Segment Attractiveness and Priority Matrix
Chapter 13 Global Clinical Diagnostics End-Use and Application Market Outlook
- 13.1 End-Use Industry and Customer Demand Structure
- 13.2 Leading Applications and Customer Groups
- 13.3 End-Use Market Size, Share and Forecast
- 13.4 Major End-Use Industry Deep Dives
- 13.4.1 Customer Requirements and Use Cases
- 13.4.2 Demand and Replacement Cycles
- 13.4.3 Technical and Regulatory Considerations
- 13.4.4 Purchasing and Procurement Models
- 13.4.5 Leading Vendors and Distribution Channels
- 13.4.6 Forecast and Commercial Opportunities
- 13.5 Emerging Applications and Cross-Segment Demand
- 13.6 End-Use Industry Investment Priorities
Chapter 14 Global Clinical Diagnostics Geographic Market Outlook, 2025-2035
- 14.1 Regional Market Size and Share, 2025
- 14.2 Regional Market Forecast, 2025-2035
- 14.3 Regional Pricing, Production and Demand Differences
- 14.4 North America
- 14.4.1 United States
- 14.4.2 Canada
- 14.4.3 Mexico
- 14.5 Europe
- 14.5.1 Germany
- 14.5.2 France
- 14.5.3 Italy
- 14.5.4 United Kingdom
- 14.5.5 Spain
- 14.5.6 Poland
- 14.5.7 Russia
- 14.5.8 Netherlands
- 14.5.9 Belgium
- 14.5.10 Sweden
- 14.5.11 Denmark
- 14.5.12 Norway
- 14.5.13 Rest of Europe
- 14.6 Asia Pacific
- 14.6.1 China
- 14.6.2 India
- 14.6.3 Japan
- 14.6.4 South Korea
- 14.6.5 Thailand
- 14.6.6 Indonesia
- 14.6.7 Vietnam
- 14.6.8 Malaysia
- 14.6.9 Australia
- 14.6.10 Rest of Asia Pacific
- 14.7 Latin America
- 14.7.1 Brazil
- 14.7.2 Argentina
- 14.7.3 Colombia
- 14.7.4 Chile
- 14.7.5 Rest of Latin America
- 14.8 Middle East
- 14.8.1 Saudi Arabia
- 14.8.2 United Arab Emirates
- 14.8.3 Turkey
- 14.8.4 Israel
- 14.8.5 Iran
- 14.8.6 Rest of the Middle East
- 14.9 Africa
- 14.9.1 South Africa
- 14.9.2 Egypt
- 14.9.3 Nigeria
- 14.9.4 Morocco
- 14.9.5 Rest of Africa
- 14.10 Regional Investment, Policy and Supply Chain Differences
- 14.11 Regional Competitive Landscape
- 14.12 Geographic Growth Hotspots
Chapter 15 Global Clinical Diagnostics Technology, Innovation and Sustainability Outlook
- 15.1 Technology Landscape and Maturity
- 15.2 Product, Process and Service Innovation
- 15.3 AI, Automation and Digital Tools in the Industry
- 15.4 Technology Adoption and Performance Benchmarking
- 15.5 Innovation Pipeline and R&D Investment
- 15.6 Patent and Intellectual Property Trends
- 15.7 Energy Efficiency and Resource Management
- 15.8 Sustainability, Recycling and Circularity
- 15.9 Technology Roadmap, 2025-2035
- 15.10 Risks of Obsolescence and Technology Substitution
Chapter 16 Global Clinical Diagnostics Market Key Strategic Imperatives
- 16.1 Growth and Market Entry Priorities
- 16.2 High-Return Products and Segments
- 16.3 Pricing, Profitability and Cost Optimization
- 16.4 Technology Investment and Product Differentiation
- 16.5 Supply Chain Localization and Resilience
- 16.6 Distribution and Customer Acquisition
- 16.7 Partnership, Acquisition and Capacity Strategy
- 16.8 Regional Expansion Priorities
- 16.9 Short-, Medium- and Long-Term Actions
Chapter 17 Competition Outlook
- 17.1 Industry Competition Characteristics
- 17.2 Market Structure and Concentration
- 17.3 Market Share and Competitive Positioning, 2025
- 17.4 Company-Wise Revenue and Product Benchmarking
- 17.5 Production and Service Capacity Benchmarking
- 17.6 Technology, Pricing and Differentiation
- 17.7 Regional Footprint and Distribution Strength
- 17.8 Mergers, Acquisitions and Strategic Alliances
- 17.9 New Entrants and Competitive Threats
- 17.10 Porter's Five Forces and Industry Attractiveness
- 17.11 Competitive Outlook, 2025-2035
Chapter 18 Company Profiles
- 18.1 Company Coverage and Selection Criteria
- 18.2 Randox Laboratories
- 18.2.1 Business Description
- 18.2.2 Company Ownership and Geographic Presence
- 18.2.3 Product and Service Portfolio
- 18.2.4 Manufacturing and Operating Footprint
- 18.2.5 Production Capacity and Expansion Plans
- 18.2.6 Financial Performance and Investment
- 18.2.7 Market Share and Competitive Position
- 18.2.8 Technology and Innovation Capabilities
- 18.2.9 Strategic Alliances or Partnerships
- 18.2.10 Recent Developments
- 18.2.11 Growth Strategy and Outlook
- 18.3 BD
- 18.4 bioMerieux SA
- 18.5 Bio-Rad Laboratories, Inc.
- 18.6 Abbott
- 18.7 Agilent Technologies, Inc.
- 18.8 Danaher Corporation
- 18.9 Hologic Inc.
- 18.10 Illumina, Inc.
- 18.11 QIAGEN
- 18.12 Siemens Healthineers AG
- 18.13 Sysmex Corporation
- 18.14 Other Relevant Market Participants
Note: Every listed company is profiled on the structure shown under the first company. The company list is preliminary and may change based on research findings, market developments, data availability and client requirements.
Chapter 19 Disclaimer
- 19.1 Research and Forecast Disclaimer
- 19.2 Data Source and Estimation Limitations
Note: The depth of individual sections depends on data availability for this market. Volume, capacity, trade and other unit-based metrics are included where applicable.