
Plasma therapies now drive most blood products spending
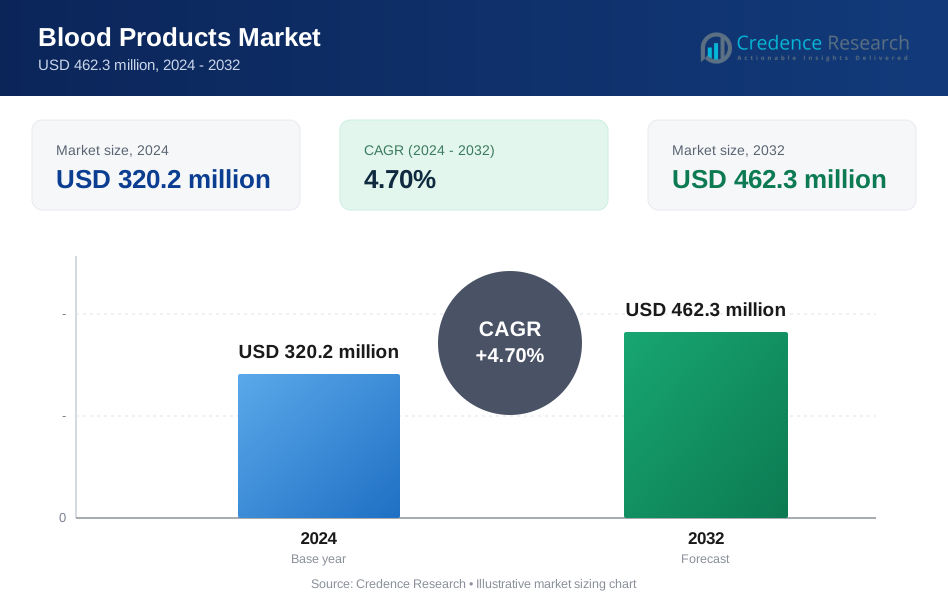
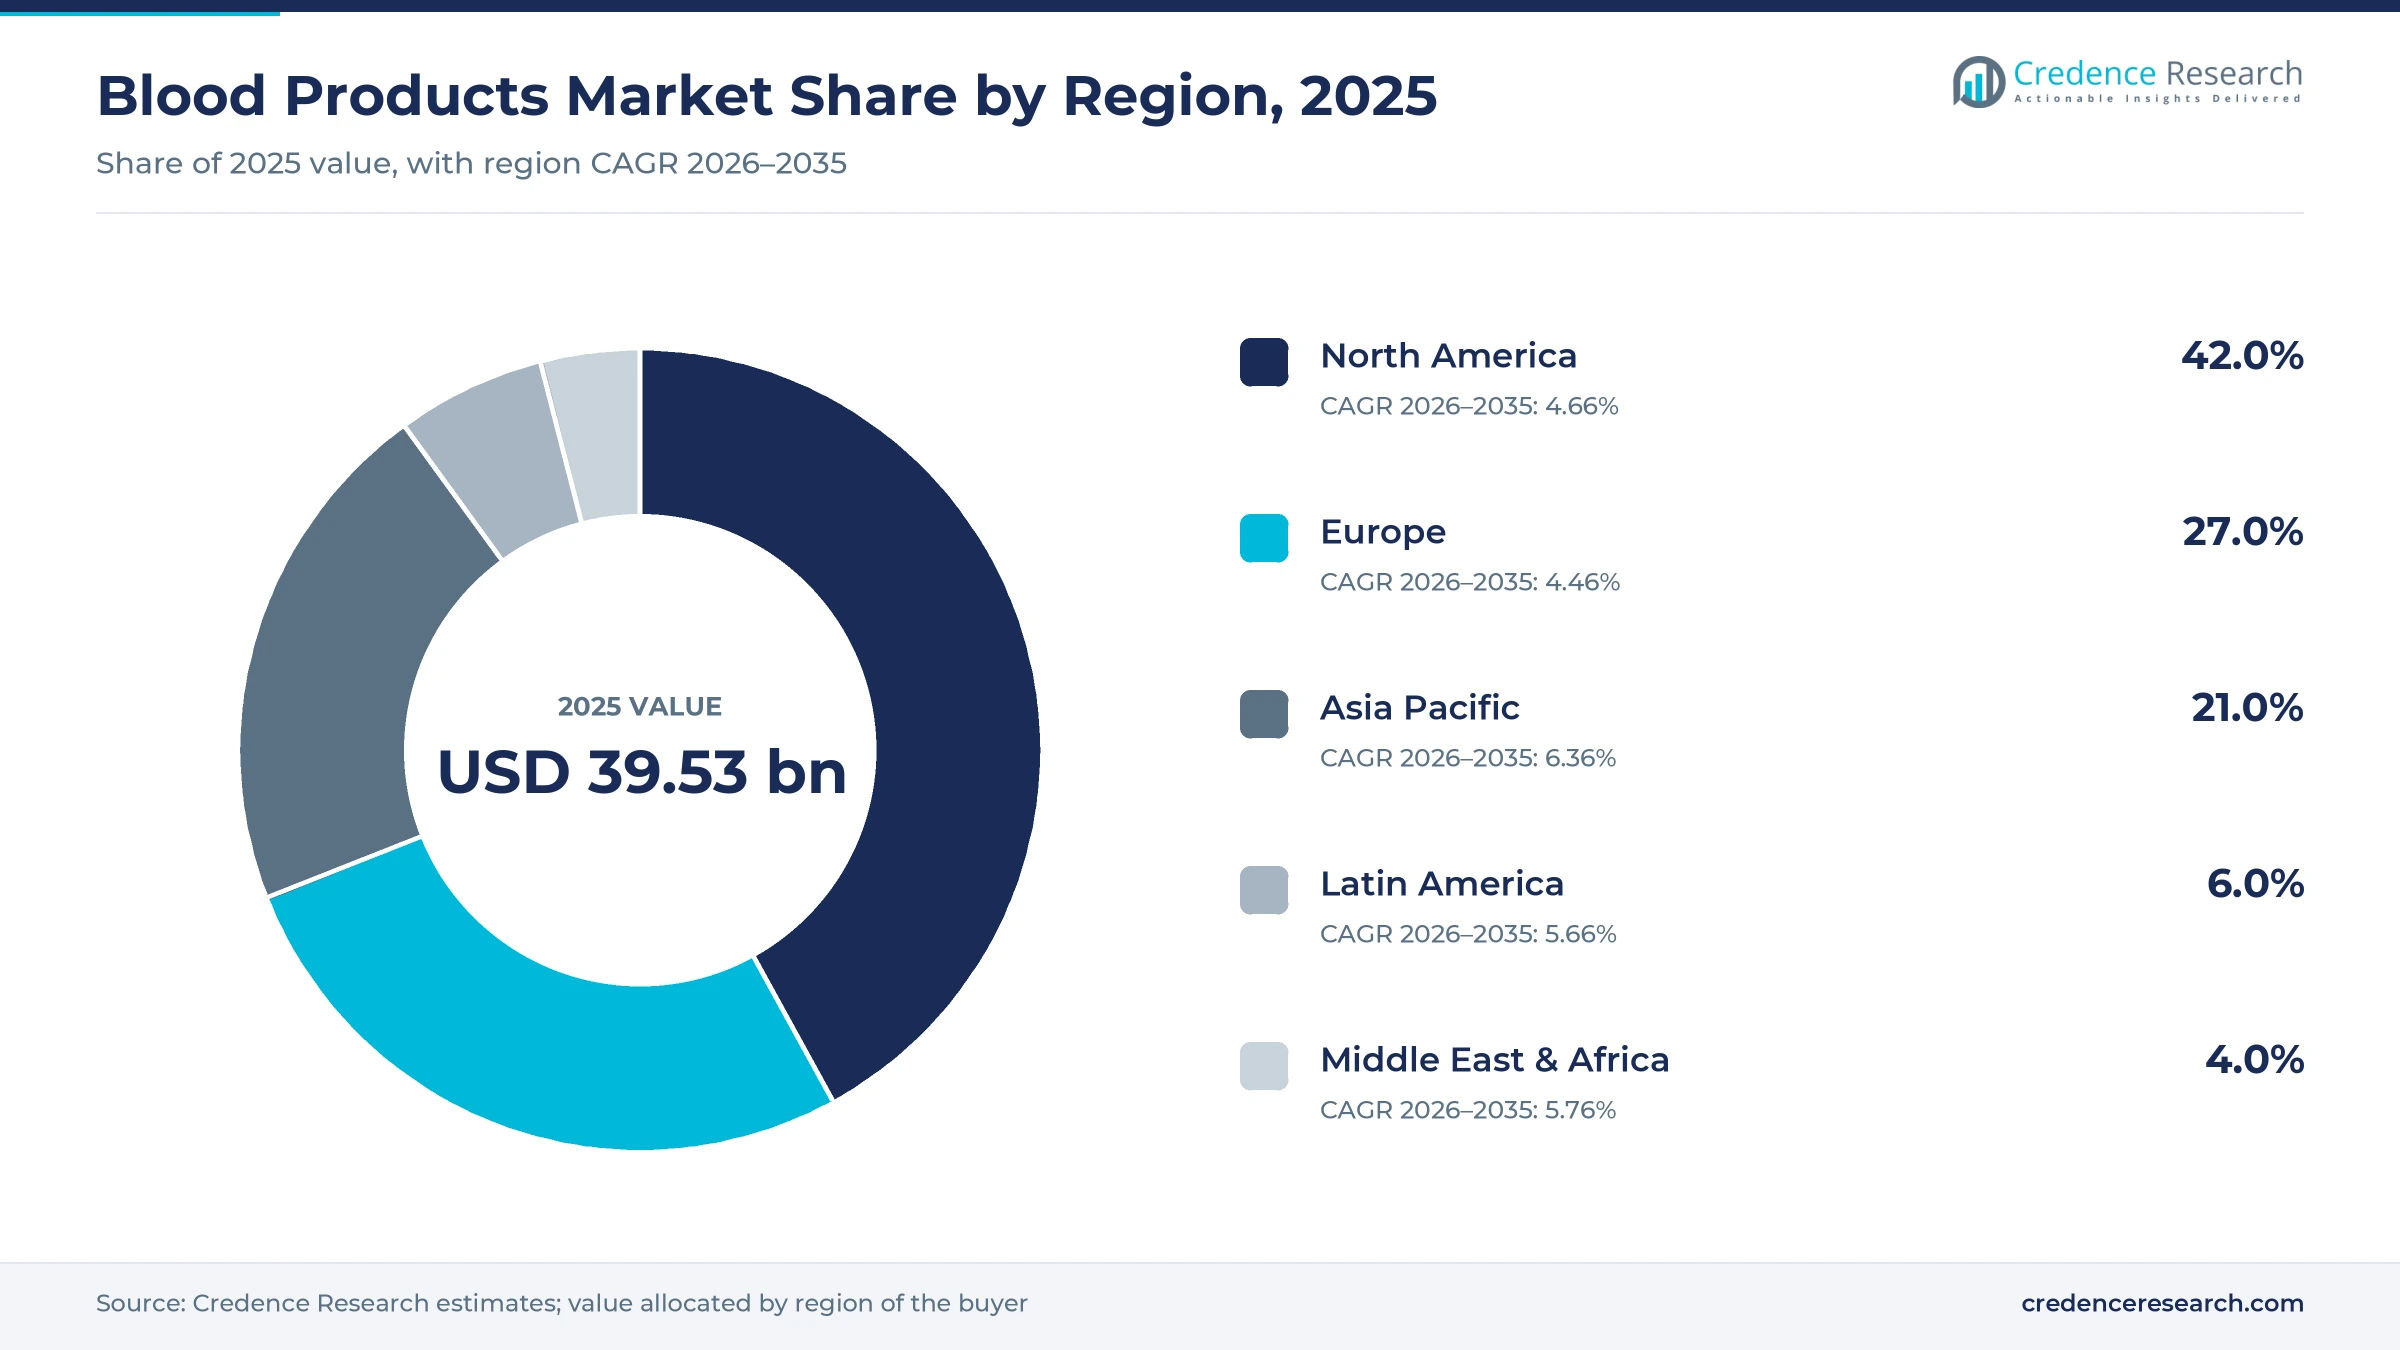
The global blood products market was valued at USD 39.53 billion in 2025 and is projected to increase from USD 41.54 billion in 2026 to USD 64.95 billion by 2035, registering a CAGR of 5.09% during 2026–2035. Demand comes from patients who need immunoglobulins for immune and nerve disorders, clotting factors and fibrinogen for bleeding, albumin for critical care and transfused components for surgery, trauma and cancer care. North America held the largest regional share, 42.0% in 2025, because the United States supplies most of the world's source plasma and pays the highest prices for plasma-derived therapies. Asia Pacific is the fastest-growing region at 6.36% a year, as China, India and Southeast Asia expand collection and treatment access. The commercial picture shifted after 2024, when U.S. regulators approved several new intravenous immunoglobulin brands and cleared donor-specific plasma collection technology. As a result, growth now depends on how much plasma companies can collect and fractionate each year.
Which therapies and blood components does this analysis cover?
The analysis counts whole blood, transfusion components such as red cell concentrates, platelets and plasma, and plasma-derived therapies such as immunoglobulins, albumin, clotting factors and fibrinogen concentrate. Hospitals and blood banks buy transfusion components from blood services, while specialty pharmacies, hospital formularies and national tenders purchase plasma-derived therapies from fractionation companies.
Recombinant clotting factors, gene therapies and collection devices sit outside the value counted here, although they shape demand. The value chain runs from donor centers and plasma collection networks through testing, fractionation and fill-finish to distributors, hospitals and home infusion providers.
Blood Products Market Insights
- The blood products market grows from USD 39.53 billion in 2025 to USD 64.95 billion by 2035, a 5.09% CAGR driven by immunoglobulin use and surgical demand.
- North America held 42.0% of global value in 2025, because the United States collects most source plasma used for fractionation worldwide.
- Plasma-derived therapies led product categories with 58.0% of 2025 value, while neurology grows fastest among applications at 6.21% a year.
- In June 2026, the World Health Organization reported 120.4 million blood donations a year, with 36% collected in high-income countries.
- U.S. approvals of Yimmugo in 2024 and Qivigy in 2025 widened immunoglobulin supply, which raises competition among plasma fractionation companies.
Plasma-derived therapies lead as neurology uses expand
Why do plasma-derived therapies hold most of the value?
Based on product category, the market is categorized into whole blood, blood components and plasma-derived products. Plasma-derived Products led with a 58.0% share of 2025 value, because immunoglobulins, albumin and clotting factors sell at far higher prices than transfused units. This category also grows fastest at 5.52% a year, as immunoglobulin use expands in immune and nerve disorders. Whole blood keeps a smaller role, because most hospitals now transfuse separated components.
Which clinical uses account for most spending?
Based on application, the market is categorized into hematology, immunology, neurology, oncology and others. Immunology led with a 34.0% share of 2025 value, because primary immunodeficiency patients need lifelong immunoglobulin replacement. Neurology grows fastest at 6.21% a year, as regulators add nerve disorder indications such as chronic inflammatory demyelinating polyneuropathy. Hematology remains large, because anemia, bleeding disorders and surgery still require regular transfusion support.
Where are transfusions and infusions delivered?
Based on end user, the market is categorized into hospitals, blood banks, ambulatory surgical centers and others. Hospitals led with a 58.0% share of 2025 value, because surgery, trauma care, oncology wards and intensive care units consume most transfused units and albumin. Ambulatory Surgical Centers grow fastest at 6.20% a year, as more elective procedures move to outpatient settings. Blood banks hold inventory and manage compatibility testing for hospital networks.
| Segment Group | Leading Sub-segment | Share, 2025 | Fastest-growing Sub-segment | CAGR, 2026–2035 |
|---|---|---|---|---|
| By Product Category | Plasma-derived Products | 58.0% | Plasma-derived Products | 5.52% |
| By Application | Immunology | 34.0% | Neurology | 6.21% |
| By End User | Hospitals | 58.0% | Ambulatory Surgical Centers | 6.20% |
Request a Free Sample
Fill in your details and we'll send you a free sample report.
- Sample data tables & charts
- Research methodology
Immunoglobulin demand and surgery volumes lift spending
How is immunoglobulin demand reshaping the market?
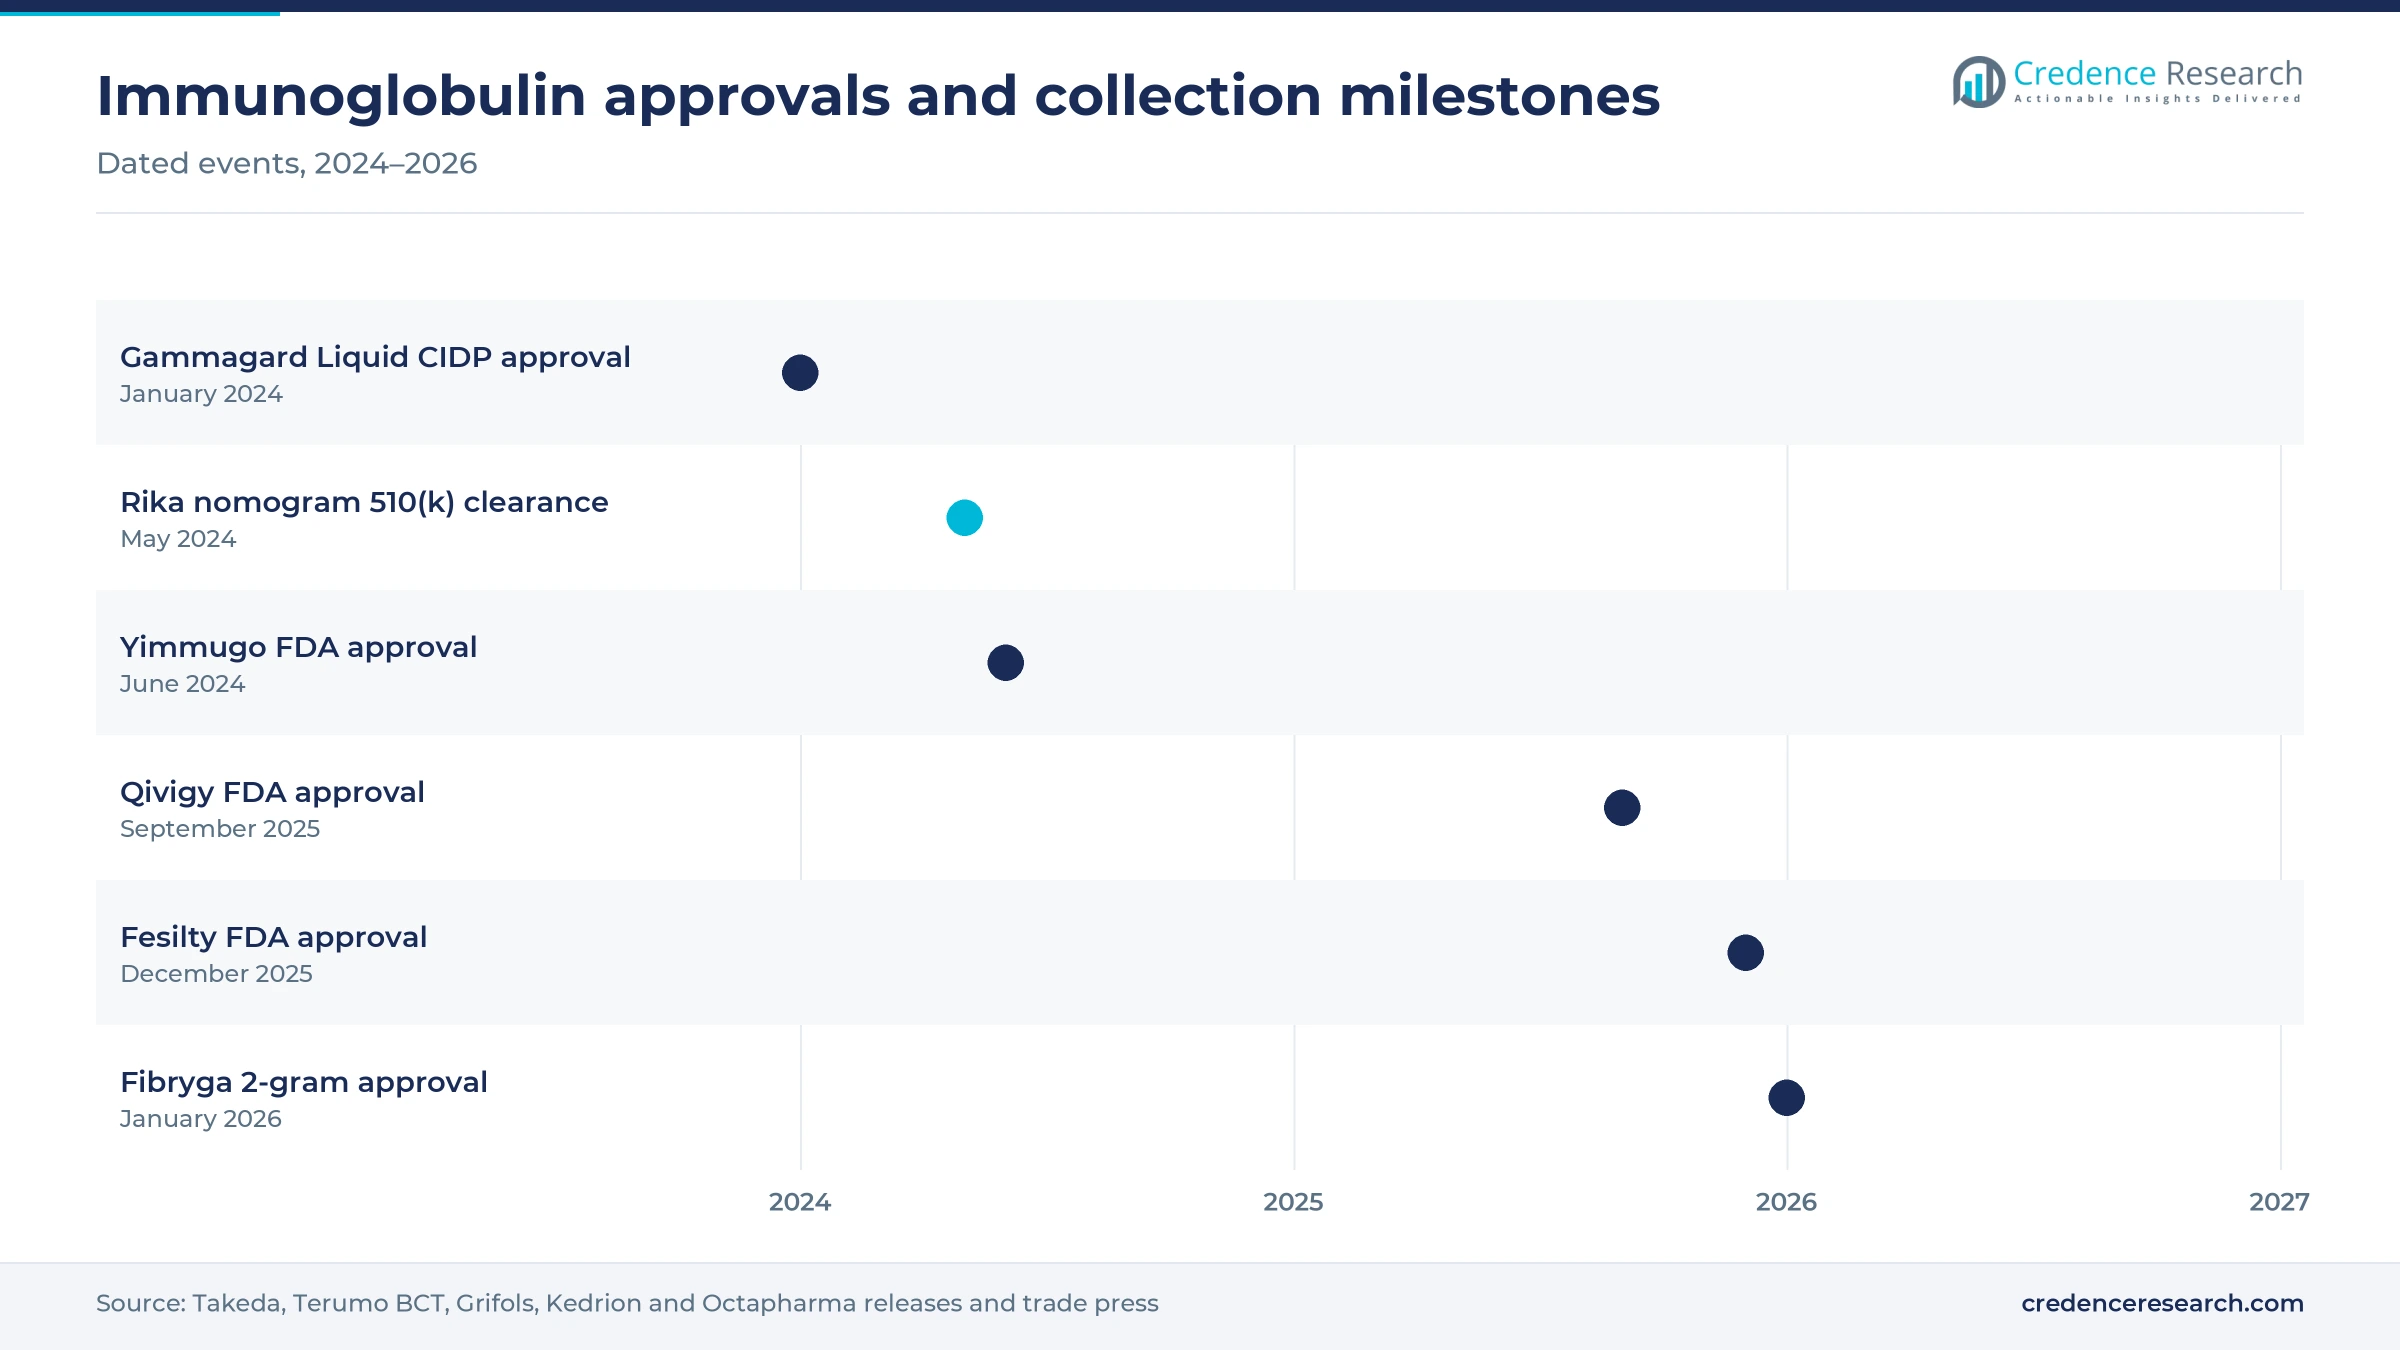
Immunoglobulin demand is the strongest growth driver, because patients with primary immunodeficiency and several nerve disorders need regular infusions for years, often every three to four weeks. In January 2024, Takeda received FDA approval for Gammagard Liquid in adults with chronic inflammatory demyelinating polyneuropathy, adding a neurology indication to an established brand. Physicians in North America and Europe now diagnose these conditions earlier, which lengthens time on therapy. As a result, intravenous immunoglobulin volumes keep rising faster than other plasma proteins.
Why do surgery, trauma and cancer care sustain transfusion volumes?
Hospital procedures keep transfusion volumes steady, because major surgery, trauma care and cancer treatment often require red cells, platelets and plasma. The World Health Organization reports that 120.4 million blood donations are collected worldwide each year, yet only 36% come from high-income countries that hold 15% of the world population. Around 21.5 million liters of plasma from 36 reporting countries were fractionated in the latest reporting year. This gap means demand in middle-income countries remains far above available supply. In turn, wider surgical access in Asia and Latin America adds steady transfusion demand.
How do bleeding disorders support plasma protein demand?
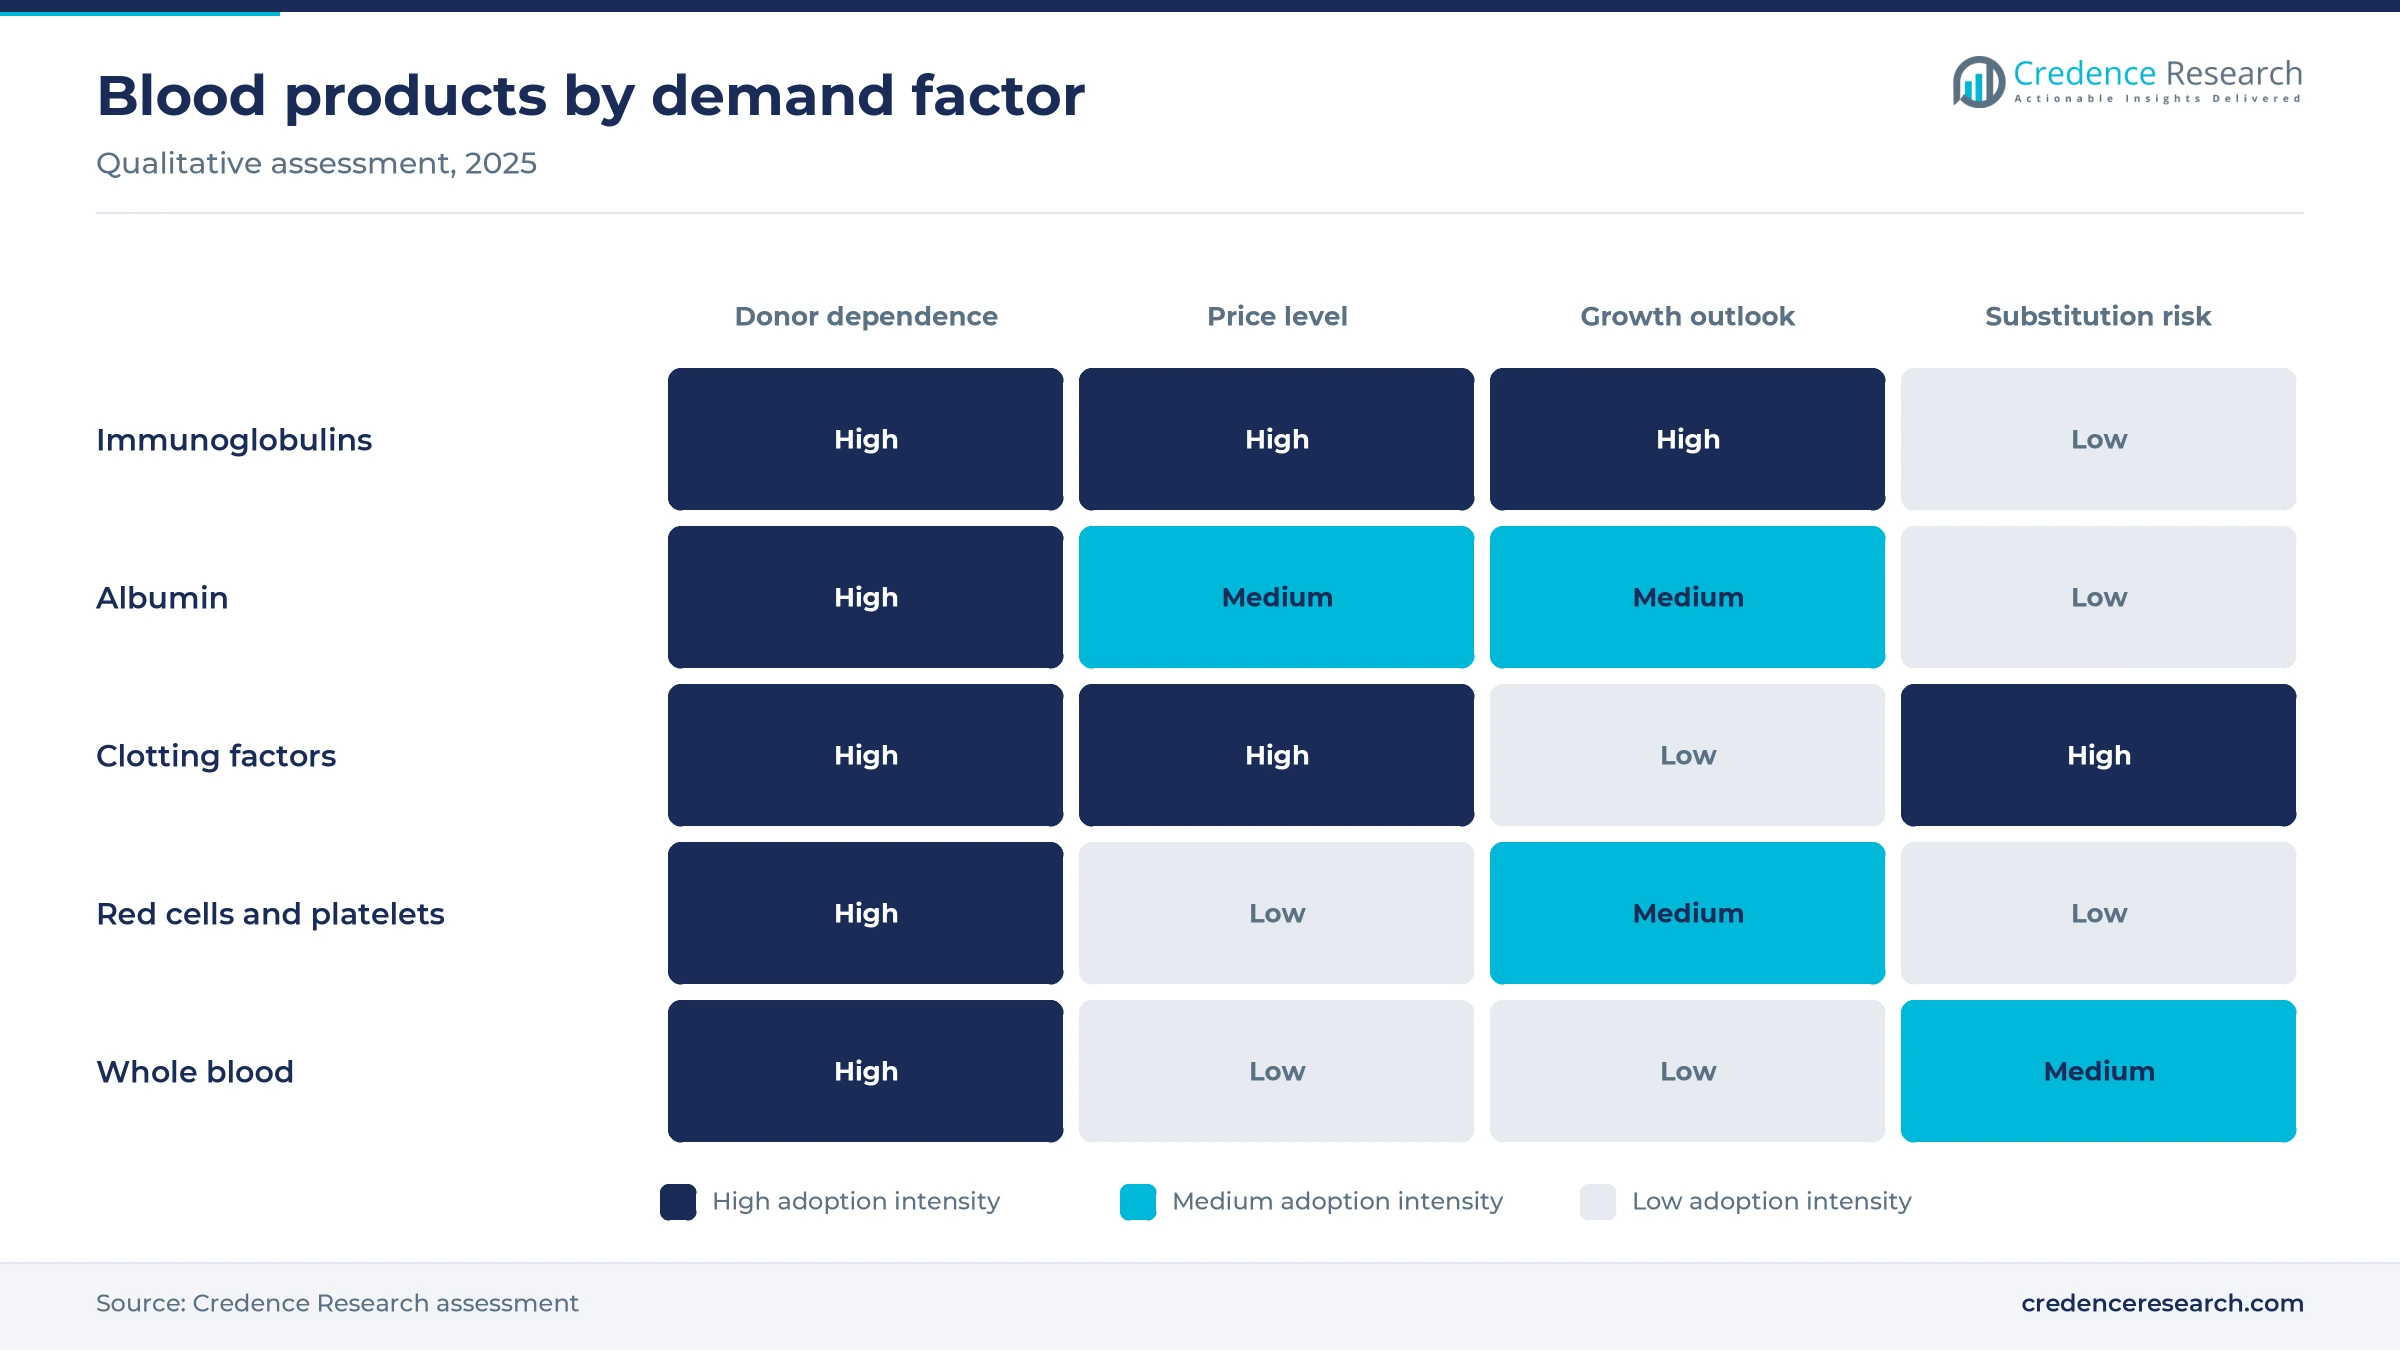
Bleeding disorders support stable demand for clotting factors and fibrinogen, because patients need prophylaxis or rapid replacement during surgery and acute bleeding. Plasma-derived factor concentrates remain important in many middle-income countries, where national tenders favor lower-cost supply over recombinant options. Some patients with inhibitors also depend on plasma-derived bypassing agents. However, hemophilia treatment is shifting toward non-factor therapies in high-income countries, which limits growth in that part of the portfolio.
Why does an aging population raise therapy use?
Aging populations raise therapy use, because older adults undergo more surgery, develop more cancers and face higher risks of anemia and bleeding. Critical care units also use albumin for patients with liver disease, burns and shock, and those patients are older on average. This demand is concentrated in Japan, Western Europe and North America, where health systems already fund advanced care for people over 65. As a result, consumption per person keeps rising even when donor numbers stay flat.
New immunoglobulin brands and smarter collection tools
How are new immunoglobulin brands widening supply?
New brands are widening U.S. supply, because several European fractionators have now cleared FDA review for their intravenous products. In June 2024, Grifols said its Biotest unit received FDA approval for Yimmugo, the first U.S.-approved medicine in the Biotest portfolio. In September 2025, Kedrion Biopharma received FDA approval for Qivigy, a 10% intravenous immunoglobulin for adults with primary humoral immunodeficiency. As a result, hospitals and specialty pharmacies gain more supplier choice.
Is donor-specific collection raising plasma yields?
Collection centers are shifting toward donor-specific volumes, because larger safe collections cut the cost of each liter of plasma. In May 2024, Terumo Blood and Cell Technologies received FDA 510(k) clearance for its Rika Plasma Donation System with an individualized nomogram. The tool sets collection volume from each donor's height, weight and hematocrit on the day of donation. In turn, fractionators can expand output without opening as many new centers, and apheresis equipment makers gain a software upgrade path.
Where can new fractionation capacity open growth?
National fractionation programs are a clear opening for suppliers, because the WHO reports that only 49 of 168 reporting countries produce plasma-derived therapies from their own plasma. Many middle-income countries import most immunoglobulins and albumin, which exposes them to shortages and high prices. Contract plasma fractionation agreements and toll manufacturing let these countries convert local plasma into therapies. As a result, companies with spare capacity can win long-term government contracts.
Can new plasma proteins create premium niches?
New plasma proteins create premium opportunities, because specialized concentrates treat rare conditions that standard therapies do not cover. In January 2026, Octapharma said it had received FDA approval for a new 2-gram formulation of fibryga for patients with acquired fibrinogen deficiency. Larger vial sizes simplify dosing during cardiac surgery and major bleeding. In turn, fibrinogen concentrate can replace part of the cryoprecipitate used in hospitals, especially after Grifols launched its Fesilty concentrate in June 2026.
Donor supply and fractionation capacity limit growth
Why does donor supply limit growth?
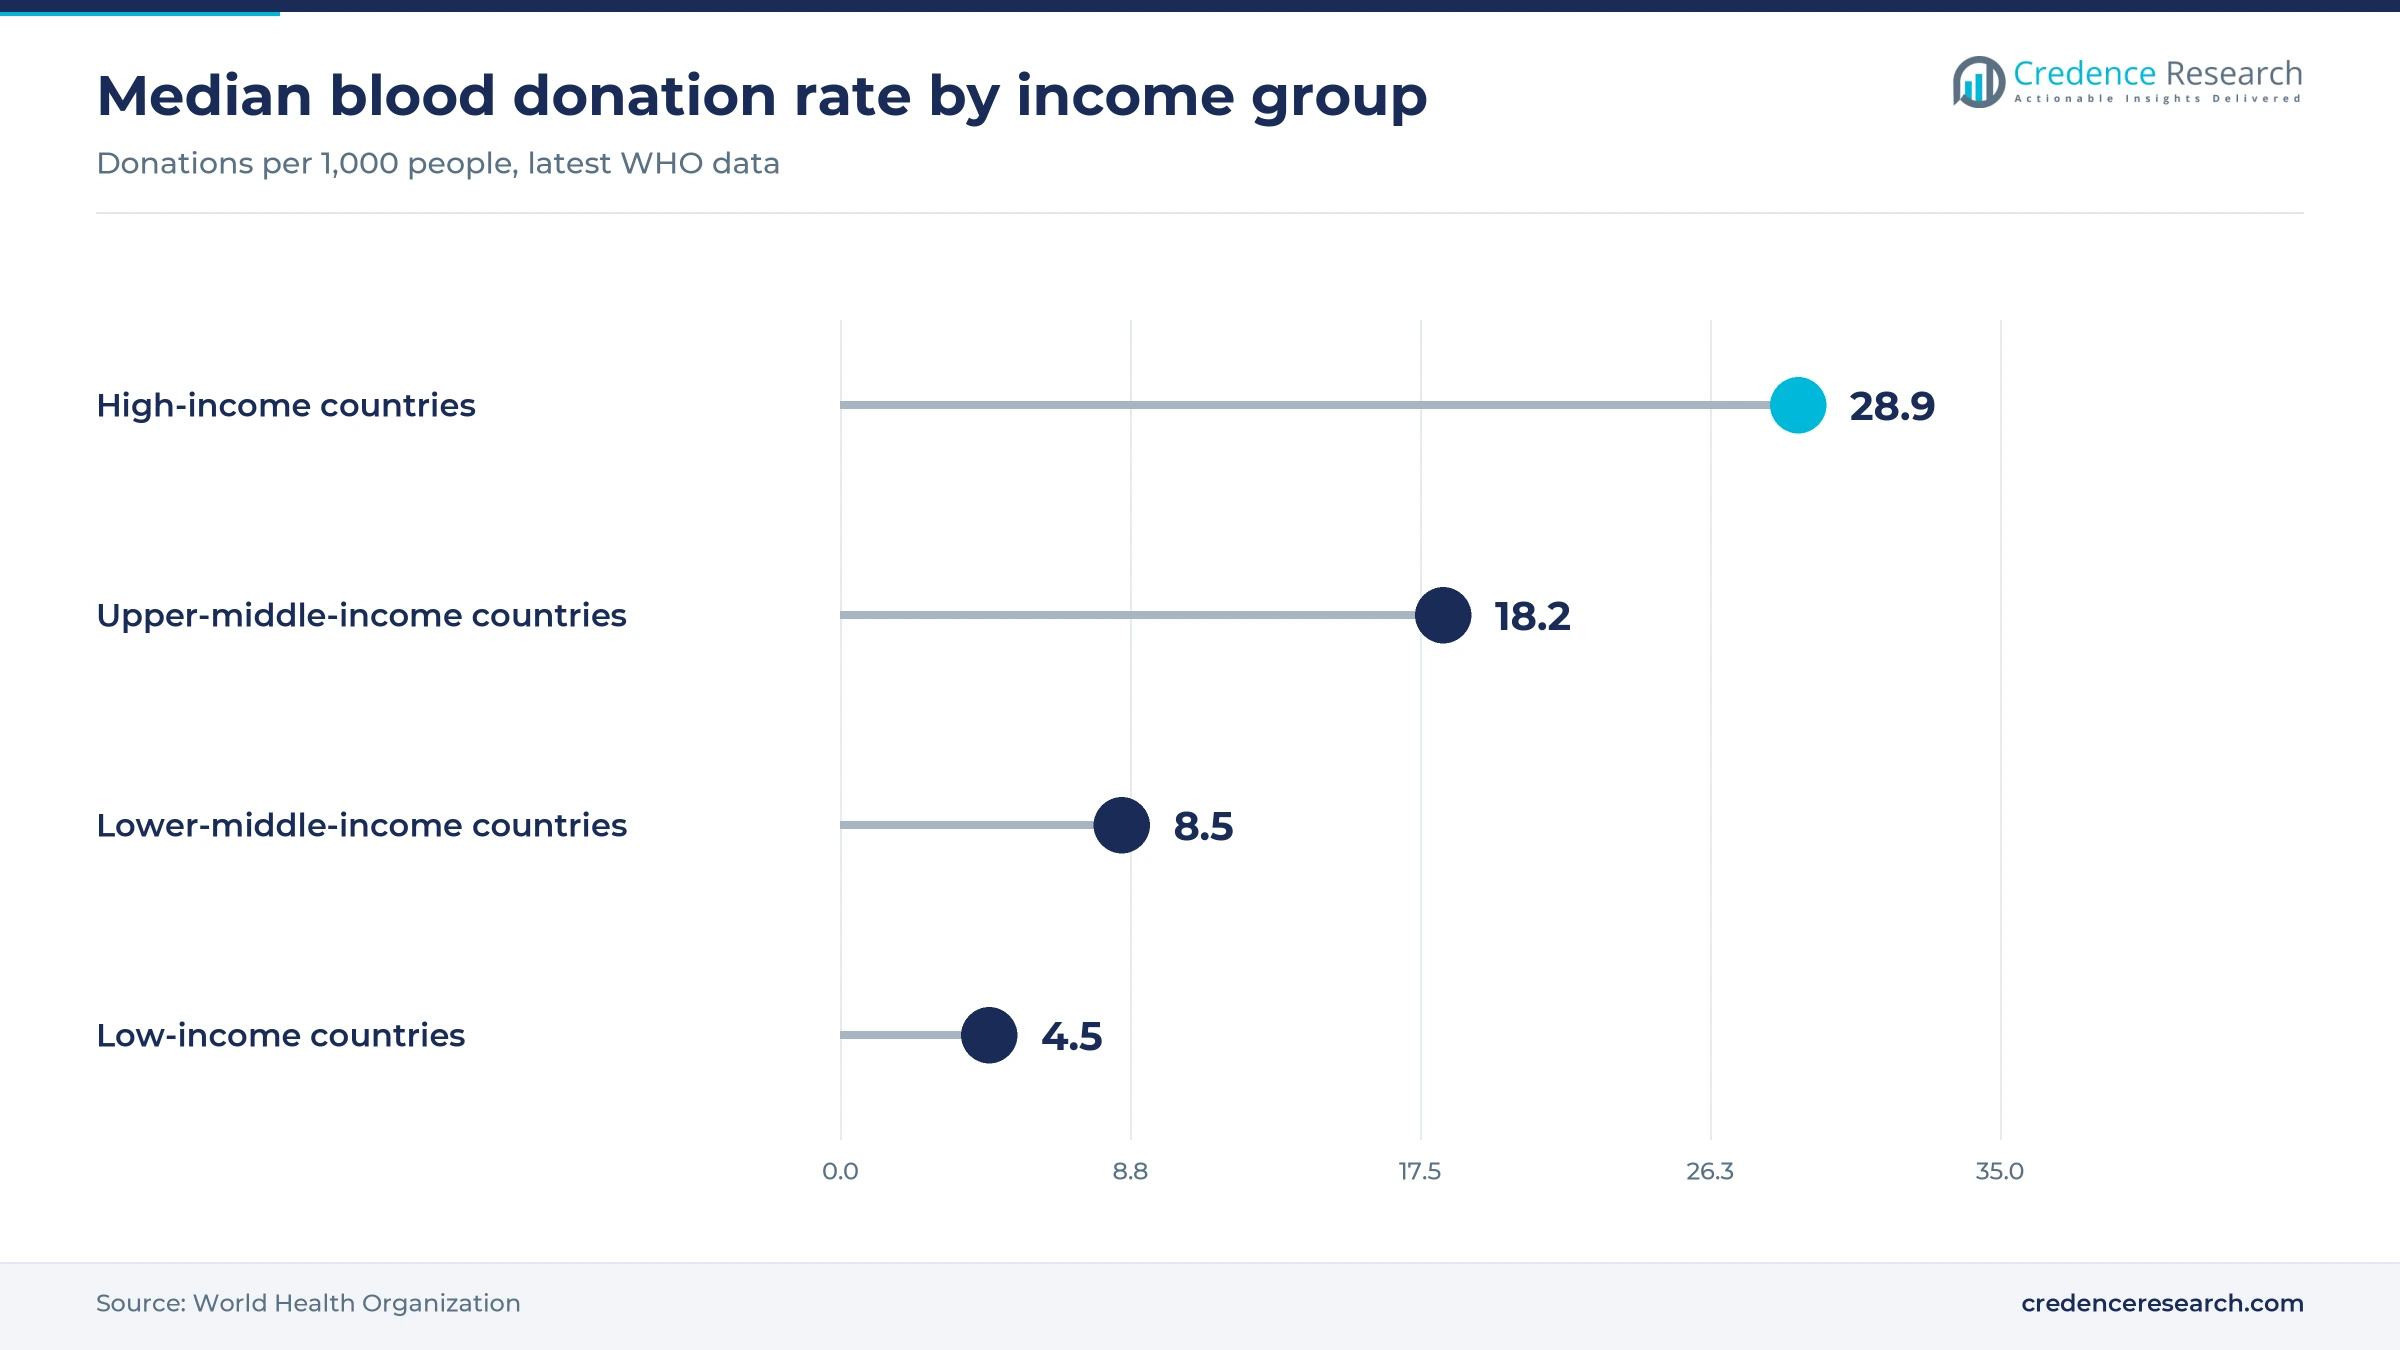
Donor supply is the main constraint, because every liter of plasma and every transfused unit depends on voluntary or compensated donors. The WHO reports a median of 4.5 donations per 1,000 people in low-income countries, against 28.9 in high-income countries. Many health systems therefore struggle to meet transfusion needs during holidays, epidemics and natural disasters. As a result, supply shortfalls cap volume growth even where clinical demand is strong.
How do long production cycles slow the response to demand?
Long production cycles slow the response to demand, because plasma must be tested, held, pooled and fractionated before release. The full cycle from donation to finished immunoglobulin can take many months, which makes it hard to react to sudden demand peaks. New fractionation plants also require years of construction and regulatory inspection. This lag means that shortages of immunoglobulin and albumin can persist for long periods.
Why does regulation raise costs for collectors and fractionators?
Strict regulation raises costs for collectors and fractionators, because every donation needs screening for HIV, hepatitis B, hepatitis C and syphilis. Plants must also pass inspections from several regulators before they can sell in each region. These requirements protect patients, but they lengthen launch timelines for new brands and limit the number of qualified suppliers. As a result, smaller companies find it difficult to enter major markets.
Do recombinant and non-factor therapies erode demand?
Recombinant and non-factor therapies erode part of the demand for plasma proteins, because they avoid donor dependence and offer longer dosing intervals. Patients with hemophilia in high-income countries increasingly use subcutaneous non-factor agents instead of plasma-derived factors. Gene therapies may also reduce lifelong replacement for some hemophilia patients. However, immunoglobulins and albumin have no broad recombinant alternative, which keeps the core of the market tied to plasma.
North America leads as Asia Pacific builds plasma supply
| Region | Value, 2025 (USD billion) | Share, 2025 | CAGR, 2026–2035 |
|---|---|---|---|
| North America | 16.60 | 42.0% | 4.66% |
| Europe | 10.67 | 27.0% | 4.46% |
| Asia Pacific | 8.30 | 21.0% | 6.36% |
| Latin America | 2.37 | 6.0% | 5.66% |
| Middle East & Africa | 1.58 | 4.0% | 5.76% |
Why does North America hold the largest regional share?
North America held a 42.0% share of 2025 value and grows at 4.66% a year through 2035. The United States runs the world's largest network of compensated plasma centers, which supplies fractionators that sell across every region. High immunoglobulin use in immune and nerve disorders also lifts value per patient. However, new brand entries add price competition in hospital and specialty pharmacy channels.
How fast is Asia Pacific adding demand?
Asia Pacific held a 21.0% share of 2025 value and is the fastest-growing region at 6.36% a year. China operates a large domestic plasma industry, while India and Southeast Asia rely more on imported immunoglobulins and albumin. Expanding insurance coverage and hospital capacity raise transfusion and infusion volumes across the region. As a result, suppliers are building local partnerships and contract fractionation arrangements.
What shapes demand across Europe?
Europe held a 27.0% share of 2025 value and grows at 4.46% a year, the slowest pace of the five regions. Most European countries rely on voluntary unpaid donors and collect less plasma than they use, so they import part of their immunoglobulin supply. National tenders hold down prices for albumin and clotting factors. However, Grifols, Octapharma, Kedrion and Biotest keep large manufacturing bases in the region.
Where is Latin America adding demand?
Latin America held a 6.0% share of 2025 value and grows at 5.66% a year through 2035. Brazil, Mexico and Argentina lead regional demand, where public health systems buy plasma-derived therapies through national tenders. Several governments are also exploring contract fractionation of local plasma to reduce import dependence.
What limits growth in the Middle East and Africa?
The Middle East and Africa held a 4.0% share of 2025 value and grows at 5.76% a year through 2035. Gulf states fund modern hospitals that use imported immunoglobulins and albumin. Sub-Saharan Africa remains small in value, because low donation rates and limited cold chain capacity restrict access to safe transfusion.
Approvals and collection upgrades since 2024
| Development | Status and market relevance |
|---|---|
| In June 2024, Grifols announced that its Biotest unit received FDA approval for Yimmugo intravenous immunoglobulin for primary immunodeficiencies. | Approved; first U.S.-approved medicine in the Biotest portfolio |
| In September 2025, Kedrion Biopharma announced FDA approval of Qivigy 10% intravenous immunoglobulin for adults with primary humoral immunodeficiency. | Approved; widens U.S. immunoglobulin supply |
| In December 2025, the FDA approved Grifols' Fesilty fibrinogen concentrate for acute bleeding episodes in congenital fibrinogen deficiency. | Approved; offers a purified alternative to cryoprecipitate |
| In January 2026, Octapharma announced FDA approval of a new 2-gram formulation of fibryga for acquired fibrinogen deficiency. | Approved; simplifies dosing in surgical bleeding |
| In June 2026, Grifols launched Fesilty fibrinogen concentrate in the United States for pediatric and adult patients. | On market; adds another fibrinogen concentrate option for U.S. hospitals |
Collection, separation and purification tools to watch
- Donor-specific plasma collection uses each donor's height, weight and hematocrit to set a safe collection volume, which raises plasma yield per visit.
- Automated whole blood processing separates donations into red cells, plasma and platelets with fewer manual steps, which cuts labor for blood centers.
- Pathogen reduction systems treat platelets and plasma to inactivate many viruses and bacteria, which lowers transfusion risk and can extend platelet shelf life.
- Modern chromatography and purification improves immunoglobulin recovery from each liter of plasma, which helps fractionators expand output without new donors.
Need a Custom Version of This Report?
Tailor the scope, geography, or segments to your exact requirements.
- Custom geography or segment scope
- Direct access to our analyst team
Integrated fractionators compete on plasma access
Competition centers on access to plasma, because fractionators with large collection networks can produce more immunoglobulin and albumin. Grifols, CSL Behring, Octapharma and Takeda run integrated models that combine donor centers, fractionation plants and global sales. Kedrion Biopharma and Biotest AG compete with focused portfolios and both added U.S. immunoglobulin approvals after 2024. Fresenius Kabi supplies transfusion technology and infusion therapies to hospitals and blood centers, while Terumo BCT provides apheresis, collection and processing systems. Sanofi participates in hematology through its treatments for patients with bleeding disorders. Vitalant operates blood donation and transfusion services in the United States, and HemaCare supplies human-derived blood components for research use. The eleven companies profiled below span collection, fractionation and technology. However, every supplier remains exposed to swings in donor availability and plasma costs.
Companies profiled and their roles in this market
| Company | Type | Role in the market |
|---|---|---|
| Grifols | Fractionator | Immunoglobulins, albumin and clotting factors with a large U.S. plasma network |
| CSL Behring | Fractionator | Immunoglobulins, albumin and specialty plasma proteins |
| Octapharma | Fractionator | Immunoglobulins, fibrinogen concentrate and coagulation products |
| Takeda Pharmaceutical Company | Fractionator | Gammagard Liquid and other plasma-derived therapies |
| Kedrion Biopharma | Fractionator | Qivigy immunoglobulin and plasma proteins for rare diseases |
| Biotest AG | Fractionator | Yimmugo immunoglobulin, part of the Grifols group |
| Fresenius Kabi | Technology and therapies | Transfusion technology and hospital infusion therapies |
| Terumo BCT | Technology | Plasma collection, apheresis and whole blood processing systems |
| Sanofi | Therapies | Hematology treatments for bleeding disorders |
| Vitalant | Blood services | Blood donation and transfusion services in the United States |
| HemaCare | Research supply | Human-derived blood components for research use |
Plasma supply, not demand, sets the pace of growth
Credence Research's view is that plasma supply, not clinical demand, will set the pace of growth through 2035. The overall market grows at 5.09% a year, supported by rising immunoglobulin use and steady surgical demand. The strongest opportunities sit in immunoglobulins for nerve disorders, specialized concentrates and contract fractionation for countries that want domestic supply. Companies that control donor networks and raise yield per liter will hold an advantage, while those that rely on purchased plasma face tighter margins.
How Credence Research sized transfusion and plasma spending
The report uses 2025 as the base year and 2026 to 2035 as the forecast period. Market values come from the Credence Research model, which builds spending by product category, application and end user. Regional and segment splits are Credence Research estimates informed by World Health Organization statistics, regulator decisions and company press releases. No primary interviews or surveys were used in preparing this edition of the report.
Transfusion and plasma therapy outlook to 2035
By 2035, the blood products market is projected to reach USD 64.95 billion, with growth led by immunoglobulins and by new demand in Asia Pacific. Transfusion components will keep a steady role in surgery, trauma and cancer care, although patient blood management limits growth in high-income countries. New plasma collection and purification tools should lift yield per donation over the decade. North America keeps the highest value per patient, while Asia Pacific adds the most new users. As a result, advantage will depend on donor access, plant capacity and regulatory approvals.
Frequently Asked Questions
How big is the global blood products market?
Which product category leads the blood products market?
Which region leads blood products spending?
Which application accounts for the most spending?
How many blood donations are collected worldwide?
Which immunoglobulin approvals have shaped the market since 2024?
Who are the leading blood products companies?
What restrains growth in blood products?
Table of Content
Chapter 1 Market Segmentation
- 1.1 Segmentation Framework
- 1.1.1 Product and Service Classification
- 1.1.2 Application and End-Use Classification
- 1.1.3 Technology and Solution Classification
- 1.1.4 Customer and Distribution Channel Classification
- 1.1.5 Geographic Segmentation
- 1.1.6 Market Segment Definitions and Boundaries
- 1.2 By Product Category
- 1.2.1 Plasma-derived Products
- 1.2.2 Blood Components
- 1.2.3 Whole Blood
- 1.3 By Application
- 1.3.1 Immunology
- 1.3.2 Hematology
- 1.3.3 Neurology
- 1.3.4 Oncology
- 1.3.5 Others
- 1.4 By End User
- 1.4.1 Hospitals
- 1.4.2 Blood Banks
- 1.4.3 Ambulatory Surgical Centers
- 1.4.4 Others
Chapter 2 Introduction
- 2.1 Report Objectives and Scope
- 2.2 Product Definition and Industry Terminology
- 2.3 Market Inclusions and Exclusions
- 2.4 Research Process
- 2.4.1 Primary Research and Expert Interviews
- 2.4.2 Secondary Research and Source Review
- 2.4.3 Top-Down and Bottom-Up Estimation
- 2.4.4 Data Triangulation and Verification
- 2.5 Market Size Measurement Basis
- 2.5.1 2025: USD 39.53 billion → 2035: USD 64.95 billion
- 2.6 Historical and Forecast Reference Periods
- 2.6.1 Historical Period: 2018-2025
- 2.6.2 Base Year: 2025
- 2.6.3 Forecast Period: 2025-2035
- 2.7 Research Assumptions and Limitations
Chapter 3 Executive Summary
- 3.1 Market Snapshot and Key Findings
- 3.2 Base-Year Market Size, 2025
- 3.3 Forecast Market Size, 2035
- 3.4 Revenue and Volume Growth Outlook
- 3.5 Key Demand and Supply Indicators
- 3.6 Leading Market Segments
- 3.7 Fastest-Growing Market Opportunities
- 3.8 Regional Performance Highlights
- 3.9 Technology and Industry Transformation
- 3.10 Competitive Landscape Summary
- 3.11 Analyst View and Strategic Implications
Chapter 4 Global Blood Products Market Trends and Developments
- 4.1 Historical Industry Development, 2018-2025
- 4.2 Recent Market Trends and Developments
- 4.3 Demand and Customer Behavior Trends
- 4.4 Technology and Product Innovation
- 4.5 Artificial Intelligence, Automation and Digitalization
- 4.6 Local Manufacturing and Supply Chain Realignment
- 4.7 Industry Partnerships, Mergers and Acquisitions
- 4.8 Sustainability and Circular Economy Developments
- 4.9 Government and Private Sector Investment Trends
- 4.10 Emerging Business Models and Commercialization
- 4.11 Industry Developments and Announcements
Chapter 5 Global Blood Products Market Production, Supply and Demand Analysis
- 5.1 Demand Trend and Consumption Analysis, 2018-2025
- 5.2 Demand Forecast, 2025-2035
- 5.3 Production and Output Trend, 2018-2025
- 5.4 Production and Output Forecast, 2025-2035
- 5.5 Installed Capacity and Capacity Utilization
- 5.6 Company-Wise Production Plants and Statistics
- 5.6.1 Installed Production Capacity
- 5.6.2 Actual Production
- 5.6.3 Planned Capacity and Expansion Targets
- 5.7 Supply Chain Structure and Procurement Trends
- 5.8 Supply-Demand Gap and Bottlenecks
- 5.9 Import Dependence and Sourcing Structure
- 5.10 Contract Manufacturing and Outsourcing
- 5.11 Regional Supply and Demand Concentration
Chapter 6 Global Blood Products Market Pricing Analysis
- 6.1 Pricing Structure and Measurement
- 6.2 Historical Pricing Trends, 2018-2025
- 6.3 Pricing Outlook, 2025-2035
- 6.4 Average Selling Price and Unit Economics
- 6.5 Pricing by Product and Market Segment
- 6.6 Geographic Pricing Differences
- 6.7 Key Input, Energy, Labor and Logistics Costs
- 6.8 Contract Pricing and Purchasing Models
- 6.9 Pricing Sensitivity and Competitive Positioning
- 6.10 Price, Margin and Profitability Implications
Chapter 7 Global Blood Products Market Dynamics
- 7.1 Market Growth Drivers
- 7.1.1 Demand-Side Drivers
- 7.1.2 Technology and Innovation Drivers
- 7.1.3 Infrastructure and Investment Drivers
- 7.1.4 Regulatory and Policy Drivers
- 7.2 Market Restraints
- 7.2.1 Cost and Affordability Constraints
- 7.2.2 Technology and Adoption Barriers
- 7.2.3 Supply Chain and Operational Constraints
- 7.3 Market Challenges
- 7.3.1 Competitive Pressure and Margin Erosion
- 7.3.2 Skills, Infrastructure and Implementation Gaps
- 7.4 Emerging Market Opportunities
- 7.5 Market Dynamics Impact and Time-Horizon Assessment
Chapter 8 Global Blood Products Value Chain Analysis
- 8.1 Industry Value Chain Overview
- 8.2 Upstream Suppliers and Critical Inputs
- 8.3 Technology and Component Providers
- 8.4 Manufacturing or Service Delivery
- 8.5 Distribution, Channel Partners and Integrators
- 8.6 Downstream Applications and End Users
- 8.7 Value Addition and Profit Pools
- 8.8 Vertical Integration and Outsourcing
- 8.9 Supplier Concentration and Risk
- 8.10 Supply Chain Localization and Resilience
Chapter 9 Global Blood Products Market Regulations and Policies
- 9.1 Relevant Laws, Standards and Compliance Frameworks
- 9.2 Product, Service, Safety and Quality Requirements
- 9.3 Government Policies, Incentives and Subsidies
- 9.4 Imports, Exports and Trade Barriers
- 9.5 Public Procurement and Local Content Requirements
- 9.6 Environmental and Sustainability Compliance
- 9.7 Upcoming Policy Changes and Market Implications
Chapter 10 Global Blood Products Market Hotspots and Opportunities
- 10.1 Market Opportunity Mapping and Growth Hotspots
- 10.2 High-Growth Applications and Customer Groups
- 10.3 Underserved Markets and White-Space Opportunities
- 10.4 Emerging Technology and Product Opportunities
- 10.5 New Capacity and Investment Hotspots
- 10.6 Market Entry and Expansion Opportunities
- 10.7 Distribution and Partnership Opportunities
- 10.8 Near-Term and Long-Term Commercial Potential
- 10.9 Opportunity Attractiveness and Execution Risks
Chapter 11 Global Blood Products Market Outlook, 2025-2035
- 11.1 Market Size and Analysis
- 11.1.1 Revenue (Market Measurement: 2025: USD 39.53 billion → 2035: USD 64.95 billion)
- 11.1.2 Market Volume and Quantity Sold
- 11.1.3 Historical Market Size, 2018-2025
- 11.1.4 Base-Year Market Size, 2025
- 11.2 Market Forecast, 2025-2035
- 11.2.1 Revenue Forecast to 2035
- 11.2.2 Volume Forecast to 2035
- 11.2.3 CAGR and Year-on-Year Growth
- 11.2.4 Incremental Revenue Opportunity
- 11.3 Forecast Assumptions and Scenario Analysis
- 11.3.1 Base-Case Forecast
- 11.3.2 Optimistic and Conservative Scenarios
- 11.3.3 Technology, Pricing and Policy Sensitivities
- 11.4 Market Attractiveness and Growth Outlook
Chapter 12 Global Blood Products Market Segmentation and Outlook
- 12.1 Segmentation Summary and Market Shares, 2025
- 12.2 Largest and Fastest-Growing Segments
- 12.3 By Product Category - Market Size and Forecast, 2025-2035
- 12.3.1 Segment Definition and Scope
- 12.3.2 Historical Market Size, 2018-2025
- 12.3.3 Revenue Forecast, 2025-2035
- 12.3.4 Volume Forecast, 2025-2035
- 12.3.5 Base-Year Market Share, 2025
- 12.3.6 Segment CAGR and Growth Drivers
- 12.3.7 Subsegment Market Size and Forecast
- 12.3.7.1 Plasma-derived Products
- 12.3.7.2 Blood Components
- 12.3.7.3 Whole Blood
- 12.3.8 Subsegment Pricing and Adoption Trends
- 12.3.9 Leading Suppliers and Competition
- 12.3.10 Regional Demand and Opportunities
- 12.4 By Application - Market Size and Forecast, 2025-2035
- 12.4.1 Segment Definition and Scope
- 12.4.2 Historical Market Size, 2018-2025
- 12.4.3 Revenue Forecast, 2025-2035
- 12.4.4 Volume Forecast, 2025-2035
- 12.4.5 Base-Year Market Share, 2025
- 12.4.6 Segment CAGR and Growth Drivers
- 12.4.7 Subsegment Market Size and Forecast
- 12.4.7.1 Immunology
- 12.4.7.2 Hematology
- 12.4.7.3 Neurology
- 12.4.7.4 Oncology
- 12.4.7.5 Others
- 12.4.8 Subsegment Pricing and Adoption Trends
- 12.4.9 Leading Suppliers and Competition
- 12.4.10 Regional Demand and Opportunities
- 12.5 By End User - Market Size and Forecast, 2025-2035
- 12.5.1 Segment Definition and Scope
- 12.5.2 Historical Market Size, 2018-2025
- 12.5.3 Revenue Forecast, 2025-2035
- 12.5.4 Volume Forecast, 2025-2035
- 12.5.5 Base-Year Market Share, 2025
- 12.5.6 Segment CAGR and Growth Drivers
- 12.5.7 Subsegment Market Size and Forecast
- 12.5.7.1 Hospitals
- 12.5.7.2 Blood Banks
- 12.5.7.3 Ambulatory Surgical Centers
- 12.5.7.4 Others
- 12.5.8 Subsegment Pricing and Adoption Trends
- 12.5.9 Leading Suppliers and Competition
- 12.5.10 Regional Demand and Opportunities
- 12.6 Segment Growth Comparison
- 12.7 Segment Attractiveness and Priority Matrix
Chapter 13 Global Blood Products End-Use and Application Market Outlook
- 13.1 End-Use Industry and Customer Demand Structure
- 13.2 Leading Applications and Customer Groups
- 13.3 End-Use Market Size, Share and Forecast
- 13.4 Major End-Use Industry Deep Dives
- 13.4.1 Customer Requirements and Use Cases
- 13.4.2 Demand and Replacement Cycles
- 13.4.3 Technical and Regulatory Considerations
- 13.4.4 Purchasing and Procurement Models
- 13.4.5 Leading Vendors and Distribution Channels
- 13.4.6 Forecast and Commercial Opportunities
- 13.5 Emerging Applications and Cross-Segment Demand
- 13.6 End-Use Industry Investment Priorities
Chapter 14 Global Blood Products Geographic Market Outlook, 2025-2035
- 14.1 Regional Market Size and Share, 2025
- 14.2 Regional Market Forecast, 2025-2035
- 14.3 Regional Pricing, Production and Demand Differences
- 14.4 North America
- 14.4.1 United States
- 14.4.2 Canada
- 14.4.3 Mexico
- 14.5 Europe
- 14.5.1 Germany
- 14.5.2 France
- 14.5.3 Italy
- 14.5.4 United Kingdom
- 14.5.5 Spain
- 14.5.6 Poland
- 14.5.7 Russia
- 14.5.8 Netherlands
- 14.5.9 Belgium
- 14.5.10 Sweden
- 14.5.11 Denmark
- 14.5.12 Norway
- 14.5.13 Rest of Europe
- 14.6 Asia Pacific
- 14.6.1 China
- 14.6.2 India
- 14.6.3 Japan
- 14.6.4 South Korea
- 14.6.5 Thailand
- 14.6.6 Indonesia
- 14.6.7 Vietnam
- 14.6.8 Malaysia
- 14.6.9 Australia
- 14.6.10 Rest of Asia Pacific
- 14.7 Latin America
- 14.7.1 Brazil
- 14.7.2 Argentina
- 14.7.3 Colombia
- 14.7.4 Chile
- 14.7.5 Rest of Latin America
- 14.8 Middle East
- 14.8.1 Saudi Arabia
- 14.8.2 United Arab Emirates
- 14.8.3 Turkey
- 14.8.4 Israel
- 14.8.5 Iran
- 14.8.6 Rest of the Middle East
- 14.9 Africa
- 14.9.1 South Africa
- 14.9.2 Egypt
- 14.9.3 Nigeria
- 14.9.4 Morocco
- 14.9.5 Rest of Africa
- 14.10 Regional Investment, Policy and Supply Chain Differences
- 14.11 Regional Competitive Landscape
- 14.12 Geographic Growth Hotspots
Chapter 15 Global Blood Products Technology, Innovation and Sustainability Outlook
- 15.1 Technology Landscape and Maturity
- 15.2 Product, Process and Service Innovation
- 15.3 AI, Automation and Digital Tools in the Industry
- 15.4 Technology Adoption and Performance Benchmarking
- 15.5 Innovation Pipeline and R&D Investment
- 15.6 Patent and Intellectual Property Trends
- 15.7 Energy Efficiency and Resource Management
- 15.8 Sustainability, Recycling and Circularity
- 15.9 Technology Roadmap, 2025-2035
- 15.10 Risks of Obsolescence and Technology Substitution
Chapter 16 Global Blood Products Market Key Strategic Imperatives
- 16.1 Growth and Market Entry Priorities
- 16.2 High-Return Products and Segments
- 16.3 Pricing, Profitability and Cost Optimization
- 16.4 Technology Investment and Product Differentiation
- 16.5 Supply Chain Localization and Resilience
- 16.6 Distribution and Customer Acquisition
- 16.7 Partnership, Acquisition and Capacity Strategy
- 16.8 Regional Expansion Priorities
- 16.9 Short-, Medium- and Long-Term Actions
Chapter 17 Competition Outlook
- 17.1 Industry Competition Characteristics
- 17.2 Market Structure and Concentration
- 17.3 Market Share and Competitive Positioning, 2025
- 17.4 Company-Wise Revenue and Product Benchmarking
- 17.5 Production and Service Capacity Benchmarking
- 17.6 Technology, Pricing and Differentiation
- 17.7 Regional Footprint and Distribution Strength
- 17.8 Mergers, Acquisitions and Strategic Alliances
- 17.9 New Entrants and Competitive Threats
- 17.10 Porter's Five Forces and Industry Attractiveness
- 17.11 Competitive Outlook, 2025-2035
Chapter 18 Company Profiles
- 18.1 Company Coverage and Selection Criteria
- 18.2 Grifols
- 18.2.1 Business Description
- 18.2.2 Company Ownership and Geographic Presence
- 18.2.3 Product and Service Portfolio
- 18.2.4 Manufacturing and Operating Footprint
- 18.2.5 Production Capacity and Expansion Plans
- 18.2.6 Financial Performance and Investment
- 18.2.7 Market Share and Competitive Position
- 18.2.8 Technology and Innovation Capabilities
- 18.2.9 Strategic Alliances or Partnerships
- 18.2.10 Recent Developments
- 18.2.11 Growth Strategy and Outlook
- 18.3 CSL Behring
- 18.4 Fresenius Kabi
- 18.5 Octapharma
- 18.6 Takeda Pharmaceutical Company
- 18.7 Sanofi
- 18.8 Kedrion Biopharma
- 18.9 Biotest AG
- 18.10 HemaCare
- 18.11 Terumo BCT
- 18.12 Vitalant
- 18.13 Other Relevant Market Participants
Note: Every listed company is profiled on the structure shown under the first company. The company list is preliminary and may change based on research findings, market developments, data availability and client requirements.
Chapter 19 Disclaimer
- 19.1 Research and Forecast Disclaimer
- 19.2 Data Source and Estimation Limitations
Note: The depth of individual sections depends on data availability for this market. Volume, capacity, trade and other unit-based metrics are included where applicable.

