Tumor sampling shifts from tissue alone to blood tests
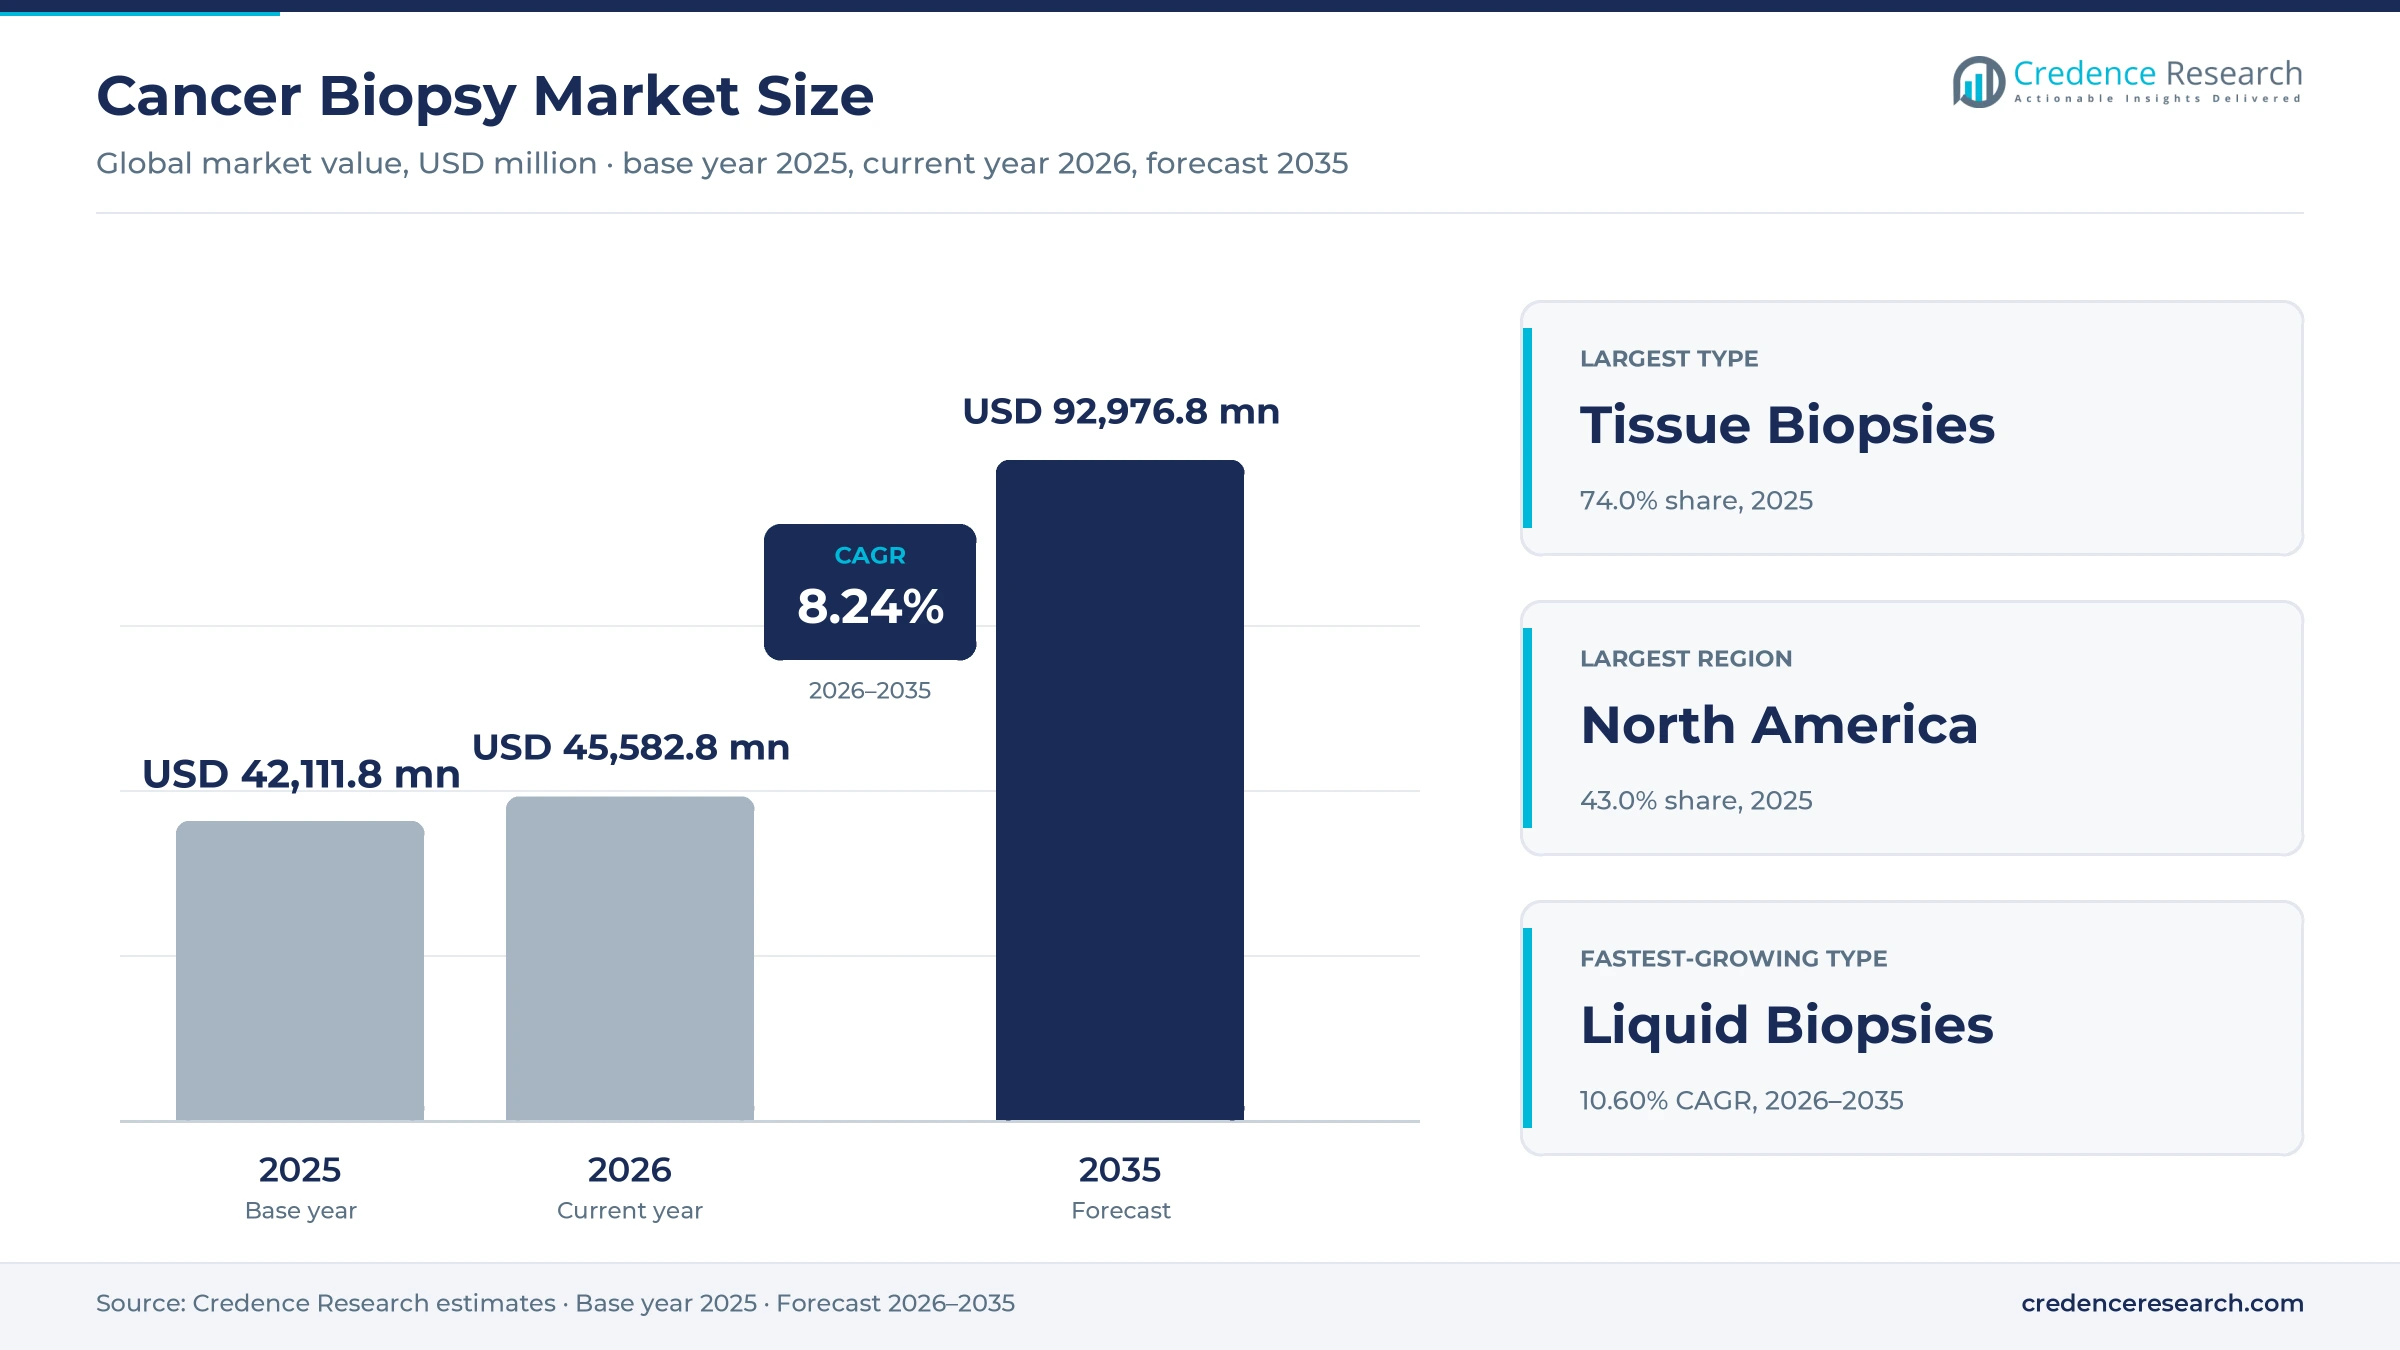
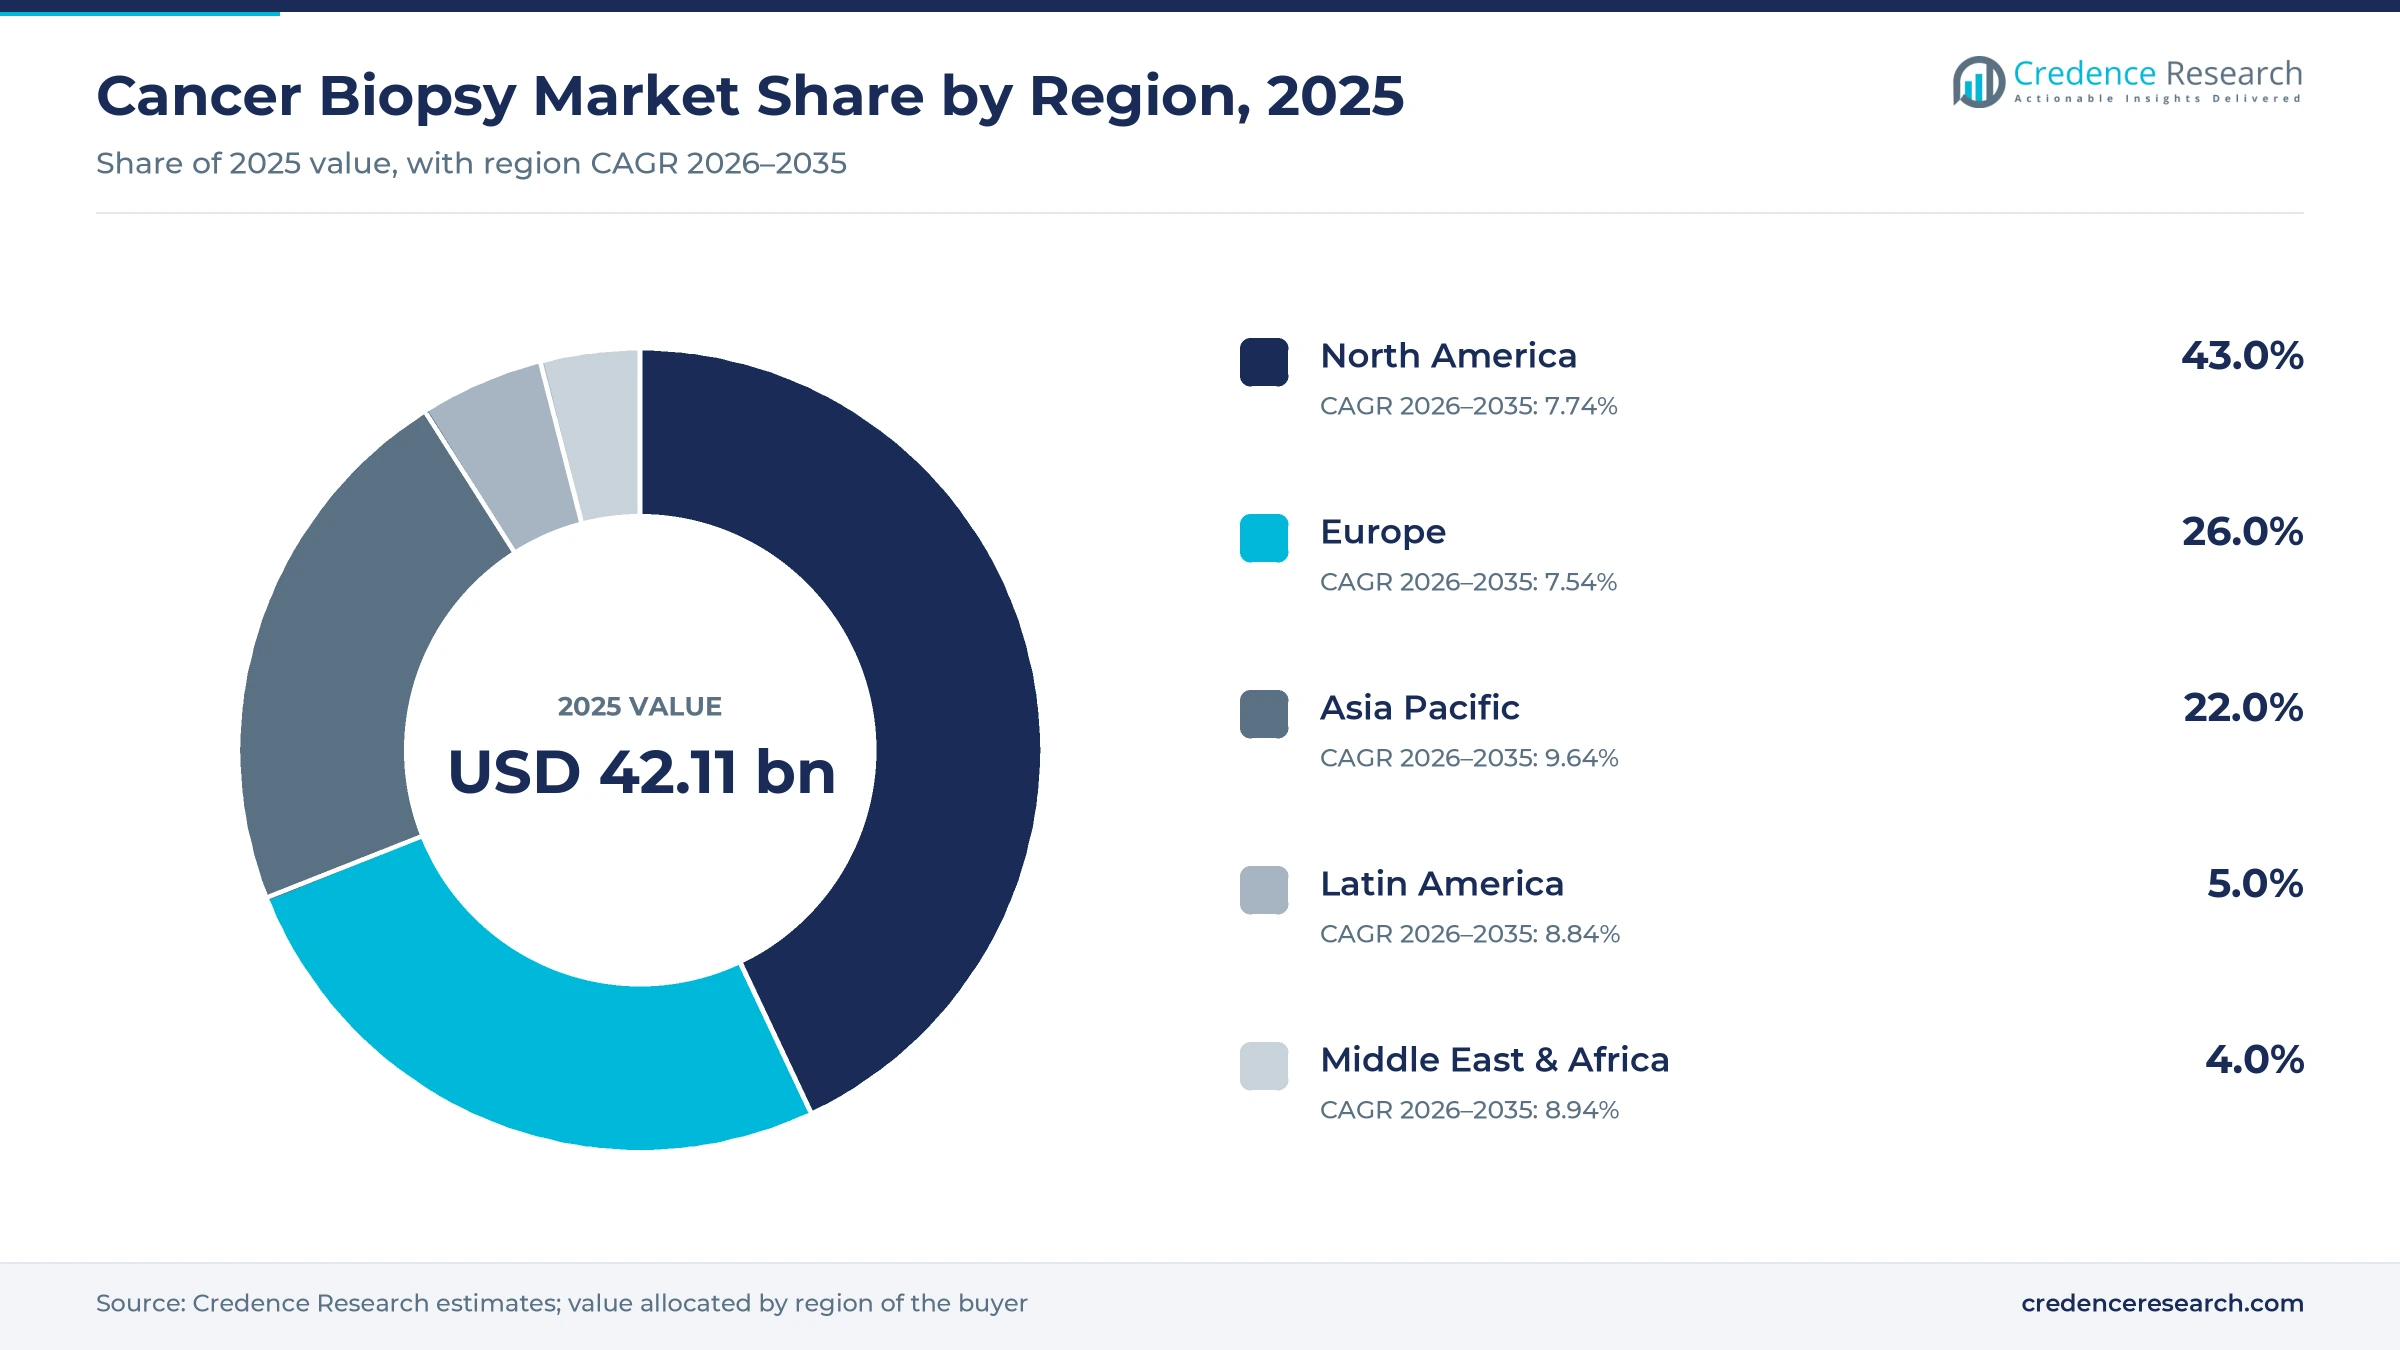
The global cancer biopsy market was valued at USD 42.11 billion in 2025 and is projected to increase from USD 45.58 billion in 2026 to USD 92.98 billion by 2035, registering a CAGR of 8.24% during 2026–2035. Demand comes from rising numbers of new cancer diagnoses, wider use of targeted drugs that need a confirmed biomarker and the arrival of blood tests for screening and therapy selection. North America held the largest regional share, 43.0% in 2025, because the United States pays for comprehensive genomic profiling and runs large screening programs. Asia Pacific is the fastest-growing region at 9.64% a year, as China, Japan and India expand oncology centers and molecular laboratories. The commercial picture shifted in July 2024, when U.S. regulators approved the first blood test as a primary colorectal screening option. As a result, blood-based testing now adds new volume alongside tissue sampling.
Which procedures, tests and services does this analysis cover?
The analysis counts tissue sampling procedures such as needle, core and surgical sampling, together with blood-based tests that detect circulating tumor DNA or tumor cells. It also counts the instruments, kits, consumables and laboratory services used to collect, process and analyze those samples. Hospitals, diagnostic centers and research institutes buy these products directly or order tests from reference laboratories.
Imaging scans, cancer drugs and general pathology staffing sit outside the value counted here, although they shape demand. The value chain runs from device and reagent makers through sampling procedures and laboratory analysis to the oncologists who use results for diagnosis, therapy selection and monitoring.
Cancer Biopsy Market Insights
- The cancer biopsy market grows from USD 42.11 billion in 2025 to USD 92.98 billion by 2035, an 8.24% CAGR driven by case growth and molecular testing.
- North America held 43.0% of global value in 2025, supported by comprehensive genomic profiling coverage and large screening programs.
- Tissue sampling led types with 74.0% of 2025 value, while blood-based tests grow fastest at 10.60% a year through 2035.
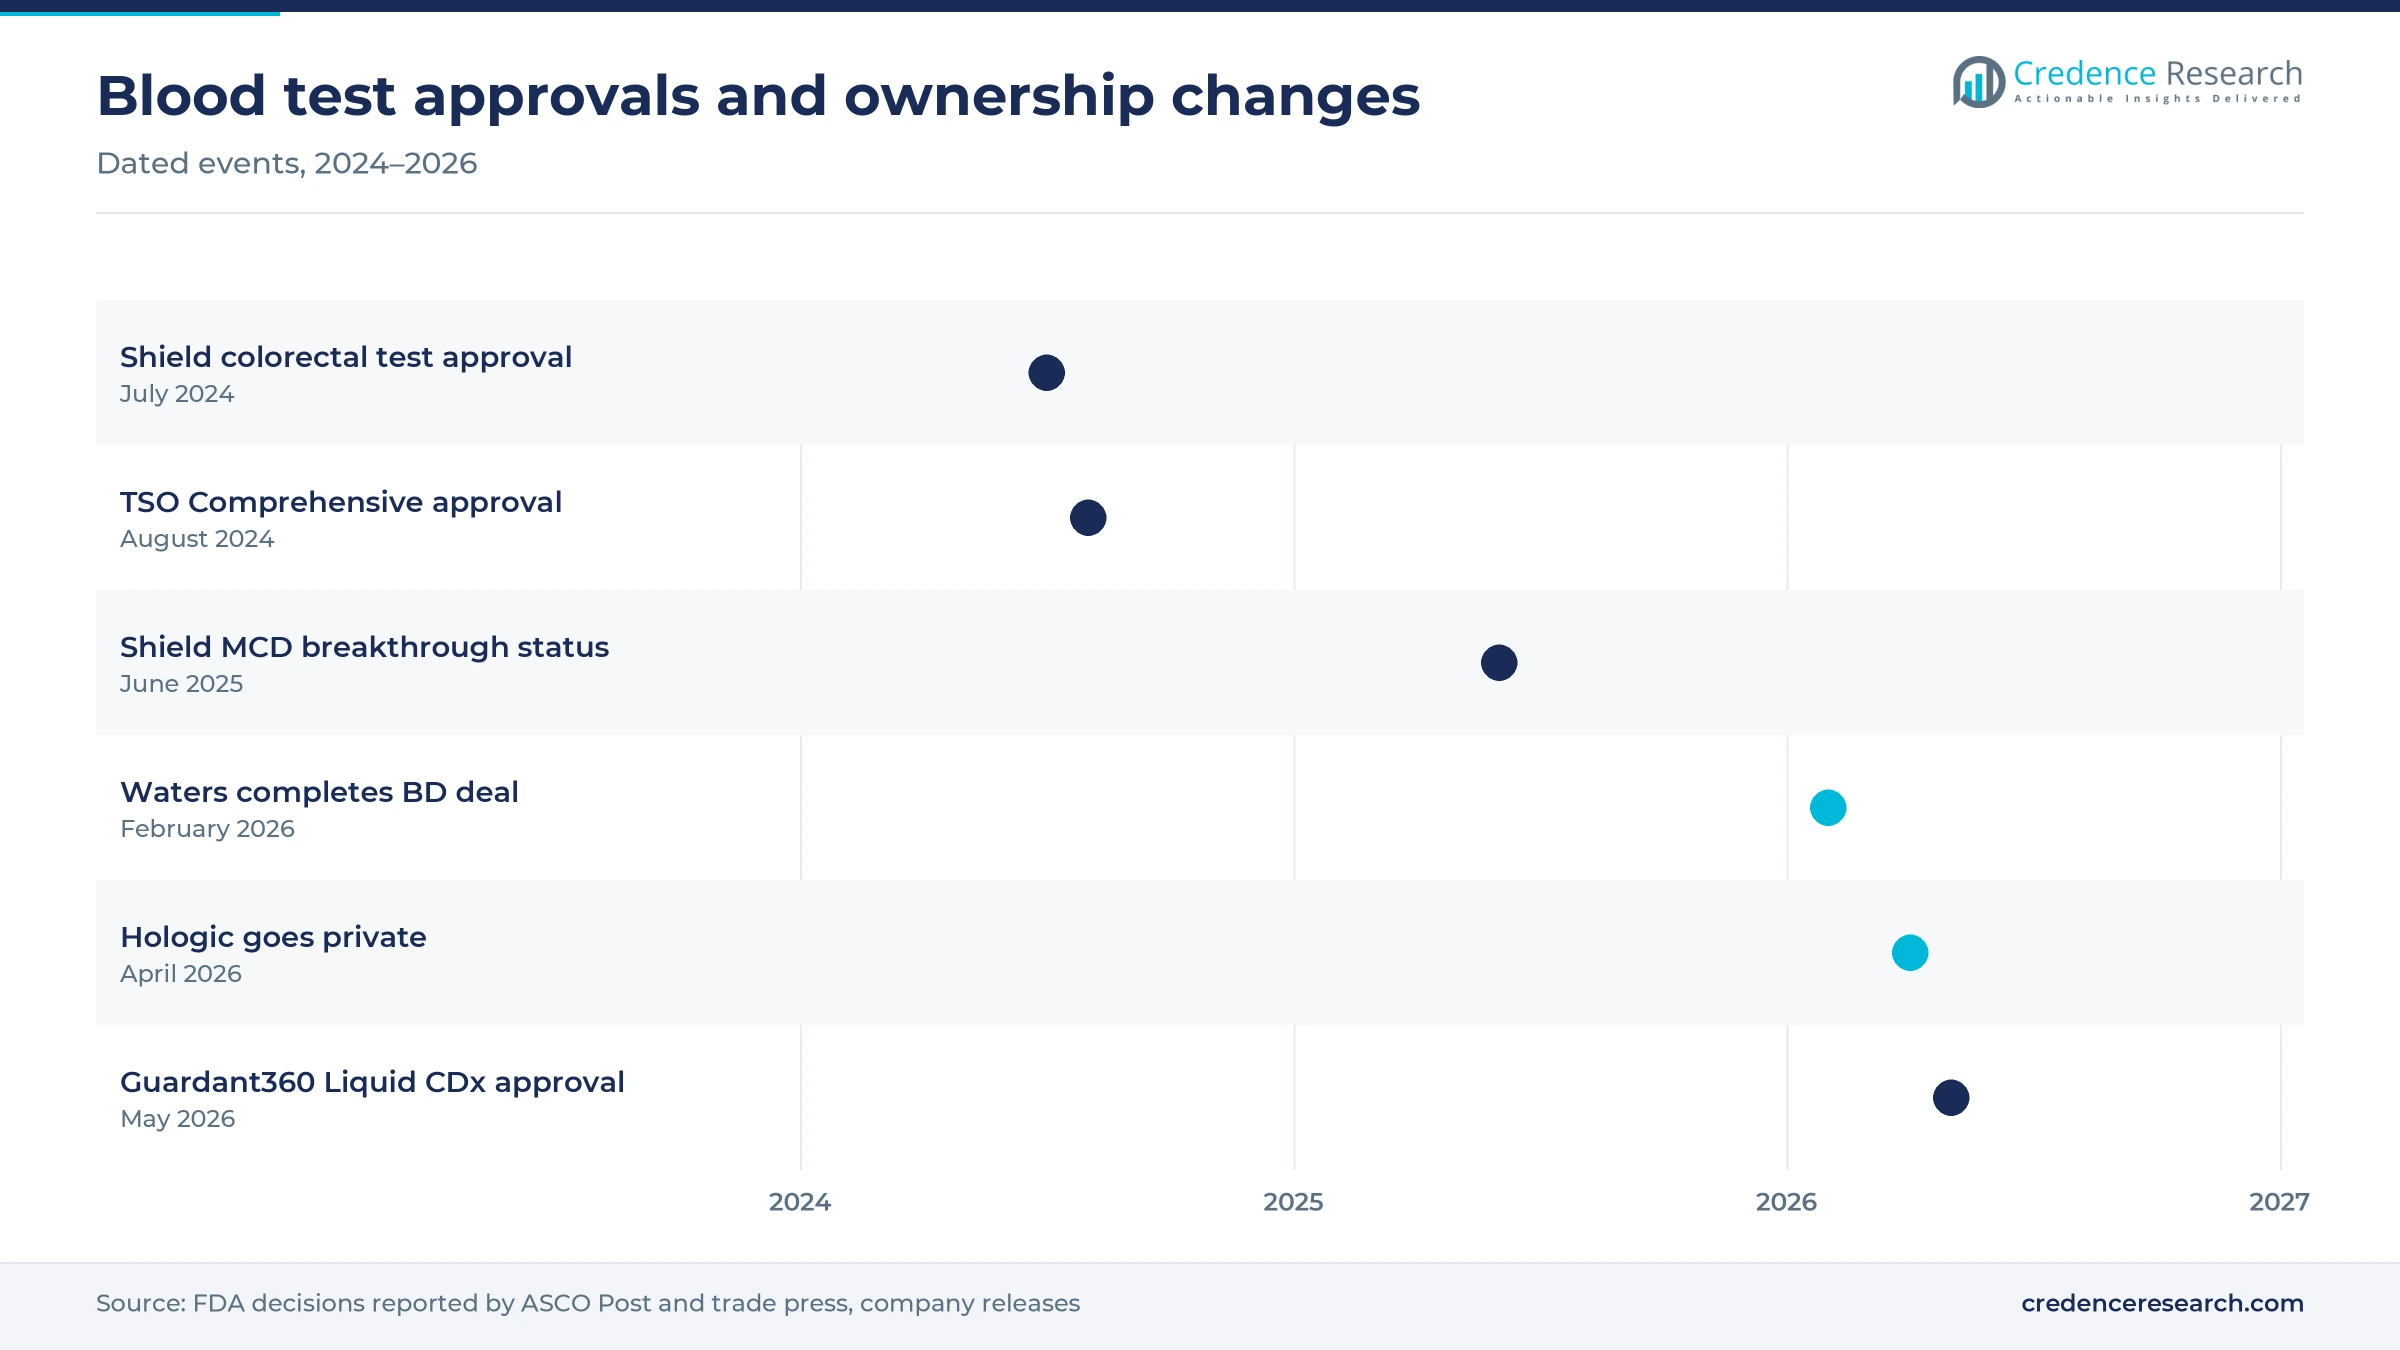
- In May 2026, the FDA approved Guardant360 Liquid CDx, which assesses a footprint 100 times wider than the earlier Guardant360 CDx panel.
- Blackstone and TPG completed the take-private acquisition of Hologic in April 2026, which shifts a major screening supplier into private ownership.
Tissue sampling leads as liquid tests grow fastest
Why do kits and consumables account for most spending?
Based on product, the market is categorized into instrument, kits, consumables and services. Kits led with a 30.0% share of 2025 value, because every test needs extraction, library preparation or staining reagents. Services grow fastest at 9.13% a year, as hospitals send complex genomic tests to central laboratories rather than run them in house. Instruments hold a smaller share, because laboratories replace sequencers and processors only every several years.
Will blood tests replace tissue sampling?
Based on type, the market is categorized into tissue biopsies and liquid biopsies. Tissue Biopsies led with a 74.0% share of 2025 value, because a tissue sample is still required to confirm most diagnoses and grade tumors. Liquid Biopsies grow fastest at 10.60% a year, as regulators approve blood tests for screening and therapy selection. These tests add volume when tissue is scarce or when patients need repeated monitoring.
Which tumor types account for the most testing?
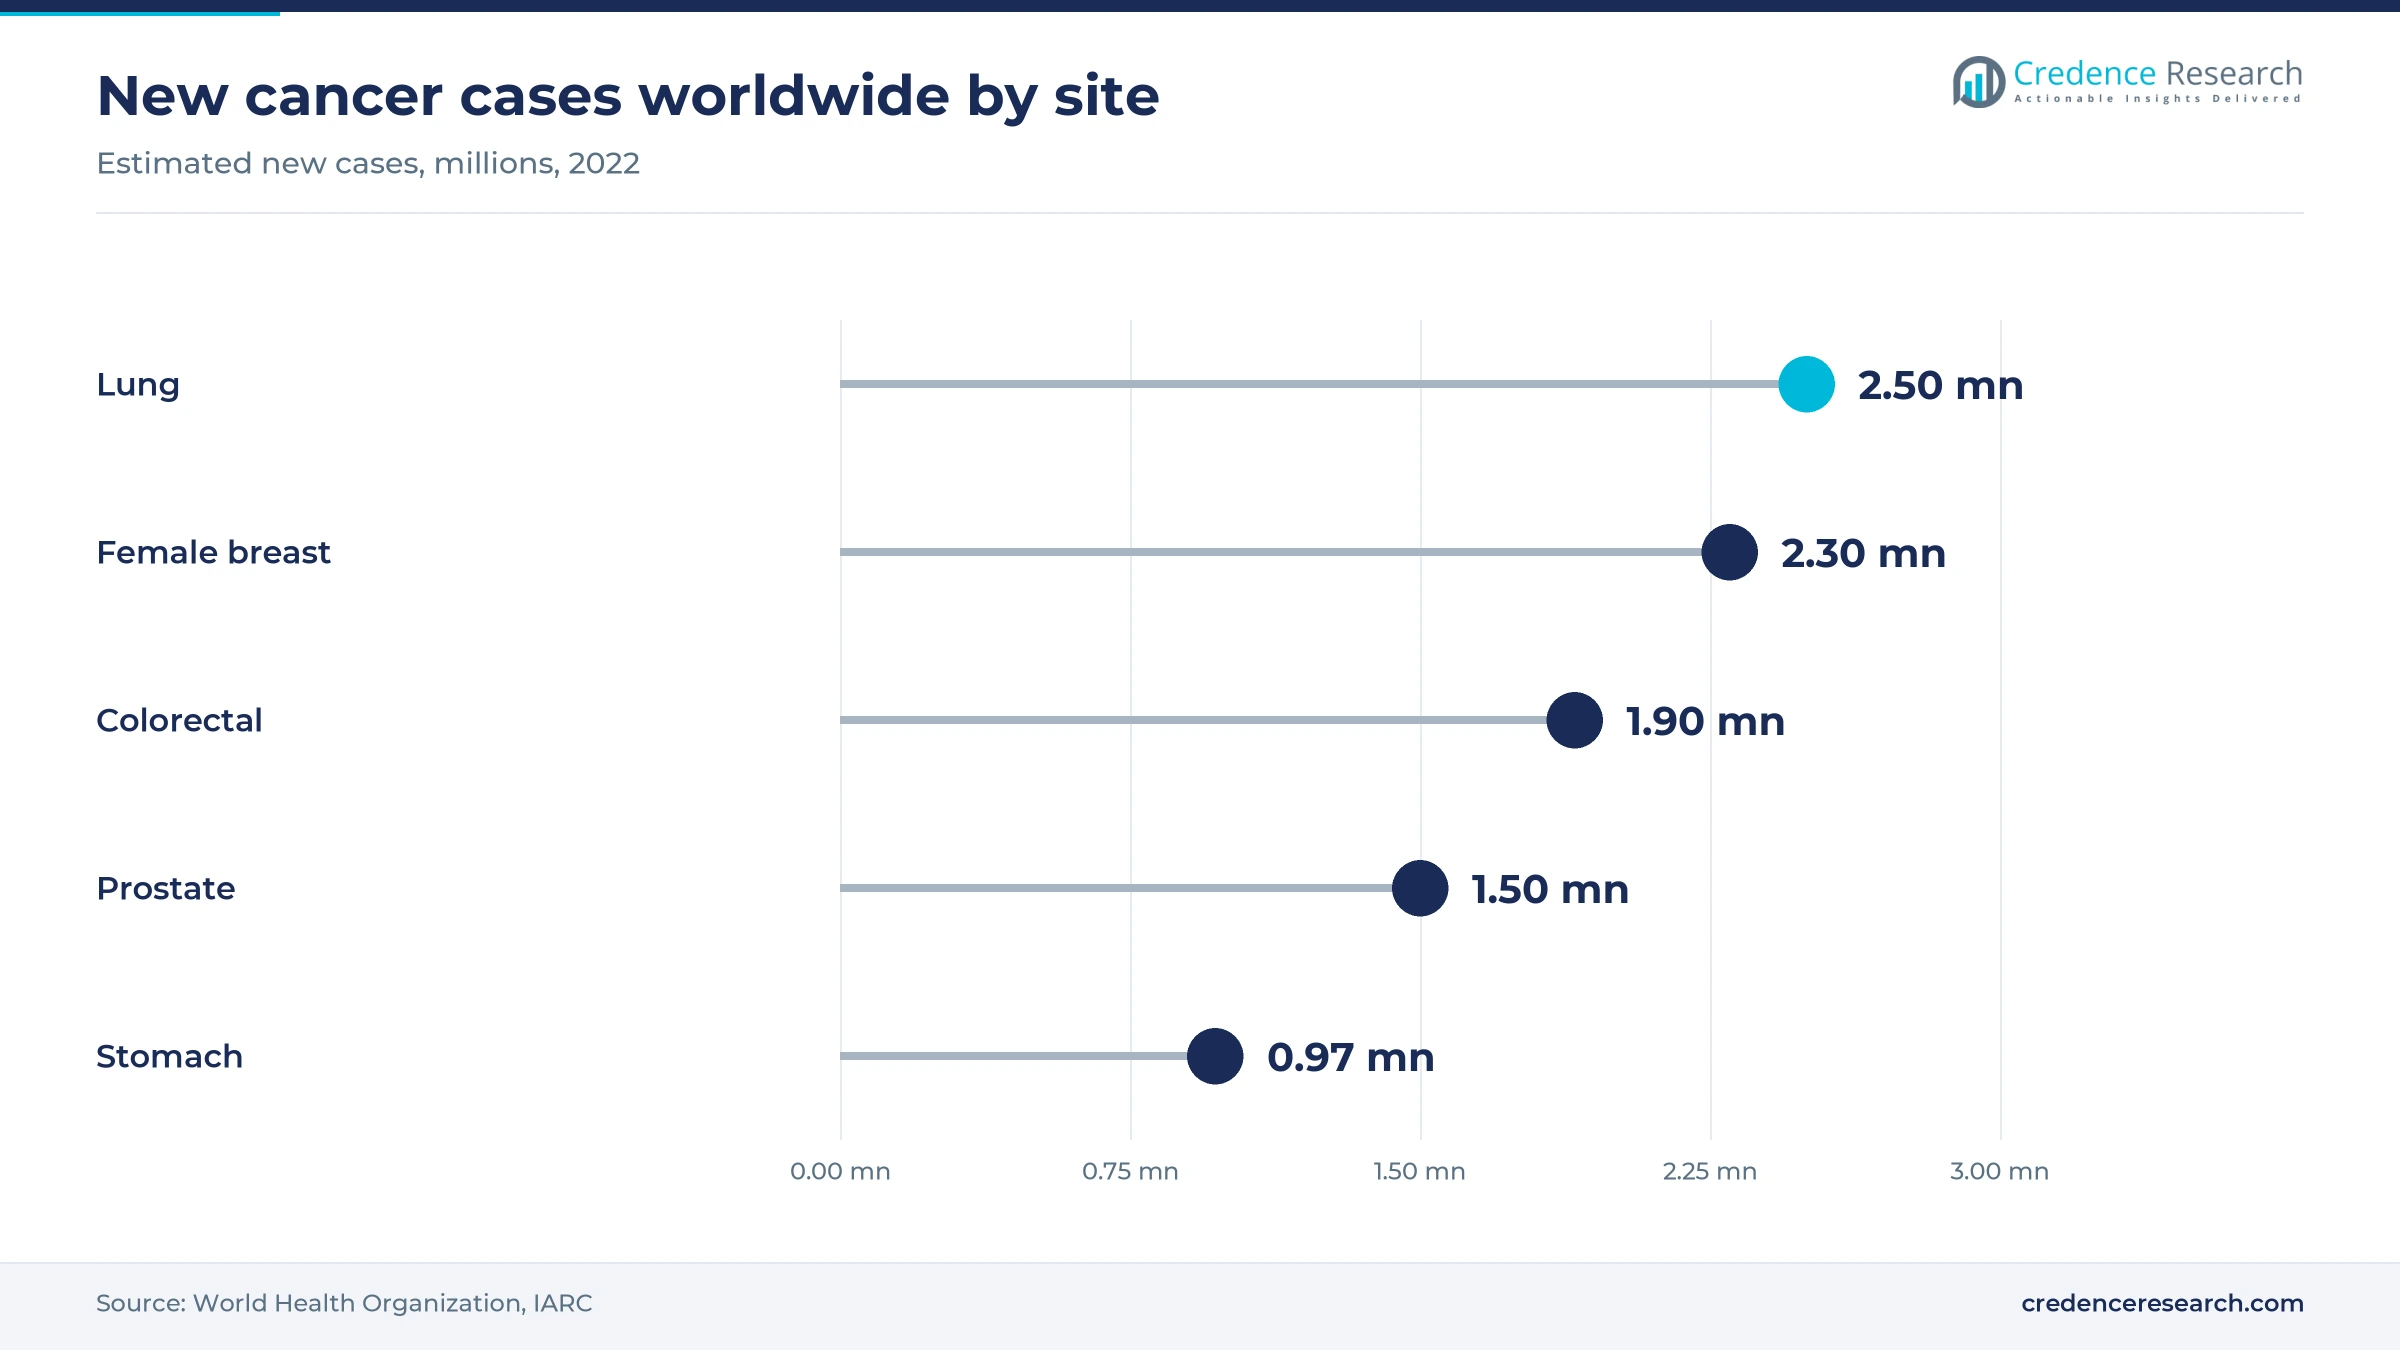
Based on application, the market is categorized into lung, breast, colorectal, prostate and other cancers, including stomach, liver, esophagus, cervical, kidney and bladder tumors. Lung cancer led with a 27.0% share of 2025 value, because targeted drugs for lung tumors require testing for many biomarkers. Colorectal cancer grows fastest at 9.15% a year, as blood-based screening reaches average-risk adults. Breast testing remains large, because imaging-guided sampling follows every suspicious mammogram. Stomach cancer, part of the others group, added about 970,000 new cases worldwide in 2022.
Where are samples collected and analyzed?
Based on end user, the market is categorized into hospitals, diagnostic centers and research institutes. Hospitals led with a 54.0% share of 2025 value, because most tissue sampling happens in operating rooms, endoscopy suites and imaging departments. Diagnostic Centers grow fastest at 8.92% a year, as blood draws and outsourced genomic testing move work to independent laboratories. Research institutes buy kits and instruments for trials and biomarker discovery.
| Segment Group | Leading Sub-segment | Share, 2025 | Fastest-growing Sub-segment | CAGR, 2026–2035 |
|---|---|---|---|---|
| By Product | Kits | 30.0% | Services | 9.13% |
| By Type | Tissue Biopsies | 74.0% | Liquid Biopsies | 10.60% |
| By Application | Lung | 27.0% | Colorectal | 9.15% |
| By End User | Hospitals | 54.0% | Diagnostic Centers | 8.92% |
Request a Free Sample
Fill in your details and we'll send you a free sample report.
- Sample data tables & charts
- Research methodology
Rising case numbers and targeted drugs lift testing
How does the global cancer burden sustain testing demand?
Case growth anchors demand, because nearly every new diagnosis requires at least one sampling procedure. The World Health Organization reported an estimated 20 million new cancer cases and 9.7 million deaths in 2022, and it projects new cases to rise 77% by 2050. Lung cancer led with 2.5 million new cases, followed by female breast cancer with 2.3 million and colorectal cancer with 1.9 million. Lung cancer accounted for 12.4% of new cases and 18.7% of cancer deaths in 2022. As a result, procedure volumes rise in every world region.
Why do targeted therapies multiply tests per patient?
Targeted therapies multiply testing, because each drug label names a biomarker that must be confirmed before treatment begins. In August 2024, the FDA approved Illumina's TruSight Oncology Comprehensive assay, the first distributable genomic profiling kit in the United States, with 2 companion diagnostic claims. This approval lets hospital laboratories run broad panels in house instead of sending samples away. In turn, each patient with advanced disease now generates several tests over the course of treatment.
How is blood-based screening adding new testing volume?
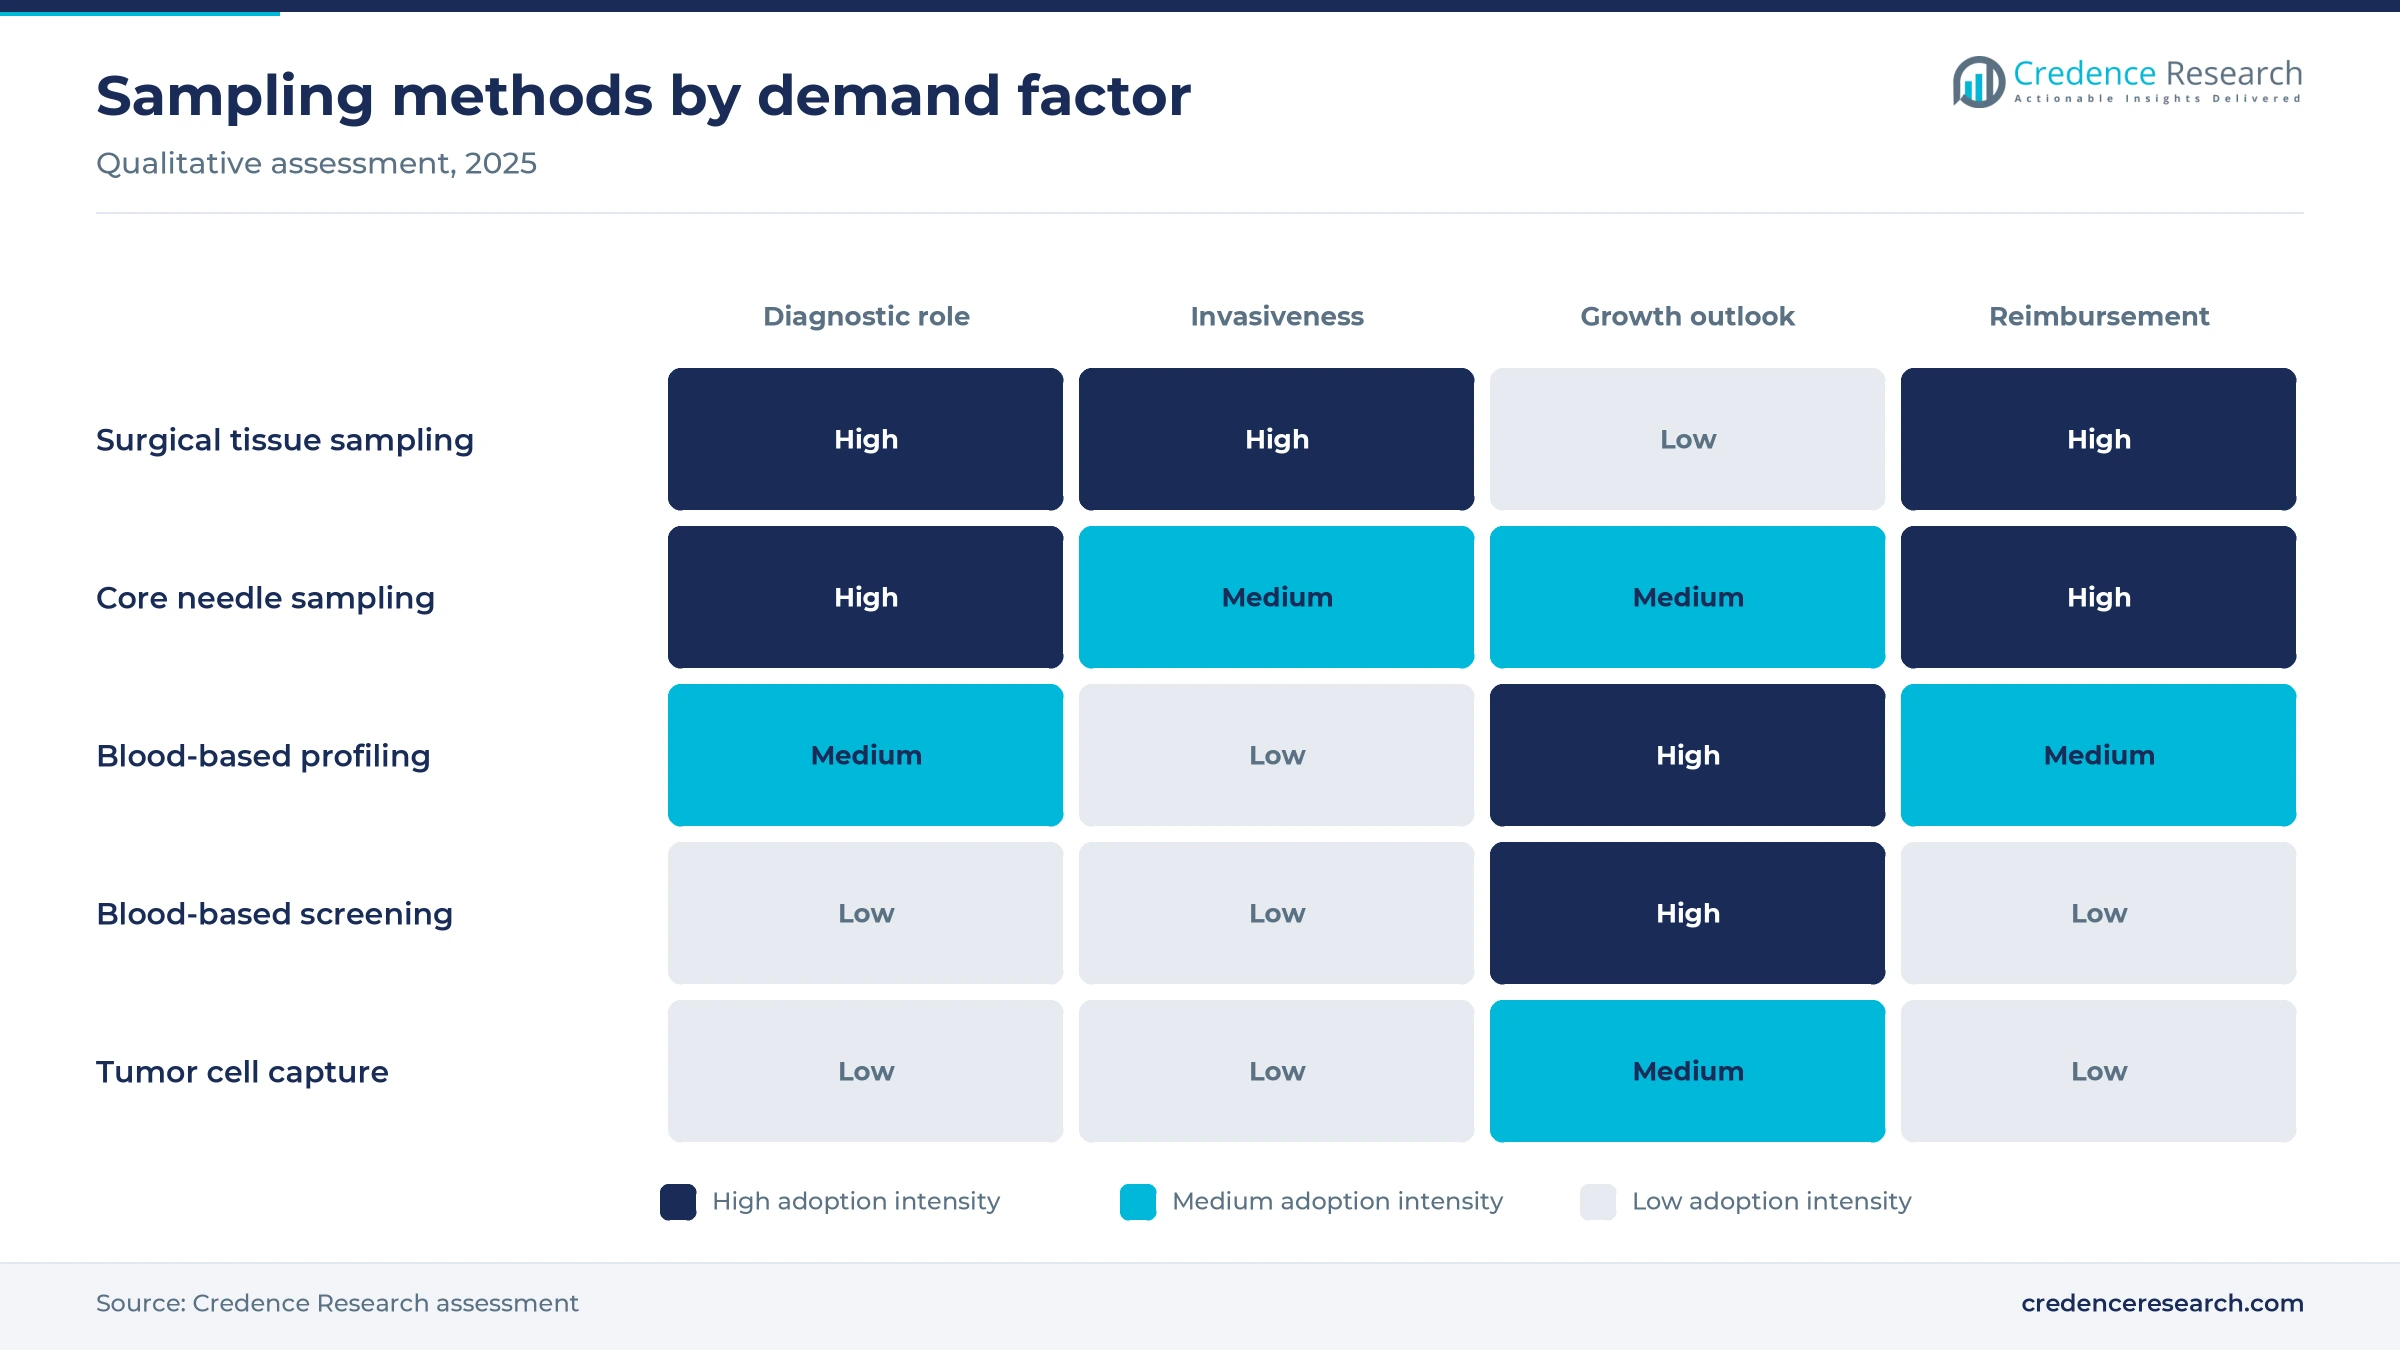
Blood-based screening adds a large new pool of patients, because many adults avoid colonoscopy or stool tests. In July 2024, the FDA approved Guardant Health's Shield blood test for colorectal screening in average-risk adults aged 45 years and older. It was the first blood test approved as a primary screening option for that cancer. As a result, screening programs can reach people who would otherwise skip testing, and positive results lead to follow-up procedures.
Why does an aging population raise procedure volumes?
Aging populations raise procedure volumes, because cancer incidence climbs steeply after age 60 in every region. Japan, Western Europe and North America already have large older populations, while China and much of Southeast Asia are aging quickly. Older patients also receive more follow-up sampling during treatment and surveillance, and the WHO counted 53.5 million people alive within five years of a diagnosis in 2022. In turn, hospitals and laboratories need more kits, consumables and pathology capacity each year through 2035.
Blood screening and broader genomic panels gain approval
How are larger blood-based panels changing therapy selection?
Larger blood-based panels are changing therapy selection, because they can profile tumors when tissue is scarce or hard to reach. In May 2026, Guardant Health announced FDA approval of Guardant360 Liquid CDx, which assesses a genomic footprint 100 times wider than the earlier Guardant360 CDx panel. The seven companion diagnostic indications of the older test moved to the new one. As a result, oncologists can order one blood test for both genomic and epigenomic insights.
Is multi-cancer detection moving toward regulatory review?
Multi-cancer detection is emerging as the next screening frontier, because one blood draw could flag several tumor types at once. In June 2025, Guardant Health announced that the FDA granted Breakthrough Device designation to its Shield multi-cancer detection test. This status provides a faster review pathway for devices that address serious diseases. If clinical studies confirm performance, screening programs could add a test that covers cancers with no current screening option.
Where can laboratory services win new business?
Laboratory services have a clear opening, because many community hospitals lack the staff and equipment to run complex genomic panels. Central laboratories that combine next-generation sequencing with fast turnaround can capture outsourced volume from these sites. Distributable kits also let regional laboratories offer the same tests locally. As a result, service providers with broad payer contracts and digital reporting can grow faster than device makers.
Can digital and AI-based pathology expand capacity?
Digital pathology offers an opening in capacity, because pathologist shortages slow reporting in many countries. Scanned slides can be reviewed remotely and analyzed with algorithms that flag regions of concern for a pathologist. Hospitals that adopt whole-slide imaging can share work across sites and shorten turnaround for tissue samples. In turn, suppliers of scanners, software and image analysis gain a growing installed base.
Reimbursement gaps and low early-stage sensitivity
Why do reimbursement gaps limit uptake?
Reimbursement gaps limit uptake, because many payers outside the United States still cover only single-gene tests or tissue sampling. Laboratories must prove clinical utility, often through studies that take two to three years, before national health systems will pay for broad genomic panels or blood-based screening. Patients in Asia, Latin America and Africa often pay out of pocket, which restricts testing to wealthier groups. As a result, adoption of advanced tests trails clinical guidelines by several years in most regions.
How does low early-stage sensitivity affect blood tests?
Low sensitivity for early disease is a technical barrier, because small tumors shed very little DNA into the blood. Blood tests can therefore miss precancerous lesions and some early cancers that colonoscopy or tissue sampling would find. Clinicians still rely on tissue to confirm a positive blood result, to grade the tumor and to test for biomarkers. Colorectal cancer caused about 900,000 deaths in 2022, which shows the cost of missed early lesions. This limitation keeps tissue procedures central to diagnosis even as blood-based tests spread.
Why do sample quality and turnaround remain problems?
Sample quality and turnaround remain problems, because small needle samples often contain too little tumor tissue for genomic testing. Repeat procedures add cost, delay treatment and expose patients to more risk. Shipping samples to distant laboratories can also add days to the time before results are available. As a result, hospitals invest in rapid on-site evaluation and in-house panels to cut delays and avoid repeat procedures.
Do pathologist shortages slow testing growth?
Pathologist shortages slow testing growth, because every tissue sample needs expert review before molecular testing begins. Many countries in Africa and South Asia have very few pathologists per million people, which creates backlogs of several weeks for tissue reports. High-income countries also face pathologist retirements that outpace the number of new trainees each year. However, digital pathology and remote reporting can ease part of this constraint over the forecast period.
North America leads as Asia Pacific expands testing
| Region | Value, 2025 (USD billion) | Share, 2025 | CAGR, 2026–2035 |
|---|---|---|---|
| North America | 18.11 | 43.0% | 7.74% |
| Europe | 10.95 | 26.0% | 7.54% |
| Asia Pacific | 9.26 | 22.0% | 9.64% |
| Latin America | 2.11 | 5.0% | 8.84% |
| Middle East & Africa | 1.68 | 4.0% | 8.94% |
Why does North America hold the largest regional share?
North America held a 43.0% share of 2025 value and grows at 7.74% a year through 2035. The United States drives this position with broad coverage for comprehensive genomic profiling and the first approved blood test for colorectal screening. Large reference laboratories and academic cancer centers run high test volumes. However, price pressure from payers keeps regional growth slightly below the global rate.
How fast is Asia Pacific expanding testing?
Asia Pacific held a 22.0% share of 2025 value and is the fastest-growing region at 9.64% a year. China and Japan carry large numbers of lung, stomach, liver and colorectal cancers, which drive demand for both tissue and blood-based testing. Rising incomes and private insurance also allow more patients to pay for genomic profiling after diagnosis. As a result, local laboratories and global suppliers are expanding capacity in the region.
What shapes demand across Europe?
Europe held a 26.0% share of 2025 value and grows at 7.54% a year, the slowest pace of the five regions. National health systems in Germany, France, the United Kingdom, Italy and Spain fund tissue sampling widely but approve broad genomic panels more slowly. Colorectal screening programs in most European countries rely mainly on stool tests and colonoscopy. However, rising use of targeted drugs is widening coverage for molecular testing.
Where is Latin America adding demand?
Latin America held a 5.0% share of 2025 value and grows at 8.84% a year through 2035. Brazil and Mexico lead regional demand, where private hospitals offer genomic testing and public systems focus on tissue diagnosis. Wider access to oncology centers is lifting procedure volumes across the region.
What limits growth in the Middle East and Africa?
The Middle East and Africa held a 4.0% share of 2025 value and grows at 8.94% a year through 2035. Gulf states fund modern cancer centers that send samples to international laboratories for genomic profiling. Much of Africa still lacks pathology staff and laboratory capacity outside major cities.
Approvals and ownership changes since 2025
| Development | Status and market relevance |
|---|---|
| In June 2025, the FDA granted Breakthrough Device designation to Guardant Health's Shield multi-cancer detection blood test. | Designated; opens a faster review path for multi-cancer screening |
| In October 2025, Hologic agreed to be acquired by funds managed by Blackstone and TPG in a take-private transaction. | Agreed; moves a major screening and sampling supplier toward private ownership |
| In February 2026, Waters completed its combination with the Biosciences and Diagnostic Solutions businesses of BD. | Completed; places BD diagnostic instruments under a new owner |
| In April 2026, Blackstone and TPG completed the acquisition of Hologic, which became a private company. | Completed; Hologic now operates as a private company |
| In May 2026, the FDA approved Guardant360 Liquid CDx, the largest FDA-approved blood-based genomic panel. | Approved; seven companion diagnostic indications transferred from the earlier test |
Sequencing, cell capture and imaging tools to watch
- Comprehensive genomic profiling tests hundreds of genes in one run, which lets oncologists match patients to targeted drugs from a single sample.
- Circulating tumor cell capture isolates intact tumor cells from blood, which supports research into tumor cell biology and monitoring.
- Methylation-based blood screening reads chemical marks on circulating DNA, which helps detect cancers and estimate where they started.
- Image-guided and vacuum-assisted sampling improves accuracy for small lesions, which raises the share of samples with enough tissue for testing.
Need a Custom Version of This Report?
Tailor the scope, geography, or segments to your exact requirements.
- Custom geography or segment scope
- Direct access to our analyst team
Genomic specialists and imaging firms compete for volume
Competition splits between genomic testing specialists, sequencing and reagent suppliers and companies that make sampling devices and imaging systems. Guardant Health leads in blood-based profiling and screening, while Illumina supplies sequencers and distributable genomic panels to hospital laboratories. QIAGEN and Roche provide extraction kits, assays and laboratory systems used in tissue and blood workflows. In April 2026, Blackstone and TPG completed the acquisition of Hologic, which now operates as a private company. In February 2026, Waters completed a merger with the Biosciences and Diagnostic Solutions businesses of BD. Myriad Genetics offers hereditary and tumor testing, and Biodesix focuses on lung disease diagnostics. ANGLE plc develops circulating tumor cell capture technology, while Lucence Health, Oncimmune Holdings and Epigenomics AG pursue blood-based detection methods. The twelve companies profiled below span devices, reagents and services. However, payer coverage still decides which of these tests reach routine clinical use.
Companies profiled and their roles in this market
| Company | Type | Role in the market |
|---|---|---|
| Guardant Health Inc. | Testing services | Blood-based genomic profiling and colorectal screening |
| Illumina, Inc. | Sequencing | Sequencers and distributable comprehensive genomic panels |
| QIAGEN | Reagents | Sample preparation kits and companion diagnostic assays |
| F. Hoffmann-La Roche Ltd. | Diagnostics | Tissue and molecular diagnostic systems and assays |
| Hologic, Inc. | Devices | Breast sampling and screening systems, now privately owned |
| BD | Devices | Sampling needles and specimen collection products |
| Myriad Genetics, Inc. | Testing services | Hereditary and tumor genomic testing |
| Biodesix | Testing services | Blood-based lung disease diagnostics |
| ANGLE plc | Technology | Circulating tumor cell capture systems |
| Lucence Health Inc. | Testing services | Blood-based tumor profiling services |
| Oncimmune Holdings PLC | Technology | Autoantibody-based detection research |
| Epigenomics AG | Technology | Methylation-based blood detection methods |
Blood tests add volume while tissue keeps its role
Credence Research's view is that blood-based tests will add most of the new volume through 2035, while tissue sampling keeps its role in diagnosis and grading. The overall market grows at 8.24% a year, supported by case growth and the spread of targeted drugs. The strongest opportunities sit in blood-based screening, broad genomic panels and outsourced laboratory services. Companies that secure payer coverage and deliver fast results will hold an advantage, while device makers need to pair sampling tools with digital workflows.
How Credence Research sized tumor sampling spending
The report uses 2025 as the base year and 2026 to 2035 as the forecast period. Market values come from the Credence Research model, which builds spending by product, type, application and end user. Regional and segment splits are Credence Research estimates informed by World Health Organization statistics, regulator decisions and company press releases. No primary interviews or surveys were used in preparing this edition of the report.
Tumor sampling and profiling outlook to 2035
By 2035, the cancer biopsy market is projected to reach USD 92.98 billion, with growth led by blood-based testing and by new demand in Asia Pacific. Tissue sampling will remain the standard for diagnosis, but blood tests will take a larger role in screening, therapy selection and monitoring. Multi-cancer detection could open a new screening category if clinical studies confirm performance. North America keeps the highest value per patient, while Asia Pacific adds the most new testing. As a result, advantage will depend on payer coverage, test accuracy and laboratory reach.
Frequently Asked Questions
How big is the global cancer biopsy market?
Which type leads the cancer biopsy market?
Which region leads cancer biopsy spending?
Which cancer type accounts for the most testing?
How many new cancer cases occur worldwide?
Which blood tests have gained FDA approval recently?
Who are the leading cancer biopsy companies?
What restrains growth in cancer biopsy?
Table of Content
Chapter 1 Market Segmentation
- 1.1 Segmentation Framework
- 1.1.1 Product and Service Classification
- 1.1.2 Application and End-Use Classification
- 1.1.3 Technology and Solution Classification
- 1.1.4 Customer and Distribution Channel Classification
- 1.1.5 Geographic Segmentation
- 1.1.6 Market Segment Definitions and Boundaries
- 1.2 By Product
- 1.2.1 Kits
- 1.2.2 Consumables
- 1.2.3 Services
- 1.2.4 Instrument
- 1.3 By Type
- 1.3.1 Tissue Biopsies
- 1.3.2 Liquid Biopsies
- 1.4 By Application
- 1.4.1 Lung
- 1.4.2 Breast
- 1.4.3 Colorectal
- 1.4.4 Prostate
- 1.4.5 Others
- 1.5 By End User
- 1.5.1 Hospitals
- 1.5.2 Diagnostic Centers
- 1.5.3 Research Institutes
Chapter 2 Introduction
- 2.1 Report Objectives and Scope
- 2.2 Product Definition and Industry Terminology
- 2.3 Market Inclusions and Exclusions
- 2.4 Research Process
- 2.4.1 Primary Research and Expert Interviews
- 2.4.2 Secondary Research and Source Review
- 2.4.3 Top-Down and Bottom-Up Estimation
- 2.4.4 Data Triangulation and Verification
- 2.5 Market Size Measurement Basis
- 2.5.1 2025: USD 42.11 billion → 2035: USD 92.98 billion
- 2.6 Historical and Forecast Reference Periods
- 2.6.1 Historical Period: 2018-2025
- 2.6.2 Base Year: 2025
- 2.6.3 Forecast Period: 2025-2035
- 2.7 Research Assumptions and Limitations
Chapter 3 Executive Summary
- 3.1 Market Snapshot and Key Findings
- 3.2 Base-Year Market Size, 2025
- 3.3 Forecast Market Size, 2035
- 3.4 Revenue and Volume Growth Outlook
- 3.5 Key Demand and Supply Indicators
- 3.6 Leading Market Segments
- 3.7 Fastest-Growing Market Opportunities
- 3.8 Regional Performance Highlights
- 3.9 Technology and Industry Transformation
- 3.10 Competitive Landscape Summary
- 3.11 Analyst View and Strategic Implications
Chapter 4 Global Cancer Biopsy Market Trends and Developments
- 4.1 Historical Industry Development, 2018-2025
- 4.2 Recent Market Trends and Developments
- 4.3 Demand and Customer Behavior Trends
- 4.4 Technology and Product Innovation
- 4.5 Artificial Intelligence, Automation and Digitalization
- 4.6 Local Manufacturing and Supply Chain Realignment
- 4.7 Industry Partnerships, Mergers and Acquisitions
- 4.8 Sustainability and Circular Economy Developments
- 4.9 Government and Private Sector Investment Trends
- 4.10 Emerging Business Models and Commercialization
- 4.11 Industry Developments and Announcements
Chapter 5 Global Cancer Biopsy Market Production, Supply and Demand Analysis
- 5.1 Demand Trend and Consumption Analysis, 2018-2025
- 5.2 Demand Forecast, 2025-2035
- 5.3 Production and Output Trend, 2018-2025
- 5.4 Production and Output Forecast, 2025-2035
- 5.5 Installed Capacity and Capacity Utilization
- 5.6 Company-Wise Production Plants and Statistics
- 5.6.1 Installed Production Capacity
- 5.6.2 Actual Production
- 5.6.3 Planned Capacity and Expansion Targets
- 5.7 Supply Chain Structure and Procurement Trends
- 5.8 Supply-Demand Gap and Bottlenecks
- 5.9 Import Dependence and Sourcing Structure
- 5.10 Contract Manufacturing and Outsourcing
- 5.11 Regional Supply and Demand Concentration
Chapter 6 Global Cancer Biopsy Market Pricing Analysis
- 6.1 Pricing Structure and Measurement
- 6.2 Historical Pricing Trends, 2018-2025
- 6.3 Pricing Outlook, 2025-2035
- 6.4 Average Selling Price and Unit Economics
- 6.5 Pricing by Product and Market Segment
- 6.6 Geographic Pricing Differences
- 6.7 Key Input, Energy, Labor and Logistics Costs
- 6.8 Contract Pricing and Purchasing Models
- 6.9 Pricing Sensitivity and Competitive Positioning
- 6.10 Price, Margin and Profitability Implications
Chapter 7 Global Cancer Biopsy Market Dynamics
- 7.1 Market Growth Drivers
- 7.1.1 Demand-Side Drivers
- 7.1.2 Technology and Innovation Drivers
- 7.1.3 Infrastructure and Investment Drivers
- 7.1.4 Regulatory and Policy Drivers
- 7.2 Market Restraints
- 7.2.1 Cost and Affordability Constraints
- 7.2.2 Technology and Adoption Barriers
- 7.2.3 Supply Chain and Operational Constraints
- 7.3 Market Challenges
- 7.3.1 Competitive Pressure and Margin Erosion
- 7.3.2 Skills, Infrastructure and Implementation Gaps
- 7.4 Emerging Market Opportunities
- 7.5 Market Dynamics Impact and Time-Horizon Assessment
Chapter 8 Global Cancer Biopsy Value Chain Analysis
- 8.1 Industry Value Chain Overview
- 8.2 Upstream Suppliers and Critical Inputs
- 8.3 Technology and Component Providers
- 8.4 Manufacturing or Service Delivery
- 8.5 Distribution, Channel Partners and Integrators
- 8.6 Downstream Applications and End Users
- 8.7 Value Addition and Profit Pools
- 8.8 Vertical Integration and Outsourcing
- 8.9 Supplier Concentration and Risk
- 8.10 Supply Chain Localization and Resilience
Chapter 9 Global Cancer Biopsy Market Regulations and Policies
- 9.1 Relevant Laws, Standards and Compliance Frameworks
- 9.2 Product, Service, Safety and Quality Requirements
- 9.3 Government Policies, Incentives and Subsidies
- 9.4 Imports, Exports and Trade Barriers
- 9.5 Public Procurement and Local Content Requirements
- 9.6 Environmental and Sustainability Compliance
- 9.7 Upcoming Policy Changes and Market Implications
Chapter 10 Global Cancer Biopsy Market Hotspots and Opportunities
- 10.1 Market Opportunity Mapping and Growth Hotspots
- 10.2 High-Growth Applications and Customer Groups
- 10.3 Underserved Markets and White-Space Opportunities
- 10.4 Emerging Technology and Product Opportunities
- 10.5 New Capacity and Investment Hotspots
- 10.6 Market Entry and Expansion Opportunities
- 10.7 Distribution and Partnership Opportunities
- 10.8 Near-Term and Long-Term Commercial Potential
- 10.9 Opportunity Attractiveness and Execution Risks
Chapter 11 Global Cancer Biopsy Market Outlook, 2025-2035
- 11.1 Market Size and Analysis
- 11.1.1 Revenue (Market Measurement: 2025: USD 42.11 billion → 2035: USD 92.98 billion)
- 11.1.2 Market Volume and Quantity Sold
- 11.1.3 Historical Market Size, 2018-2025
- 11.1.4 Base-Year Market Size, 2025
- 11.2 Market Forecast, 2025-2035
- 11.2.1 Revenue Forecast to 2035
- 11.2.2 Volume Forecast to 2035
- 11.2.3 CAGR and Year-on-Year Growth
- 11.2.4 Incremental Revenue Opportunity
- 11.3 Forecast Assumptions and Scenario Analysis
- 11.3.1 Base-Case Forecast
- 11.3.2 Optimistic and Conservative Scenarios
- 11.3.3 Technology, Pricing and Policy Sensitivities
- 11.4 Market Attractiveness and Growth Outlook
Chapter 12 Global Cancer Biopsy Market Segmentation and Outlook
- 12.1 Segmentation Summary and Market Shares, 2025
- 12.2 Largest and Fastest-Growing Segments
- 12.3 By Product - Market Size and Forecast, 2025-2035
- 12.3.1 Segment Definition and Scope
- 12.3.2 Historical Market Size, 2018-2025
- 12.3.3 Revenue Forecast, 2025-2035
- 12.3.4 Volume Forecast, 2025-2035
- 12.3.5 Base-Year Market Share, 2025
- 12.3.6 Segment CAGR and Growth Drivers
- 12.3.7 Subsegment Market Size and Forecast
- 12.3.7.1 Kits
- 12.3.7.2 Consumables
- 12.3.7.3 Services
- 12.3.7.4 Instrument
- 12.3.8 Subsegment Pricing and Adoption Trends
- 12.3.9 Leading Suppliers and Competition
- 12.3.10 Regional Demand and Opportunities
- 12.4 By Type - Market Size and Forecast, 2025-2035
- 12.4.1 Segment Definition and Scope
- 12.4.2 Historical Market Size, 2018-2025
- 12.4.3 Revenue Forecast, 2025-2035
- 12.4.4 Volume Forecast, 2025-2035
- 12.4.5 Base-Year Market Share, 2025
- 12.4.6 Segment CAGR and Growth Drivers
- 12.4.7 Subsegment Market Size and Forecast
- 12.4.7.1 Tissue Biopsies
- 12.4.7.2 Liquid Biopsies
- 12.4.8 Subsegment Pricing and Adoption Trends
- 12.4.9 Leading Suppliers and Competition
- 12.4.10 Regional Demand and Opportunities
- 12.5 By Application - Market Size and Forecast, 2025-2035
- 12.5.1 Segment Definition and Scope
- 12.5.2 Historical Market Size, 2018-2025
- 12.5.3 Revenue Forecast, 2025-2035
- 12.5.4 Volume Forecast, 2025-2035
- 12.5.5 Base-Year Market Share, 2025
- 12.5.6 Segment CAGR and Growth Drivers
- 12.5.7 Subsegment Market Size and Forecast
- 12.5.7.1 Lung
- 12.5.7.2 Breast
- 12.5.7.3 Colorectal
- 12.5.7.4 Prostate
- 12.5.7.5 Others
- 12.5.8 Subsegment Pricing and Adoption Trends
- 12.5.9 Leading Suppliers and Competition
- 12.5.10 Regional Demand and Opportunities
- 12.6 By End User - Market Size and Forecast, 2025-2035
- 12.6.1 Segment Definition and Scope
- 12.6.2 Historical Market Size, 2018-2025
- 12.6.3 Revenue Forecast, 2025-2035
- 12.6.4 Volume Forecast, 2025-2035
- 12.6.5 Base-Year Market Share, 2025
- 12.6.6 Segment CAGR and Growth Drivers
- 12.6.7 Subsegment Market Size and Forecast
- 12.6.7.1 Hospitals
- 12.6.7.2 Diagnostic Centers
- 12.6.7.3 Research Institutes
- 12.6.8 Subsegment Pricing and Adoption Trends
- 12.6.9 Leading Suppliers and Competition
- 12.6.10 Regional Demand and Opportunities
- 12.7 Segment Growth Comparison
- 12.8 Segment Attractiveness and Priority Matrix
Chapter 13 Global Cancer Biopsy End-Use and Application Market Outlook
- 13.1 End-Use Industry and Customer Demand Structure
- 13.2 Leading Applications and Customer Groups
- 13.3 End-Use Market Size, Share and Forecast
- 13.4 Major End-Use Industry Deep Dives
- 13.4.1 Customer Requirements and Use Cases
- 13.4.2 Demand and Replacement Cycles
- 13.4.3 Technical and Regulatory Considerations
- 13.4.4 Purchasing and Procurement Models
- 13.4.5 Leading Vendors and Distribution Channels
- 13.4.6 Forecast and Commercial Opportunities
- 13.5 Emerging Applications and Cross-Segment Demand
- 13.6 End-Use Industry Investment Priorities
Chapter 14 Global Cancer Biopsy Geographic Market Outlook, 2025-2035
- 14.1 Regional Market Size and Share, 2025
- 14.2 Regional Market Forecast, 2025-2035
- 14.3 Regional Pricing, Production and Demand Differences
- 14.4 North America
- 14.4.1 United States
- 14.4.2 Canada
- 14.4.3 Mexico
- 14.5 Europe
- 14.5.1 Germany
- 14.5.2 France
- 14.5.3 Italy
- 14.5.4 United Kingdom
- 14.5.5 Spain
- 14.5.6 Poland
- 14.5.7 Russia
- 14.5.8 Netherlands
- 14.5.9 Belgium
- 14.5.10 Sweden
- 14.5.11 Denmark
- 14.5.12 Norway
- 14.5.13 Rest of Europe
- 14.6 Asia Pacific
- 14.6.1 China
- 14.6.2 India
- 14.6.3 Japan
- 14.6.4 South Korea
- 14.6.5 Thailand
- 14.6.6 Indonesia
- 14.6.7 Vietnam
- 14.6.8 Malaysia
- 14.6.9 Australia
- 14.6.10 Rest of Asia Pacific
- 14.7 Latin America
- 14.7.1 Brazil
- 14.7.2 Argentina
- 14.7.3 Colombia
- 14.7.4 Chile
- 14.7.5 Rest of Latin America
- 14.8 Middle East
- 14.8.1 Saudi Arabia
- 14.8.2 United Arab Emirates
- 14.8.3 Turkey
- 14.8.4 Israel
- 14.8.5 Iran
- 14.8.6 Rest of the Middle East
- 14.9 Africa
- 14.9.1 South Africa
- 14.9.2 Egypt
- 14.9.3 Nigeria
- 14.9.4 Morocco
- 14.9.5 Rest of Africa
- 14.10 Regional Investment, Policy and Supply Chain Differences
- 14.11 Regional Competitive Landscape
- 14.12 Geographic Growth Hotspots
Chapter 15 Global Cancer Biopsy Technology, Innovation and Sustainability Outlook
- 15.1 Technology Landscape and Maturity
- 15.2 Product, Process and Service Innovation
- 15.3 AI, Automation and Digital Tools in the Industry
- 15.4 Technology Adoption and Performance Benchmarking
- 15.5 Innovation Pipeline and R&D Investment
- 15.6 Patent and Intellectual Property Trends
- 15.7 Energy Efficiency and Resource Management
- 15.8 Sustainability, Recycling and Circularity
- 15.9 Technology Roadmap, 2025-2035
- 15.10 Risks of Obsolescence and Technology Substitution
Chapter 16 Global Cancer Biopsy Market Key Strategic Imperatives
- 16.1 Growth and Market Entry Priorities
- 16.2 High-Return Products and Segments
- 16.3 Pricing, Profitability and Cost Optimization
- 16.4 Technology Investment and Product Differentiation
- 16.5 Supply Chain Localization and Resilience
- 16.6 Distribution and Customer Acquisition
- 16.7 Partnership, Acquisition and Capacity Strategy
- 16.8 Regional Expansion Priorities
- 16.9 Short-, Medium- and Long-Term Actions
Chapter 17 Competition Outlook
- 17.1 Industry Competition Characteristics
- 17.2 Market Structure and Concentration
- 17.3 Market Share and Competitive Positioning, 2025
- 17.4 Company-Wise Revenue and Product Benchmarking
- 17.5 Production and Service Capacity Benchmarking
- 17.6 Technology, Pricing and Differentiation
- 17.7 Regional Footprint and Distribution Strength
- 17.8 Mergers, Acquisitions and Strategic Alliances
- 17.9 New Entrants and Competitive Threats
- 17.10 Porter's Five Forces and Industry Attractiveness
- 17.11 Competitive Outlook, 2025-2035
Chapter 18 Company Profiles
- 18.1 Company Coverage and Selection Criteria
- 18.2 QIAGEN
- 18.2.1 Business Description
- 18.2.2 Company Ownership and Geographic Presence
- 18.2.3 Product and Service Portfolio
- 18.2.4 Manufacturing and Operating Footprint
- 18.2.5 Production Capacity and Expansion Plans
- 18.2.6 Financial Performance and Investment
- 18.2.7 Market Share and Competitive Position
- 18.2.8 Technology and Innovation Capabilities
- 18.2.9 Strategic Alliances or Partnerships
- 18.2.10 Recent Developments
- 18.2.11 Growth Strategy and Outlook
- 18.3 Illumina, Inc.
- 18.4 ANGLE plc
- 18.5 BD
- 18.6 Biodesix
- 18.7 Lucence Health Inc.
- 18.8 Myriad Genetics, Inc.
- 18.9 Hologic, Inc.
- 18.10 Oncimmune Holdings PLC
- 18.11 F. Hoffmann-La Roche Ltd.
- 18.12 Guardant Health Inc.
- 18.13 Epigenomics AG
- 18.14 Other Relevant Market Participants
Note: Every listed company is profiled on the structure shown under the first company. The company list is preliminary and may change based on research findings, market developments, data availability and client requirements.
Chapter 19 Disclaimer
- 19.1 Research and Forecast Disclaimer
- 19.2 Data Source and Estimation Limitations
Note: The depth of individual sections depends on data availability for this market. Volume, capacity, trade and other unit-based metrics are included where applicable.