
Circulating Tumor Cells Market Overview:
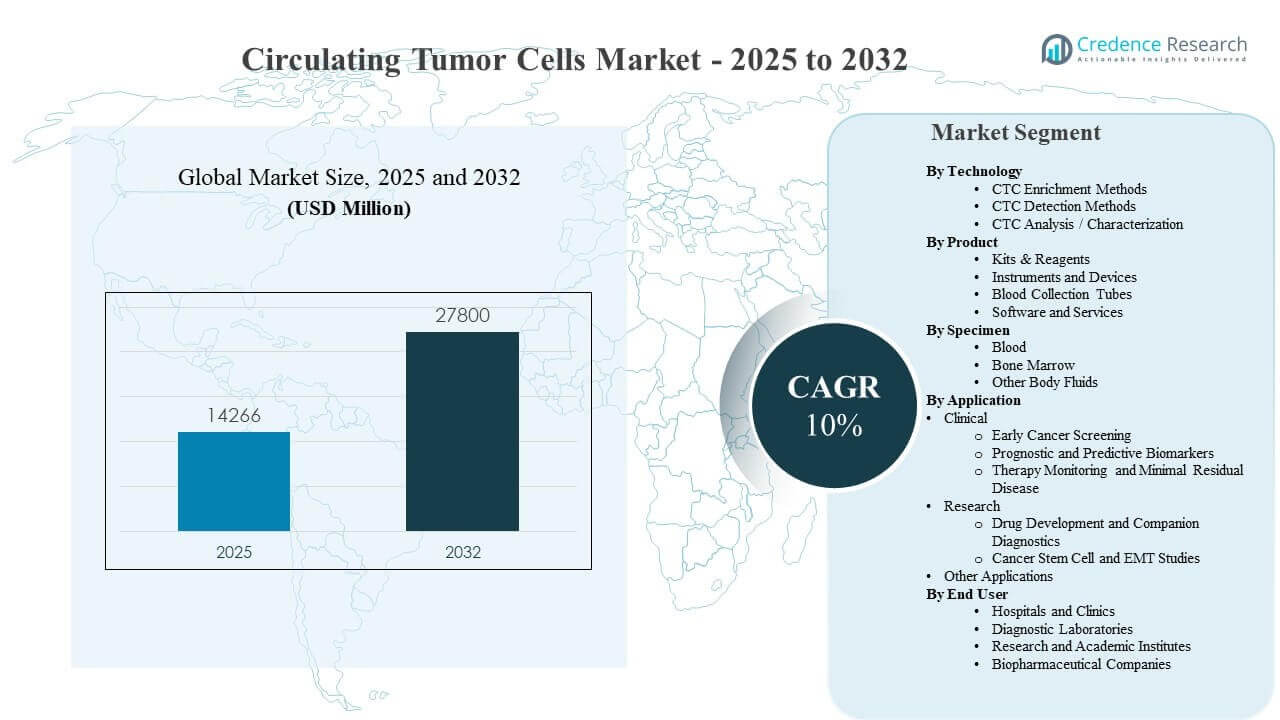
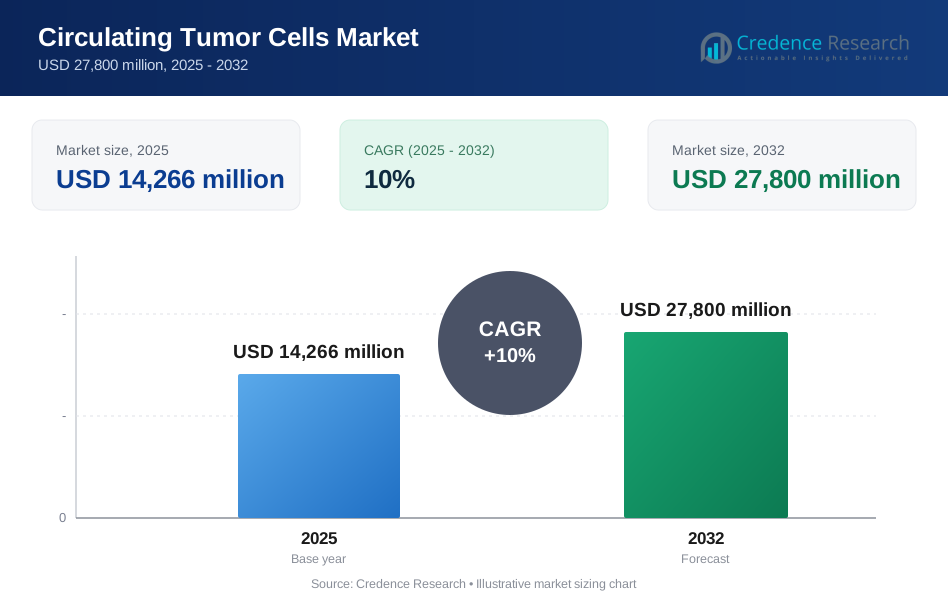
The global Circulating Tumor Cells Market size was estimated at USD 14,266 million in 2025 and is expected to reach USD 27,800 million by 2032, growing at a CAGR of 10% from 2025 to 2032. Rising clinical adoption of liquid biopsy for therapy monitoring and disease assessment is accelerating demand for repeatable workflows that can isolate and characterize rare circulating tumor cells from routine blood draws. Expansion of oncology testing capacity in Asia Pacific and broader integration of biomarker-led decision-making in hospitals and reference laboratories are further supporting market momentum.
| REPORT ATTRIBUTE | DETAILS |
|---|---|
| Historical Period | 2020-2024 |
| Base Year | 2025 |
| Forecast Period | 2026-2032 |
| Circulating Tumor Cells Market Size 2025 | USD 14,266 million |
| Circulating Tumor Cells Market, CAGR | 10% |
| Circulating Tumor Cells Market Size 2032 | USD 27,800 million |
Key Market Trends & Insights
- The market is projected to expand from USD 14,266 million (2025) to USD 27,800 million (2032), reflecting a 10% CAGR (2025–2032).
- North America accounted for 39.60% share in 2025, supported by high testing penetration and mature oncology diagnostics infrastructure.
- Europe represented 31.90% share in 2025, reflecting strong clinical research translation and adoption across major healthcare systems.
- Clinical applications contributed 64.80% share in 2025, driven by therapy monitoring, minimal residual disease assessment, and biomarker-led treatment decisions.
- Kits & Reagents held 41.70% share in 2025, highlighting the recurring consumables layer in CTC workflows compared with capital equipment cycles.
Segment Analysis
Circulating tumor cell workflows are increasingly positioned as a practical bridge between conventional tissue biopsy and broader liquid biopsy testing, enabling serial assessment of tumor dynamics using minimally invasive sampling. Buyers prioritize solutions that reduce variability in rare-cell recovery and deliver consistent downstream readouts for monitoring and decision support. The recurring nature of consumables, validated protocols, and integration with existing laboratory processes keeps adoption anchored in high-throughput clinical environments. Demand also benefits from rising interest in tumor heterogeneity and resistance mechanisms, where single-cell and multi-omic characterization can add clinical and research value.
Across adoption settings, hospitals and clinics remain central because CTC testing aligns with oncology pathway needs, including response tracking and risk stratification. Diagnostic laboratories expand access through centralized testing models, automation, and standardized reporting. Research and academic institutes continue to broaden characterization use cases, strengthening method validation and translational evidence that can later support clinical uptake. Biopharmaceutical companies increasingly use CTC-derived signals in trial workflows, particularly where biomarker strategies require minimally invasive longitudinal sampling.
By Technology Insights
CTC Detection & Enrichment Methods accounted for the largest share of 47.40% in 2025. This leadership reflects the operational reality that rare-cell workflows depend on reliable upfront isolation to improve signal quality before downstream detection or characterization. Clinical and high-throughput users favor approaches that can maintain recovery consistency across variable sample quality and tumor biology. Multi-approach offerings that support both label-based and label-free strategies help laboratories select the best-fit workflow by cancer type and intended endpoint.
By Product Insights
Kits & Reagents accounted for the largest share of 41.70% in 2025. Consumables lead because routine clinical and research testing requires continual replenishment across enrichment, staining, nucleic acid preparation, and assay validation steps. Standardized kits reduce inter-operator variability and support faster onboarding for labs scaling liquid biopsy programs. Vendors that provide robust protocols, quality controls, and compatibility with multiple instruments strengthen repeat purchase behavior and long-term customer retention.
By Specimen Insights
Blood accounted for the largest share of 45.20% in 2025. Blood-based sampling dominates due to routine accessibility, repeatability for longitudinal monitoring, and practical fit with oncology testing pathways. Standard blood collection and handling workflows support higher volume testing compared with alternative specimens. As clinical programs scale, emphasis on pre-analytical stability, transport logistics, and standardized collection tubes further reinforces blood as the default specimen choice.
By Application Insights
Clinical accounted for the largest share of 64.80% in 2025. Clinical adoption is anchored in therapy monitoring and disease-state assessment, where CTC counts and characteristics can complement imaging and other biomarkers. Prognostic and predictive use cases support risk stratification and treatment planning, increasing demand for repeatable testing protocols. As more evidence accumulates and reporting standardization improves, clinical workflows continue to expand, especially in settings that already run broader liquid biopsy testing.
By End User Insights
Hospitals and Clinics accounted for the largest share of 34.60% in 2025. Hospitals lead because they own the clinical decision points where serial monitoring and biomarker interpretation influence therapy choices. Integration with oncology clinics, pathology, and multidisciplinary tumor boards increases the utility of longitudinal CTC insights. Where internal testing is limited, hospitals also act as the primary ordering hubs that route samples to specialized diagnostic laboratories, sustaining overall testing volume growth.
Circulating Tumor Cells Market Drivers
Expansion of liquid biopsy in oncology care pathways
Circulating tumor cell testing benefits from broader adoption of liquid biopsy approaches that enable repeat monitoring with less invasiveness than tissue procedures. Oncology teams increasingly value longitudinal insights that can support response tracking and timely detection of progression signals. Hospitals and clinics prefer workflows that can be operationalized within existing lab and clinical processes to minimize friction. As evidence and clinician familiarity grow, CTC testing is used more often as part of multi-biomarker strategies supporting precision oncology decisions.
Technology advances improving rare-cell recovery and downstream readouts
CTC workflows are strengthened by improvements in enrichment, detection sensitivity, and characterization capabilities that reduce false negatives and improve reproducibility. Microfluidic and immunomagnetic approaches continue to mature, while imaging and molecular techniques broaden the types of endpoints available from rare-cell samples. Better automation and standardized protocols improve throughput and reduce operator dependence, which is important for clinical scaling. These advances make CTC workflows more accessible for a wider set of laboratories beyond specialized research centers.
Increasing emphasis on therapy monitoring and minimal residual disease assessment
Clinical demand is supported by the need to monitor therapy response, detect emerging resistance, and refine treatment plans over time. Serial testing helps clinicians assess dynamic tumor behavior, especially when tissue biopsies are impractical or infrequent. CTC-based monitoring can complement imaging by offering earlier biological signals tied to disease activity. As adoption expands, providers place higher priority on consistent sample handling, robust analytics, and clinically interpretable reporting formats.
- For instance, Vortex Biosciences' VTX-1 Liquid Biopsy System demonstrates 95% tethering efficiency for live CTC isolation and enables same-day microtentacle morphology analysis within 1 hour post-collection, with CTC integrity validated stable for up to 72 hours post-draw to support decentralized sampling in multi-center therapy monitoring studies.
Growth in translational research and biomarker-led drug development
Research adoption is driven by the value of CTCs for understanding tumor heterogeneity, metastatic biology, and treatment resistance mechanisms. Academic institutes and biopharmaceutical companies use CTC-derived insights to support patient stratification, companion diagnostic development, and exploratory biomarker programs. Single-cell and multi-omic characterization strengthens the role of CTCs as a research substrate that can be repeatedly sampled. These research dynamics help build clinical evidence and create new workflow requirements that vendors can address with integrated solutions.
- For instance, Menarini Silicon Biosystems' DEPArray™ NxT digital cell sorter delivers 100% pure single-cell or pool recoveries (96 single cells per run, ~80 seconds per cell) with 9 fluorescent channels, enabling direct integration with CELLSEARCH-enriched samples for single-cell DNA/RNA sequencing that has supported >200 peer-reviewed translational oncology studies.
Circulating Tumor Cells Market Challenges
CTC testing remains technically demanding because circulating tumor cells are rare and heterogeneous, making recovery sensitive to pre-analytical handling and method selection. Differences in enrichment principles and detection approaches can lead to variability across laboratories, which complicates standardization and comparison of results. Clinical adoption can be constrained by the need for trained operators, validated protocols, and consistent quality controls, especially in mid-tier facilities. Reimbursement variability and the need for strong clinical utility evidence can also slow routine deployment across broader healthcare systems.
- For instance, Menarini Silicon Biosystems' CellSearch® system, the only FDA-cleared CTC enumeration platform, achieves 86–92% capture efficiency for EpCAM-positive cells but shows recovery rates dropping to 32–49% for EpCAM-low phenotypes like NCI-H1563 lung cancer cells, highlighting phenotype-dependent variability.
Operational complexity increases when laboratories attempt to scale from research to clinical volumes, as throughput, automation, and reporting requirements become stricter. Integration with laboratory information systems and clinical decision workflows may require customization that adds cost and implementation time. Some institutions prioritize alternative liquid biopsy approaches depending on clinical objectives, which creates competitive pressure for CTC-focused offerings. Vendors must continuously improve usability, robustness, and interpretability to sustain adoption and renewals.
Circulating Tumor Cells Market Trends and Opportunities
Integration of enrichment, detection, and analysis into more streamlined workflows is a key trend, with buyers seeking platforms that reduce variability and improve throughput. Software and services opportunities are expanding as laboratories require standardized analytics, reporting support, and interoperability with existing systems. Vendors that provide validated end-to-end workflows can shorten adoption cycles and strengthen customer retention. Opportunities also emerge from multi-omic characterization capabilities that increase the value of each sample, particularly in research and translational settings.
Asia Pacific expansion creates growth opportunities for suppliers that can support scaled deployments across diverse laboratory maturity levels. Training, protocol standardization, and reliable supply of consumables remain important differentiators in high-growth settings. Partnerships with diagnostic laboratories and oncology networks can accelerate access and improve sample volume pipelines. Companies that position CTC solutions as part of complementary biomarker strategies can increase relevance across both clinical monitoring and drug development programs.
- For instance, Menarini states that its Asia Pacific entry came through a Singapore-based acquisition spanning 13 countries from China to Australia, and it paired that footprint with CELLSEARCH, an FDA-approved CTC technology that was already being used by approximately 300 laboratories worldwide.
Regional Insights
North America
North America held the largest share at 39.60% in 2025, supported by high oncology testing penetration and established liquid biopsy ecosystems. Hospitals, reference laboratories, and research institutions in the region commonly adopt advanced rare-cell workflows when there is clear utility in monitoring and biomarker strategy. Vendor presence, clinical collaboration, and integration into oncology pathways strengthen adoption continuity. The region also benefits from translational research activity that sustains characterization demand and supports protocol validation.
Europe
Europe accounted for 31.90% in 2025, supported by strong research-to-clinic translation and structured healthcare delivery across major countries. Adoption is reinforced by oncology centers that prioritize standardized workflows and quality systems. Variation in reimbursement and country-level clinical guidelines can influence the speed of routine deployment. Demand remains supported by clinical monitoring needs and research programs focused on metastatic biology and biomarker-led treatment strategies.
Asia Pacific
Asia Pacific represented 19.20% in 2025 and is positioned for faster expansion as oncology infrastructure scales and advanced diagnostics become more accessible. Growth is supported by increasing cancer burden, improving laboratory capabilities, and rising clinical research participation. Large population bases and expanding tertiary care networks increase the addressable testing volume potential. Suppliers that provide robust training, standardized protocols, and reliable consumables availability are better positioned to scale adoption.
Latin America
Latin America reached 5.10% in 2025, with adoption concentrated in leading countries and top-tier oncology centers. Testing growth depends on expanding laboratory capacity, improving access to advanced diagnostics, and broader clinician familiarity with liquid biopsy workflows. Centralized diagnostic laboratory models can support scaling where hospital-based capabilities are limited. Vendors that align workflow complexity with local operational realities can improve adoption outcomes.
Middle East & Africa
Middle East & Africa accounted for 4.20% in 2025, with demand centered in countries building advanced healthcare hubs and specialized oncology services. Expansion is supported by investments in hospital infrastructure and diagnostic capabilities, though adoption can remain uneven across the region. Training, logistics, and protocol standardization are key requirements for reliable rare-cell testing workflows. Partnerships with leading institutions and reference laboratories can help accelerate reach and utilization.
Competitive Landscape
Competition in the circulating tumor cells market is shaped by the ability to deliver reliable rare-cell workflows that combine effective enrichment with sensitive detection and clinically relevant characterization. Vendors differentiate through assay robustness, automation readiness, workflow integration, and the breadth of downstream endpoints supported. Commercial strategies often emphasize protocol standardization, service support, and partnerships with clinical and research institutions to strengthen evidence and drive adoption. Companies also compete by expanding consumables portfolios and strengthening interoperability across laboratory systems.
QIAGEN’s approach is typically aligned with enabling downstream molecular analysis and workflow standardization across oncology testing environments. The company’s positioning benefits from providing tools that can support sample-to-insight pipelines, including nucleic acid workflows and analytical enablement used in translational and clinical contexts. By aligning with complementary platforms and partners, QIAGEN can strengthen end-to-end adoption where CTC capture workflows feed into broader molecular profiling strategies. This workflow alignment supports demand from both research programs and clinical labs seeking standardized outputs.
The industry research and growth report includes detailed analyses of the competitive landscape of the market and information about key companies, including:
- QIAGEN
- Bio-Techne Corporation
- Sysmex Corporation
- STEMCELL Technologies
- Menarini Silicon Biosystems
- Greiner Bio-One International
- Biocept, Inc.
- Fluxion Biosciences
- Ikonisys
- Miltenyi Biotec
- Epic Sciences
- SCREEN Holdings
Qualitative and quantitative analysis of companies has been conducted to help clients understand the wider business environment as well as the strengths and weaknesses of key industry players. Data is qualitatively analyzed to categorize companies as pure play, category-focused, industry-focused, and diversified; it is quantitatively analyzed to categorize companies as dominant, leading, strong, tentative, and weak.
Recent Developments
- In August 2025, ANGLE plc announced a collaboration with Myriad Genetics to evaluate whether DNA derived from circulating tumor cells harvested through ANGLE’s Parsortix system can be used with Myriad’s existing tissue-based companion diagnostic tests, supporting broader blood-based precision oncology applications.
- In June 2024, Bio-Rad Laboratories, Inc. launched Celselect Slides 2.0 to improve rare cell and circulating tumor cell capture, and the product was designed to work with the Genesis Cell Isolation System while allowing larger liquid biopsy sample volumes and greater CTC recovery for enumeration and downstream research use.
- In March 2024, Bio-Rad Laboratories, Inc. also launched validated antibodies for rare cell and circulating tumor cell enumeration, with the antibodies developed for use with Celselect Slides Enumeration Stain Kits to support more sensitive and specific identification of CTC surface markers.
Report Scope
| Report Attribute | Details |
| Market size value in 2025 | USD 14266 million |
| Revenue forecast in 2032 | USD 27800 million |
| Growth rate (CAGR) | 10% (2025–2032) |
| Base year | 2025 |
| Forecast period | 2026-2032 |
| Quantitative units | USD million |
| Segments covered | By Technology; By Product; By Specimen; By Application; By End User |
| Regional scope | North America, Europe, Asia Pacific, Latin America, Middle East & Africa |
| Key companies profiled | QIAGEN; Bio-Techne; Sysmex; STEMCELL; Menarini Silicon Biosystems; Greiner Bio-One; Biocept; Fluxion Biosciences; Ikonisys; Miltenyi Biotec; Epic Sciences; SCREEN Holdings |
| No. of Pages | 328 |
Segmentation
By Technology
- CTC Enrichment Methods
- Positive Enrichment
- Negative Enrichment
- Size-Based Isolation
- Density-Based Separation
- Immunomagnetic Separation
- Microfluidic Chip-Based
- Other Enrichment Methods
- CTC Detection Methods
- Immunocytochemical Technology
- Molecular (RNA)-Based Technology
- Imaging-Based Technology
- PCR-Based Technology
- SERS-Based Technology
- Other Detection Methods
- CTC Analysis / Characterization
- Single-Cell Sequencing
- Protein Expression Analysis
- Epigenetic Profiling
By Product
- Kits & Reagents
- Instruments and Devices
- Blood Collection Tubes
- Software and Services
By Specimen
- Blood
- Bone Marrow
- Other Body Fluids
By Application
- Clinical
- Early Cancer Screening
- Prognostic and Predictive Biomarkers
- Therapy Monitoring and Minimal Residual Disease
- Research
- Drug Development and Companion Diagnostics
- Cancer Stem Cell and EMT Studies
- Other Applications
By End User
- Hospitals and Clinics
- Diagnostic Laboratories
- Research and Academic Institutes
- Biopharmaceutical Companies
By Region
- North America
- U.S.
- Canada
- Mexico
- Europe
- Germany
- France
- U.K.
- Italy
- Spain
- Rest of Europe
- Asia Pacific
- China
- Japan
- India
- South Korea
- South-east Asia
- Rest of Asia Pacific
- Latin America
- Brazil
- Argentina
- Rest of Latin America
- Middle East & Africa
- GCC Countries
- South Africa
- Rest of the Middle East and Africa
Request a Free Sample
Fill in your details and we'll send you a free sample report.
- Sample data tables & charts
- Research methodology
Need a Custom Version of This Report?
Tailor the scope, geography, or segments to your exact requirements.
- Custom geography or segment scope
- Direct access to our analyst team
Frequently Asked Questions
What is the market size of the Circulating Tumor Cells Market in 2025 and its forecast for 2032?
What is the CAGR of the Circulating Tumor Cells Market during 2025–2032?
What is the largest segment by application in 2025?
What factors are driving growth in the Circulating Tumor Cells Market?
Who are the leading companies in the Circulating Tumor Cells Market?
Which region leads the Circulating Tumor Cells Market in 2025?
Table of Content
Chapter 1. Report Introduction
- 1.1 Report Description & Purpose
- 1.1.1 Report Title & Market Definition
- 1.1.2 Unique Selling Propositions (USP) & Key Differentiators
- 1.1.3 Value Proposition for Stakeholders
- 1.2 Research Objectives
- 1.2.1 Market Sizing Objectives (Volume & Revenue)
- 1.2.2 Segmentation Objectives
- 1.2.3 Competitive Intelligence Objectives
- 1.2.4 Forecast & Scenario Objectives
- 1.3 Report Scope
- 1.3.1 Circulating Tumor Cells Scope – Types & Subtypes Covered
- 1.3.2 Geographic Scope – Regions & Countries Covered
- 1.3.3 Historical Period, Base Year & Forecast Period (2025; forecast to 2032)
- 1.3.4 Inclusions & Exclusions
- 1.4 HS Code & Classification Framework
- 1.5 Currency, Units & Pricing Basis
- 1.6 Target Stakeholders
- 1.7 Limitations & Assumptions
Chapter 2. Executive Summary
- 2.1 Global Circulating Tumor Cells Market Snapshot
- 2.1.1 Market Size – Historical (2025) & Forecast (2025-2032) (2025: USD 14,266 million → 2032: USD 27,800 million)
- 2.1.2 Volume & Revenue – Global Totals
- 2.1.3 Key Market Highlights – Top Five Facts
- 2.2 Circulating Tumor Cells Market Segmentation Snapshot
- 2.2.1 Market Split by Region – 2025 vs. 2032
- 2.3 Competitive Snapshot
- 2.3.1 Top 10 Players by Revenue Share – 2025
- 2.3.2 Top 10 Players by Volume Share – 2025
- 2.3.3 Recent Strategic Developments (18-Month Summary)
- 2.4 Key Investment Highlights & Strategic Conclusions
Chapter 3. Circulating Tumor Cells Market Dynamics & Industry Analysis
- 3.1 Market Overview & Context
- 3.1.1 Circulating Tumor Cells Market Position in the Broader Automotive Value Chain
- 3.1.2 OEM vs. Replacement Market Dynamics
- 3.1.3 Market Maturity & Development Stage by Region
- 3.2 Circulating Tumor Cells Market Drivers
- 3.3 Circulating Tumor Cells Market Restraints & Challenges
- 3.4 Circulating Tumor Cells Market Opportunities
- 3.5 Porter's Five Forces Analysis
- 3.5.1 Threat of New Entrants
- 3.5.2 Bargaining Power of Suppliers
- 3.5.3 Bargaining Power of Buyers
- 3.5.4 Threat of Substitutes
- 3.5.5 Competitive Rivalry – Intensity Assessment
- 3.6 Circulating Tumor Cells Value Chain Analysis
- 3.6.1 Upstream – Raw Material/Input Suppliers
- 3.6.1.1 Raw Material/Input 1
- 3.6.1.2 Raw Material/Input 2
- 3.6.1.3 Raw Material/Input 3
- 3.6.2 Midstream – Production/Manufacturing/Service Delivery
- 3.6.2.1 Production/Process Overview
- 3.6.2.2 Key Facility Locations & Capacity by Manufacturer
- 3.6.3 Downstream – Distribution & End Consumer
- 3.6.3.1 Primary Channel – B2B/OEM
- 3.6.3.2 Secondary Channels – Dealer, Retail, Online, Direct
- 3.6.4 Value Chain Profitability Analysis
- 3.6.1 Upstream – Raw Material/Input Suppliers
- 3.7 PESTEL Analysis
- 3.7.1 Political Factors
- 3.7.2 Economic Factors
- 3.7.3 Social Factors
- 3.7.4 Technological Factors
- 3.7.5 Environmental Factors
- 3.7.6 Legal Factors
- 3.8 Circulating Tumor Cells Supply Chain Analysis
- 3.8.1 Raw Material/Input Supply Risk Assessment
- 3.8.2 Manufacturing Concentration Risk (Geographic Exposure)
- 3.8.3 Trade Disruption Impact Analysis
- 3.9 Regulatory & Policy Landscape
Note: The regulatory and policy landscape section covers regulations based on their applicability to the market, Circulating Tumor Cells category, geography, and scope of the study. Only regulatory frameworks with a material impact on operations, compliance, trade, sustainability, or market access are analyzed in detail.
Chapter 4. Key Investment Pockets & Opportunity Analysis
- 4.1 Circulating Tumor Cells Market Attractiveness Analysis
- 4.1.1 By Region – Investment Attractiveness Matrix (Volume × CAGR)
- 4.2 Absolute Revenue Growth Opportunity
- 4.2.1 By Region – Absolute USD Growth Through 2032
- 4.3 Incremental Volume Opportunity
- 4.3.1 By Region – Incremental Volume Through 2032
- 4.3.2 Segment – Incremental Volume
- 4.4 Emerging Submarket Opportunity Deep Dive (Subject to Applicability)
- 4.5 Emerging Market Opportunity Scorecards
- 4.5.1 United States
- 4.5.2 Europe
- 4.5.3 Asia
- 4.5.4 Middle East & Africa
Note: Emerging Market Opportunity Scorecards will be included based on relevance and strategic importance. Regions listed are indicative and may vary depending on data availability and market dynamics.
Chapter 5. Circulating Tumor Cells Import-Export Analysis & Trade Flows
- 5.1 Global Trade Overview
- 5.1.1 Global Export Value by Country (2025)
- 5.1.2 Global Export Volume by Country (2025)
- 5.1.3 Global Import Value by Country (2025)
- 5.1.4 Global Import Volume by Country (2025)
- 5.1.5 Net Trade Balance by Country (2025)
- 5.2 Export Analysis – Segment
- 5.2.1 Type 1 (HS Code)
- 5.2.2 Type 2 (HS Code)
- 5.2.3 Type 3 (HS Code)
- 5.2.4 Type 4 (HS Code)
- 5.2.5 Type 5 (HS Code)
- 5.3 Import Analysis – Segment
- 5.3.1 Type 1 (HS Code)
- 5.3.2 Type 2 (HS Code)
- 5.3.3 Type 3 (HS Code)
- 5.3.4 Type 4 (HS Code)
- 5.3.5 Type 5 (HS Code)
- 5.4 Average Unit Trade Prices
- 5.4.1 Average Export Price – Segment & Country
- 5.4.2 Average Import Price – Segment & Source Country
- 5.4.3 Price Trends (2025)
- 5.5 Key Trade Route Analysis
- 5.5.1 Trade Route 1
- 5.5.2 Trade Route 2
- 5.5.3 Trade Route 3
- 5.5.4 Trade Route 4
- 5.5.5 Trade Route 5
- 5.6 Trade Policy Impact Assessment
- 5.6.1 US Anti-Dumping & Section 301 Tariffs
- 5.6.2 EU Customs Union Impact
- 5.6.3 Major Free Trade Agreements
- 5.6.4 USMCA Rules of Origin
Note: Trade policy analysis will be included only where relevant to the Circulating Tumor Cells market.
Chapter 6. Competitive Landscape & Company Benchmarking
- 6.1 Circulating Tumor Cells Market Concentration & Structure
- 6.1.1 Herfindahl-Hirschman Index (HHI) – vs. 2025
- 6.1.2 Tier 1, Tier 2 & Tier 3 Market Structure
- 6.1.3 Global, Regional & Local Player Dynamics
- 6.2 Circulating Tumor Cells Market Share Analysis – 2025
- 6.2.1 Global Revenue Share by Company
- 6.2.2 Global Volume Share by Company
- 6.2.3 Regional Revenue Share
- 6.2.4 Market Share Evolution ( vs. 2025)
- 6.2.5 OEM Segment Share by Company
- 6.2.6 Replacement Segment Share by Company
- 6.3 Production/Delivery Capacity & Facility Analysis
- 6.3.1 Global Installed Capacity
- 6.3.2 Capacity Utilization Rates
- 6.3.3 Production/Output Volume
- 6.3.4 Facility Locations & Capacity Map
- 6.3.5 Planned Capacity Additions
- 6.4 Circulating Tumor Cells Competitive Benchmarking Matrix
- 6.4.1 Revenue, Volume, CAGR & Profitability Comparison
- 6.4.2 Channel Revenue Mix
- 6.4.3 Geographic Revenue Exposure
- 6.4.4 R&D Intensity
- 6.4.5 Sustainability Maturity
- 6.5 Strategic Developments in Circulating Tumor Cells (Last 24 Months)
- 6.5.1 Mergers, Acquisitions & Divestments
- 6.5.2 New Circulating Tumor Cells Launches
- 6.5.3 Facility Expansions
- 6.5.4 Strategic Alliances, Joint Ventures & Partnerships
- 6.5.5 Distribution Expansion & Market Entry
- 6.5.6 Sustainability & ESG Initiatives
- 6.6 Competitive Strategy Mapping
- 6.6.1 Leader, Challenger, Follower & Niche Classification
- 6.6.2 Pricing Strategy Comparison
- 6.6.3 Channel Strategy Matrix
Note: Strategic developments are included based on their materiality and the availability of reliable information.
Chapter 7. Global Circulating Tumor Cells Market – By Distribution Channel
- 7.1 Segment Overview
- 7.1.1 Volume & Revenue Split by Channel (2025 & 2032)
- 7.1.2 Channel Mix Evolution (2025-2032)
Chapter 8. Regional Market Analysis – Global Overview
- 8.1 Global Regional Overview
- 8.1.1 Regional Volume Share
- 8.1.2 Regional Revenue Share
- 8.1.3 Regional Volume by Region
- 8.1.4 Regional Revenue by Region
- 8.1.5 Regional Forecast Through 2032
- 8.2 Cross-Regional Segment Analysis
- 8.2.1 By Distribution Channel
- 8.2.2 By Brand/Price Tier
Chapter 9. North America Circulating Tumor Cells Market
- 9.1 United States
- 9.2 Canada
- 9.3 Mexico
Chapter 10. Europe Circulating Tumor Cells Market
- 10.1 Germany
- 10.2 France
- 10.3 Italy
- 10.4 United Kingdom
- 10.5 Spain
- 10.6 Poland
- 10.7 Russia
- 10.8 Netherlands
- 10.9 Belgium
- 10.10 Sweden
- 10.11 Denmark
- 10.12 Norway
- 10.13 Rest of Europe
Chapter 11. Asia Pacific Circulating Tumor Cells Market
- 11.1 China
- 11.2 India
- 11.3 Japan
- 11.4 South Korea
- 11.5 Thailand
- 11.6 Indonesia
- 11.7 Vietnam
- 11.8 Malaysia
- 11.9 Australia
- 11.10 Rest of Asia Pacific
Chapter 12. Latin America Circulating Tumor Cells Market
- 12.1 Brazil
- 12.2 Argentina
- 12.3 Colombia
- 12.4 Chile
- 12.5 Rest of Latin America
Chapter 13. Middle East Circulating Tumor Cells Market
- 13.1 Saudi Arabia
- 13.2 United Arab Emirates
- 13.3 Turkey
- 13.4 Israel
- 13.5 Iran
- 13.6 Rest of the Middle East
Chapter 14. Africa Circulating Tumor Cells Market
- 14.1 South Africa
- 14.2 Egypt
- 14.3 Nigeria
- 14.4 Morocco
- 14.5 Rest of Africa
Chapter 15. Circulating Tumor Cells Company Profiles
- 15.1 [Company 01]
- 15.1.1 Company Overview
- 15.1.2 Key Management Personnel
- 15.1.3 Products & Services Portfolio
- 15.1.4 Financial Performance
- 15.1.5 Key Market Focus & Geographic Presence
- 15.1.6 Recent Developments & Strategic Initiatives
Note: The company profile list is preliminary and may change based on research findings, market developments, data availability, and client requirements.
Chapter 16. Appendices
- Appendix A – List of Abbreviations & Acronyms
- Appendix B – Industry Classification Code Reference – Full Series
- Appendix C – Production & Capacity Data Tables
- Appendix D – End-Use & Demand Base Tables
- Appendix E – Consumption & Replacement Rate Assumptions
- Appendix F – ASP Reference Tables
- Appendix G – Manufacturing & Facility Database
- Appendix H – Import-Export Data Tables
- Appendix I – Regulatory Summary Tables
- Appendix J – Primary Research Participant List (Anonymized)
- Appendix K – Primary Research Questionnaire Framework
- Appendix L – Data Sources & Bibliography
- Appendix M – Market Size Divergence & Source Comparison
Chapter 17. Research Methodology
- 17.1 Research Framework & Philosophy
- 17.2 Secondary Research – Sources, Hierarchy & Data Extraction
- 17.3 Data Modeling – Bottom-Up & Top-Down Market Sizing
- 17.4 Primary Research – Stakeholder Framework, LOI & Sample Sizes
- 17.5 Forecast Methodology – Regression, Scenario & Sensitivity Analysis
- 17.6 Quality Control – Four-Layer Validation Framework
- 17.7 Limitations & Standard Assumptions
- 17.8 Disclaimer
