Table of Content
Chapter No. 1 :………. Introduction.. 24
1.1.1. Report Description. 24
Purpose of the Report. 24
USP & Key Offerings. 24
1.1.2. Key Benefits for Stakeholders. 24
1.1.3. Target Audience. 25
1.1.4. Report Scope 25
Chapter No. 2 :………. Executive Summary. 26
2.1. Point-Of-Care Diagnostics Market Snapshot. 26
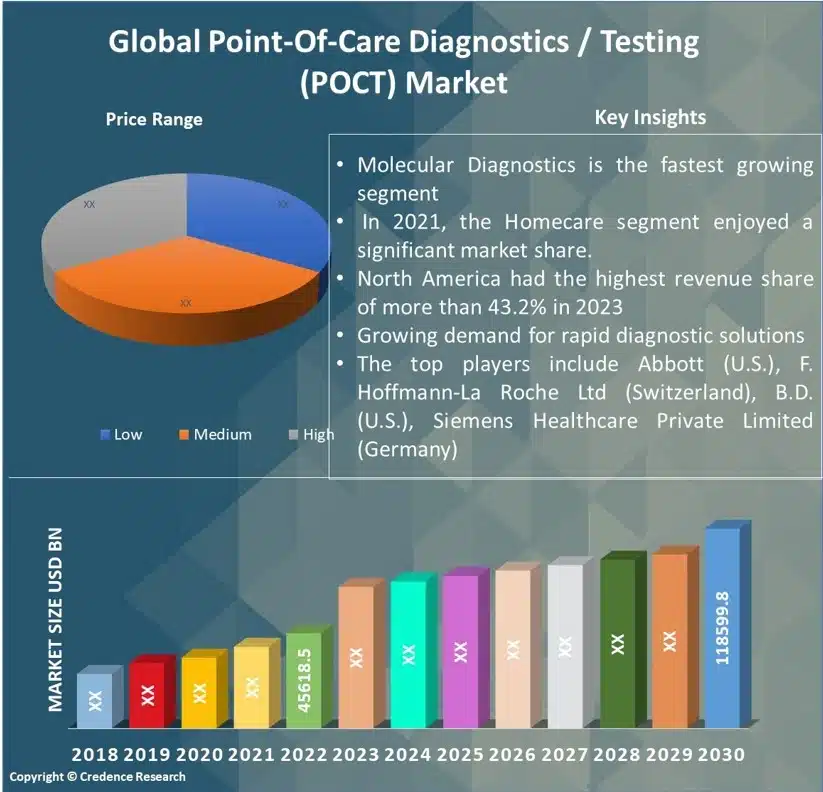
2.1.1. Global Point-Of-Care Diagnostics Market, 2018 – 2032 (USD Million). 28
Chapter No. 3 :………. Geopolitical Crisis Impact Analysis. 29
3.1. Russia-Ukraine and Israel-Palestine War Impacts. 29
Chapter No. 4 :………. Point-Of-Care Diagnostics Market – Industry Analysis. 30
4.1. Introduction 30
4.2. Market Drivers 31
4.2.1. Driving Factor 1 Analysis. 31
4.2.2. Driving Factor 2 Analysis. 32
4.3. Market Restraints. 33
4.3.1. Restraining Factor Analysis. 33
4.4. Market Opportunities. 34
4.4.1. Market Opportunity Analysis. 34
4.5. Porter’s Five Forces Analysis. 35
Chapter No. 5 :………. Analysis Competitive Landscape. 36
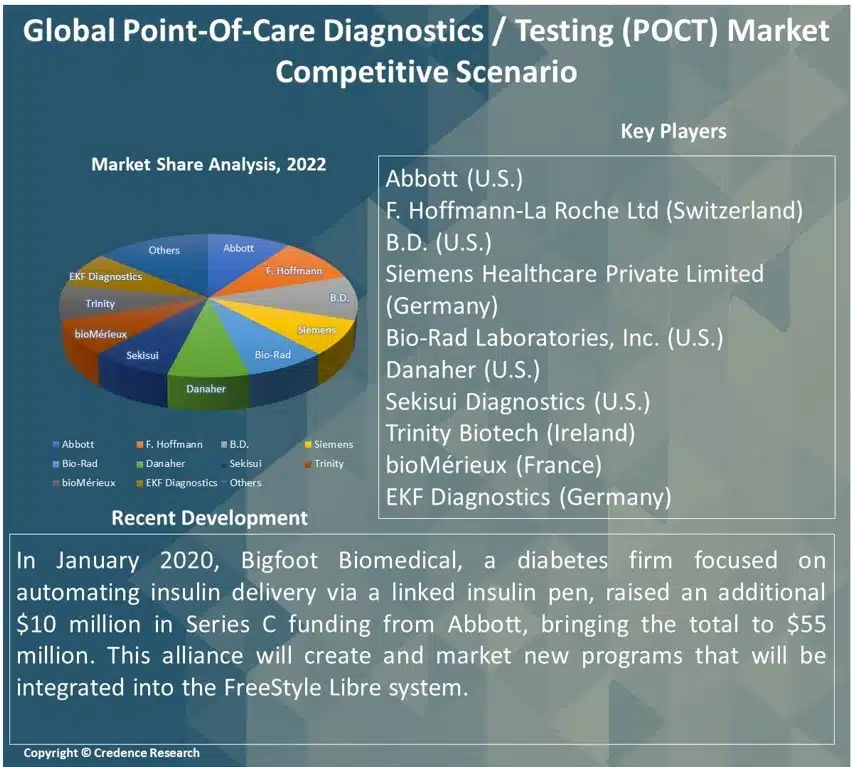
5.1. Company Market Share Analysis – 2023. 36
5.1.1. Global Point-Of-Care Diagnostics Market: Company Market Share, by Volume, 2023. 36
5.1.2. Global Point-Of-Care Diagnostics Market: Company Market Share, by Revenue, 2023. 37
5.1.3. Global Point-Of-Care Diagnostics Market: Top 6 Company Market Share, by Revenue, 2023 37
5.1.4. Global Point-Of-Care Diagnostics Market: Top 3 Company Market Share, by Revenue, 2023 38
5.2. Global Point-Of-Care Diagnostics Market Company Revenue Market Share, 2023. 39
5.3. Company Assessment Metrics, 2023. 40
5.3.1. Stars 40
5.3.2. Emerging Leaders. 40
5.3.3. Pervasive Players. 40
5.3.4. Participants 40
5.4. Start-ups /SMEs Assessment Metrics, 2023. 40
5.4.1. Progressive Companies. 40
5.4.2. Responsive Companies. 40
5.4.3. Dynamic Companies. 40
5.4.4. Starting Blocks 40
5.5. Strategic Developments. 41
5.5.1. Acquisitions & Mergers. 41
New Product Launch. 41
Global Expansion. 41
5.6. Key Players Product Matrix. 42
Chapter No. 6 :………. PESTEL & Adjacent Market Analysis. 43
6.1. PESTEL 43
6.1.1. Political Factors. 43
6.1.2. Economic Factors. 43
6.1.3. Social Factors 43
6.1.4. Technological Factors. 43
6.1.5. Environmental Factors. 43
6.1.6. Legal Factors 43
6.2. Adjacent Market Analysis. 43
Chapter No. 7 :………. Point-Of-Care Diagnostics Market – By Product Segment Analysis 44
7.1. Point-Of-Care Diagnostics Market Overview, by Product Segment. 44
7.1.1. Point-Of-Care Diagnostics Market Revenue Share, By Product, 2023 & 2032. 45
7.1.2. Point-Of-Care Diagnostics Market Attractiveness Analysis, By Product. 46
7.1.3. Incremental Revenue Growth Opportunity, by Product, 2024 – 2032. 46
7.1.4. Point-Of-Care Diagnostics Market Revenue, By Product, 2018, 2023, 2027 & 2032. 47
7.2. COVID-19 test products. 48
7.3. Glucose Monitoring Products. 49
7.4. Cardiometabolic Monitoring Products. 50
7.5. Infectious Disease Testing Products. 51
7.6. Coagulation Monitoring Products. 52
7.7. Pregnancy & Fertility Testing Products. 53
7.8. Tumor/Cancer Marker Testing Products. 53
7.9. Urinalysis Testing Products. 54
7.10. Cholesterol Testing Products. 54
7.11. Hematology Testing Products. 55
7.12. Thyroid Stimulating Hormone (TSH) Testing Products. 55
7.13. Drugs-of-abuse Testing Products. 56
7.14. Fecal Occult Testing Products. 56
7.15. Other POC Products. 57
Chapter No. 8 :………. Point-Of-Care Diagnostics Market – By Platform Segment Analysis 58
8.1. Point-Of-Care Diagnostics Market Overview, by Platform Segment. 58
8.1.1. Point-Of-Care Diagnostics Market Revenue Share, By Platform, 2023 & 2032. 59
8.1.2. Point-Of-Care Diagnostics Market Attractiveness Analysis, By Platform.. 60
8.1.3. Incremental Revenue Growth Opportunity, by Platform, 2024 – 2032. 60
8.1.4. Point-Of-Care Diagnostics Market Revenue, By Platform, 2018, 2023, 2027 & 2032. 61
8.2. Lateral Flow Assays. 62
8.3. Dipsticks 63
8.4. Microfluidics 64
8.5. Molecular Diagnostics. 65
8.6. Immunoassays 66
Chapter No. 9 :………. Point-Of-Care Diagnostics Market – By Mode of Purchase Segment Analysis. 67
9.1. Point-Of-Care Diagnostics Market Overview, by Mode of Purchase Segment. 67
9.1.1. Point-Of-Care Diagnostics Market Revenue Share, By Mode of Purchase, 2023 & 2032. 68
9.1.2. Point-Of-Care Diagnostics Market Attractiveness Analysis, By Mode of Purchase. 69
9.1.3. Incremental Revenue Growth Opportunity, by Mode of Purchase, 2024 – 2032. 69
9.1.4. Point-Of-Care Diagnostics Market Revenue, By Mode of Purchase, 2018, 2023, 2027 & 2032 70
9.2. Prescription-based Products. 71
9.3. OTC Products 72
Chapter No. 10 :…….. Point-Of-Care Diagnostics Market – By Sample Segment Analysis 73
10.1. Point-Of-Care Diagnostics Market Overview, by Sample Segment. 73
10.1.1. Point-Of-Care Diagnostics Market Revenue Share, By Sample, 2023 & 2032. 74
10.1.2. Point-Of-Care Diagnostics Market Attractiveness Analysis, By Sample. 75
10.1.3. Incremental Revenue Growth Opportunity, by Sample, 2024 – 2032. 75
10.1.4. Point-Of-Care Diagnostics Market Revenue, By Sample, 2018, 2023, 2027 & 2032. 76
10.2. Blood Sample 77
10.3. Urine Sample 78
10.4. Nasal and Oropharyngeal Swabs Sample. 79
10.5. Other Samples 80
Chapter No. 11 :…….. Point-Of-Care Diagnostics Market – By End User Segment Analysis 81
11.1. Point-Of-Care Diagnostics Market Overview, by End User Segment. 81
11.1.1. Point-Of-Care Diagnostics Market Revenue Share, By End-User, 2023 & 2032. 82
11.1.2. Point-Of-Care Diagnostics Market Attractiveness Analysis, By End-User. 83
11.1.3. Incremental Revenue Growth Opportunity, by End-User, 2024 – 2032. 83
11.1.4. Point-Of-Care Diagnostics Market Revenue, By End-User, 2018, 2023, 2027 & 2032. 84
11.2. Clinical Laboratories. 85
11.3. Ambulatory Care Facilities and Physician Offices. 86
11.4. Pharmacies, retail clinics, & E-comm. Platforms. 87
11.5. Home Care & Self Testing. 88
11.6. Other End Users. 89
Chapter No. 12 :…….. Point-Of-Care Diagnostics Market – Global Analysis. 90
12.1. Product 90
12.1.1. Global Point-Of-Care Diagnostics Market Revenue, By Product, 2018 – 2023 (USD Million) 90
12.1.2. Global Point-Of-Care Diagnostics Market Revenue, By Product, 2024 – 2032 (USD Million) 90
12.2. Platform 91
12.2.1. Global Point-Of-Care Diagnostics Market Revenue, By Platform, 2018 – 2023 (USD Million) 91
12.2.2. Global Point-Of-Care Diagnostics Market Revenue, By Platform, 2024 – 2032 (USD Million) 91
12.3. Mode of Purchase. 92
12.3.1. Global Point-Of-Care Diagnostics Market Revenue, By Mode of Purchase, 2018 – 2023 (USD Million) 92
12.3.2. Global Point-Of-Care Diagnostics Market Revenue, By Mode of Purchase, 2024 – 2032 (USD Million) 92
12.4. Sample 93
12.4.1. Global Point-Of-Care Diagnostics Market Revenue, By Sample, 2018 – 2023 (USD Million). 93
12.4.2. Global Point-Of-Care Diagnostics Market Revenue, By Sample, 2024 – 2032 (USD Million). 93
12.5. End-User 94
12.5.1. Global Point-Of-Care Diagnostics Market Revenue, By End-User, 2018 – 2023 (USD Million) 94
12.5.2. Global Point-Of-Care Diagnostics Market Revenue, By End-User, 2024 – 2032 (USD Million) 94
Chapter No. 13 :…….. Point-Of-Care Diagnostics Market – North America.. 95
13.1. North America 95
13.1.1. Key Highlights 95
13.1.2. North America Point-Of-Care Diagnostics Market Revenue, By Country, 2018 – 2023 (USD Million) 96
13.1.3. North America Point-Of-Care Diagnostics Market Revenue, By Product, 2018 – 2023 (USD Million) 97
13.1.4. North America Point-Of-Care Diagnostics Market Revenue, By Platform, 2018 – 2023 (USD Million) 98
13.1.5. North America Point-Of-Care Diagnostics Market Revenue, By Mode of Purchase, 2018 – 2023 (USD Million) 99
13.1.6. North America Point-Of-Care Diagnostics Market Revenue, By Sample, 2018 – 2023 (USD Million) 100
13.1.7. North America Point-Of-Care Diagnostics Market Revenue, By End-User, 2018 – 2023 (USD Million) 101
13.2. U.S. 102
13.3. Canada 102
13.4. Mexico 102
Chapter No. 14 :…….. Point-Of-Care Diagnostics Market – Europe. 103
14.1. Europe 103
14.1.1. Key Highlights 103
14.1.2. Europe Point-Of-Care Diagnostics Market Revenue, By Country, 2018 – 2023 (USD Million) 104
14.1.3. Europe Point-Of-Care Diagnostics Market Revenue, By Product, 2018 – 2023 (USD Million) 105
14.1.4. Europe Point-Of-Care Diagnostics Market Revenue, By Platform, 2018 – 2023 (USD Million) 106
14.1.5. Europe Point-Of-Care Diagnostics Market Revenue, By Mode of Purchase, 2018 – 2023 (USD Million) 107
14.1.6. Europe Point-Of-Care Diagnostics Market Revenue, By Sample, 2018 – 2023 (USD Million) 108
14.1.7. Europe Point-Of-Care Diagnostics Market Revenue, By End-User, 2018 – 2023 (USD Million) 109
14.2. UK 110
14.3. France 110
14.4. Germany 110
14.5. Italy 110
14.6. Spain 110
14.7. Russia 110
14.8. Belgium 110
14.9. Netherland 110
14.10. Austria 110
14.11. Sweden 110
14.12. Poland 110
14.13. Denmark 110
14.14. Switzerland 110
14.15. Rest of Europe 110
Chapter No. 15 :…….. Point-Of-Care Diagnostics Market – Asia Pacific. 111
15.1. Asia Pacific 111
15.1.1. Key Highlights 111
15.1.2. Asia Pacific Point-Of-Care Diagnostics Market Revenue, By Country, 2018 – 2023 (USD Million) 112
15.1.3. Asia Pacific Point-Of-Care Diagnostics Market Revenue, By Product, 2018 – 2023 (USD Million) 113
15.1.4. Asia Pacific Point-Of-Care Diagnostics Market Revenue, By Platform, 2018 – 2023 (USD Million) 114
15.1.5. Asia Pacific Point-Of-Care Diagnostics Market Revenue, By Mode of Purchase, 2018 – 2023 (USD Million) 115
15.1.6. Asia Pacific Point-Of-Care Diagnostics Market Revenue, By Sample, 2018 – 2023 (USD Million) 116
15.1.7. Asia Pacific Point-Of-Care Diagnostics Market Revenue, By End-User, 2018 – 2023 (USD Million) 117
15.2. China 118
15.3. Japan 118
15.4. South Korea 118
15.5. India 118
15.6. Australia 118
15.7. Thailand 118
15.8. Indonesia 118
15.9. Vietnam 118
15.10. Malaysia 118
15.11. Philippines 118
15.12. Taiwan 118
15.13. Rest of Asia Pacific. 118
Chapter No. 16 :…….. Point-Of-Care Diagnostics Market – Latin America. 119
16.1. Latin America 119
16.1.1. Key Highlights 119
16.1.2. Latin America Point-Of-Care Diagnostics Market Revenue, By Country, 2018 – 2023 (USD Million) 120
16.1.3. Latin America Point-Of-Care Diagnostics Market Revenue, By Product, 2018 – 2023 (USD Million) 121
16.1.4. Latin America Point-Of-Care Diagnostics Market Revenue, By Platform, 2018 – 2023 (USD Million) 122
16.1.5. Latin America Point-Of-Care Diagnostics Market Revenue, By Mode of Purchase, 2018 – 2023 (USD Million) 123
16.1.6. Latin America Point-Of-Care Diagnostics Market Revenue, By Sample, 2018 – 2023 (USD Million) 124
16.1.7. Latin America Point-Of-Care Diagnostics Market Revenue, By End-User, 2018 – 2023 (USD Million) 125
16.2. Brazil 126
16.3. Argentina 126
16.4. Peru 126
16.5. Chile 126
16.6. Colombia 126
16.7. Rest of Latin America. 126
Chapter No. 17 :…….. Point-Of-Care Diagnostics Market – Middle East. 127
17.1. Middle East 127
17.1.1. Key Highlights 127
17.1.2. Middle East Point-Of-Care Diagnostics Market Revenue, By Country, 2018 – 2023 (USD Million) 128
17.1.3. Middle East Point-Of-Care Diagnostics Market Revenue, By Product, 2018 – 2023 (USD Million) 129
17.1.4. Middle East Point-Of-Care Diagnostics Market Revenue, By Platform, 2018 – 2023 (USD Million) 130
17.1.5. Middle East Point-Of-Care Diagnostics Market Revenue, By Mode of Purchase, 2018 – 2023 (USD Million) 131
17.1.6. Middle East Point-Of-Care Diagnostics Market Revenue, By Sample, 2018 – 2023 (USD Million) 132
17.1.7. Middle East Point-Of-Care Diagnostics Market Revenue, By End-User, 2018 – 2023 (USD Million) 133
17.2. UAE 134
17.3. KSA 134
17.4. Israel 134
17.5. Turkey 134
17.6. Iran 134
17.7. Rest of Middle East. 134
Chapter No. 18 :…….. Point-Of-Care Diagnostics Market – Africa.. 135
18.1. Africa 135
18.1.1. Key Highlights 135
18.1.2. Africa Point-Of-Care Diagnostics Market Revenue, By Country, 2018 – 2023 (USD Million). 136
18.1.3. Africa Point-Of-Care Diagnostics Market Revenue, By Product, 2018 – 2023 (USD Million). 137
18.1.4. Africa Point-Of-Care Diagnostics Market Revenue, By Platform, 2018 – 2023 (USD Million) 138
18.1.5. Africa Point-Of-Care Diagnostics Market Revenue, By Mode of Purchase, 2018 – 2023 (USD Million) 139
18.1.6. Africa Point-Of-Care Diagnostics Market Revenue, By Sample, 2018 – 2023 (USD Million). 140
18.1.7. Africa Point-Of-Care Diagnostics Market Revenue, By End-User, 2018 – 2023 (USD Million) 141
18.2. Egypt 142
18.3. Nigeria 142
18.4. Algeria 142
18.5. Morocco 142
18.6. Rest of Africa 142
Chapter No. 19 :…….. Company Profiles. 143
19.1. F. Hoffmann-La Roche Ltd. 143
19.1.1. Company Overview.. 143
19.1.2. Product Portfolio. 143
19.1.3. Swot Analysis 143
19.1.4. Business Strategy. 144
19.1.5. Financial Overview.. 144
19.2. Qiagen 145
19.3. Danaher Corporation. 145
19.4. Becton Dickinson (BD). 145
19.5. bioMérieux 145
19.6. Abbott 145
19.7. Siemens Healthcare GmbH.. 145
19.8. Werfen 145
19.9. Nova Biomedical 145
19.10. Trividia Health, Inc. 145
19.11. QuidelOrtho Corporation. 145
19.12. Trinity Biotech 145
19.13. Sekisui Diagnostics. 145
19.14. Orasure Technologies, Inc. 145
19.15. Spectral Medical, Inc. 145
19.16. EKF Diagnostics Holdings plc. 145
19.17. Anbio Biotechnology Co., Ltd. 145
19.18. AccuBioTech Co., Ltd. 145
19.19. ALPHA LABORATORIES. 145
Chapter No. 20 :…….. Research Methodology. 146
20.1. Research Methodology. 146
20.1.1. Phase I – Secondary Research. 147
20.1.2. Phase II – Data Modeling. 147
Company Share Analysis Model 148
Revenue Based Modeling. 148
20.1.3. Phase III – Primary Research. 149
20.1.4. Research Limitations. 150
Assumptions. 150
List of Figures
FIG NO. 1………. Global Point-Of-Care Diagnostics Market Revenue, 2018 – 2032 (USD Million) 28
FIG NO. 2………. Porter’s Five Forces Analysis for Global Point-Of-Care Diagnostics Market 35
FIG NO. 3………. Company Share Analysis, 2023. 36
FIG NO. 4………. Company Share Analysis, 2023. 37
FIG NO. 5………. Company Share Analysis, 2023. 37
FIG NO. 6………. Company Share Analysis, 2023. 38
FIG NO. 7………. Point-Of-Care Diagnostics Market – Company Revenue Market Share, 2023. 39
FIG NO. 8………. Point-Of-Care Diagnostics Market Revenue Share, By Product, 2023 & 2032. 45
FIG NO. 9………. Market Attractiveness Analysis, By Product 46
FIG NO. 10……… Incremental Revenue Growth Opportunity by Product, 2024 – 2032. 46
FIG NO. 11……… Point-Of-Care Diagnostics Market Revenue, By Product, 2018, 2023, 2027 & 2032. 47
FIG NO. 12……… Global Point-Of-Care Diagnostics Market for COVID-19 test products, Revenue (USD Million) 2018 – 2032 48
FIG NO. 13……… Global Point-Of-Care Diagnostics Market for Glucose Monitoring Products, Revenue (USD Million) 2018 – 2032. 49
FIG NO. 14……… Global Point-Of-Care Diagnostics Market for Cardiometabolic Monitoring Products, Revenue (USD Million) 2018 – 2032. 50
FIG NO. 15……… Global Point-Of-Care Diagnostics Market for Infectious Disease Testing Products, Revenue (USD Million) 2018 – 2032. 51
FIG NO. 16……… Global Point-Of-Care Diagnostics Market for Coagulation Monitoring Products, Revenue (USD Million) 2018 – 2032. 52
FIG NO. 17……… Global Point-Of-Care Diagnostics Market for Pregnancy & Fertility Testing Products, Revenue (USD Million) 2018 – 2032. 53
FIG NO. 18……… Global Point-Of-Care Diagnostics Market for Tumor/Cancer Marker Testing Products, Revenue (USD Million) 2018 – 2032. 53
FIG NO. 19……… Global Point-Of-Care Diagnostics Market for Urinalysis Testing Products, Revenue (USD Million) 2018 – 2032 54
FIG NO. 20……… Global Point-Of-Care Diagnostics Market for Cholesterol Testing Products, Revenue (USD Million) 2018 – 2032 54
FIG NO. 21……… Global Point-Of-Care Diagnostics Market for Hematology Testing Products, Revenue (USD Million) 2018 – 2032. 55
FIG NO. 22……… Global Point-Of-Care Diagnostics Market for Thyroid Stimulating Hormone (TSH) Testing Products, Revenue (USD Million) 2018 – 2032. 55
FIG NO. 23……… Global Point-Of-Care Diagnostics Market for Drugs-of-abuse Testing Products, Revenue (USD Million) 2018 – 2032. 56
FIG NO. 24……… Global Point-Of-Care Diagnostics Market for Fecal Occult Testing Products, Revenue (USD Million) 2018 – 2032. 56
FIG NO. 25……… Global Point-Of-Care Diagnostics Market for Other POC Products, Revenue (USD Million) 2018 – 2032 57
FIG NO. 26……… Point-Of-Care Diagnostics Market Revenue Share, By Platform, 2023 & 2032. 59
FIG NO. 27……… Market Attractiveness Analysis, By Platform.. 60
FIG NO. 28……… Incremental Revenue Growth Opportunity by Platform, 2024 – 2032. 60
FIG NO. 29……… Point-Of-Care Diagnostics Market Revenue, By Platform, 2018, 2023, 2027 & 2032. 61
FIG NO. 30……… Global Point-Of-Care Diagnostics Market for Lateral Flow Assays, Revenue (USD Million) 2018 – 2032 62
FIG NO. 31……… Global Point-Of-Care Diagnostics Market for Dipsticks , Revenue (USD Million) 2018 – 2032. 63
FIG NO. 32……… Global Point-Of-Care Diagnostics Market for Microfluidics, Revenue (USD Million) 2018 – 2032. 64
FIG NO. 33……… Global Point-Of-Care Diagnostics Market for Molecular Diagnostics, Revenue (USD Million) 2018 – 2032 65
FIG NO. 34……… Global Point-Of-Care Diagnostics Market for Immunoassays, Revenue (USD Million) 2018 – 2032 66
FIG NO. 35……… Point-Of-Care Diagnostics Market Revenue Share, By Mode of Purchase, 2023 & 2032. 68
FIG NO. 36……… Market Attractiveness Analysis, By Mode of Purchase. 69
FIG NO. 37……… Incremental Revenue Growth Opportunity by Mode of Purchase, 2024 – 2032. 69
FIG NO. 38……… Point-Of-Care Diagnostics Market Revenue, By Mode of Purchase, 2018, 2023, 2027 & 2032. 70
FIG NO. 39……… Global Point-Of-Care Diagnostics Market for Prescription-based Products, Revenue (USD Million) 2018 – 2032 71
FIG NO. 40……… Global Point-Of-Care Diagnostics Market for OTC Products, Revenue (USD Million) 2018 – 2032 72
FIG NO. 41……… Point-Of-Care Diagnostics Market Revenue Share, By Sample, 2023 & 2032. 74
FIG NO. 42……… Market Attractiveness Analysis, By Sample. 75
FIG NO. 43……… Incremental Revenue Growth Opportunity by Sample, 2024 – 2032. 75
FIG NO. 44……… Point-Of-Care Diagnostics Market Revenue, By Sample, 2018, 2023, 2027 & 2032. 76
FIG NO. 45……… Global Point-Of-Care Diagnostics Market for Blood Sample, Revenue (USD Million) 2018 – 2032 77
FIG NO. 46……… Global Point-Of-Care Diagnostics Market for Urine Sample, Revenue (USD Million) 2018 – 2032 78
FIG NO. 47……… Global Point-Of-Care Diagnostics Market for Nasal and Oropharyngeal Swabs Sample, Revenue (USD Million) 2018 – 2032. 79
FIG NO. 48……… Global Point-Of-Care Diagnostics Market for Other Samples, Revenue (USD Million) 2018 – 2032 80
FIG NO. 49……… Point-Of-Care Diagnostics Market Revenue Share, By End-User, 2023 & 2032. 82
FIG NO. 50……… Market Attractiveness Analysis, By End-User. 83
FIG NO. 51……… Incremental Revenue Growth Opportunity by End-User, 2024 – 2032. 83
FIG NO. 52……… Point-Of-Care Diagnostics Market Revenue, By End-User, 2018, 2023, 2027 & 2032. 84
FIG NO. 53……… Global Point-Of-Care Diagnostics Market for Clinical Laboratories, Revenue (USD Million) 2018 – 2032 85
FIG NO. 54……… Global Point-Of-Care Diagnostics Market for Ambulatory Care Facilities and Physician Offices, Revenue (USD Million) 2018 – 2032. 86
FIG NO. 55……… Global Point-Of-Care Diagnostics Market for Pharmacies, retail clinics, & E-comm. Platforms, Revenue (USD Million) 2018 – 2032. 87
FIG NO. 56……… Global Point-Of-Care Diagnostics Market for Home Care & Self Testing, Revenue (USD Million) 2018 – 2032 88
FIG NO. 57……… Global Point-Of-Care Diagnostics Market for Other End Users, Revenue (USD Million) 2018 – 2032 89
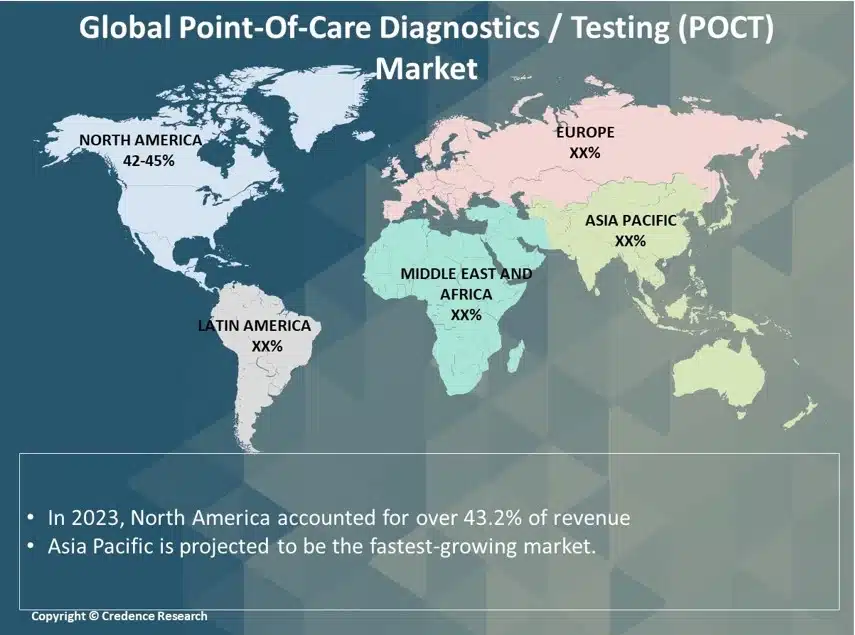
FIG NO. 58……… North America Point-Of-Care Diagnostics Market Revenue, 2018 – 2032 (USD Million) 95
FIG NO. 59……… Europe Point-Of-Care Diagnostics Market Revenue, 2018 – 2032 (USD Million) 103
FIG NO. 60……… Asia Pacific Point-Of-Care Diagnostics Market Revenue, 2018 – 2032 (USD Million) 111
FIG NO. 61……… Latin America Point-Of-Care Diagnostics Market Revenue, 2018 – 2032 (USD Million) 119
FIG NO. 62……… Middle East Point-Of-Care Diagnostics Market Revenue, 2018 – 2032 (USD Million) 127
FIG NO. 63……… Africa Point-Of-Care Diagnostics Market Revenue, 2018 – 2032 (USD Million) 135
FIG NO. 64……… Research Methodology – Detailed View.. 146
FIG NO. 65……… Research Methodology. 147
List of Tables
TABLE NO. 1. :…. Global Point-Of-Care Diagnostics Market: Snapshot 26
TABLE NO. 2. :…. Drivers for the Point-Of-Care Diagnostics Market: Impact Analysis. 31
TABLE NO. 3. :…. Restraints for the Point-Of-Care Diagnostics Market: Impact Analysis. 33
TABLE NO. 4. :…. Global Point-Of-Care Diagnostics Market Revenue, By Product, 2018 – 2023 (USD Million) 90
TABLE NO. 5. :…. Global Point-Of-Care Diagnostics Market Revenue, By Product, 2024 – 2032 (USD Million) 90
TABLE NO. 6. :…. Global Point-Of-Care Diagnostics Market Revenue, By Platform, 2018 – 2023 (USD Million) 91
TABLE NO. 7. :…. Global Point-Of-Care Diagnostics Market Revenue, By Platform, 2024 – 2032 (USD Million) 91
TABLE NO. 8. :…. Global Point-Of-Care Diagnostics Market Revenue, By Mode of Purchase, 2018 – 2023 (USD Million) 92
TABLE NO. 9. :…. Global Point-Of-Care Diagnostics Market Revenue, By Mode of Purchase, 2024 – 2032 (USD Million) 92
TABLE NO. 10. :.. Global Point-Of-Care Diagnostics Market Revenue, By Sample, 2018 – 2023 (USD Million) 93
TABLE NO. 11. :.. Global Point-Of-Care Diagnostics Market Revenue, By Sample, 2024 – 2032 (USD Million) 93
TABLE NO. 12. :.. Global Point-Of-Care Diagnostics Market Revenue, By End-User, 2018 – 2023 (USD Million) 94
TABLE NO. 13. :.. Global Point-Of-Care Diagnostics Market Revenue, By End-User, 2024 – 2032 (USD Million) 94
TABLE NO. 14. :.. North America Point-Of-Care Diagnostics Market Revenue, By Country, 2018 – 2023 (USD Million) 96
TABLE NO. 15. :.. North America Point-Of-Care Diagnostics Market Revenue, By Country, 2024 – 2032 (USD Million) 96
TABLE NO. 16. :.. North America Point-Of-Care Diagnostics Market Revenue, By Product, 2018 – 2023 (USD Million) 97
TABLE NO. 17. :.. North America Point-Of-Care Diagnostics Market Revenue, By Product, 2024 – 2032 (USD Million) 97
TABLE NO. 18. :.. North America Point-Of-Care Diagnostics Market Revenue, By Platform, 2018 – 2023 (USD Million) 98
TABLE NO. 19. :.. North America Point-Of-Care Diagnostics Market Revenue, By Platform, 2024 – 2032 (USD Million) 98
TABLE NO. 20. :.. North America Point-Of-Care Diagnostics Market Revenue, By Mode of Purchase, 2018 – 2023 (USD Million) 99
TABLE NO. 21. :.. North America Point-Of-Care Diagnostics Market Revenue, By Mode of Purchase, 2024 – 2032 (USD Million) 99
TABLE NO. 22. :.. North America Point-Of-Care Diagnostics Market Revenue, By Sample, 2018 – 2023 (USD Million) 100
TABLE NO. 23. :.. North America Point-Of-Care Diagnostics Market Revenue, By Sample, 2024 – 2032 (USD Million) 100
TABLE NO. 24. :.. North America Point-Of-Care Diagnostics Market Revenue, By End-User, 2018 – 2023 (USD Million) 101
TABLE NO. 25. :.. North America Point-Of-Care Diagnostics Market Revenue, By End-User, 2024 – 2032 (USD Million) 101
TABLE NO. 26. :.. Europe Point-Of-Care Diagnostics Market Revenue, By Country, 2018 – 2023 (USD Million) 104
TABLE NO. 27. :.. Europe Point-Of-Care Diagnostics Market Revenue, By Country, 2024 – 2032 (USD Million) 104
TABLE NO. 28. :.. Europe Point-Of-Care Diagnostics Market Revenue, By Product, 2018 – 2023 (USD Million) 105
TABLE NO. 29. :.. Europe Point-Of-Care Diagnostics Market Revenue, By Product, 2024 – 2032 (USD Million) 105
TABLE NO. 30. :.. Europe Point-Of-Care Diagnostics Market Revenue, By Platform, 2018 – 2023 (USD Million) 106
TABLE NO. 31. :.. Europe Point-Of-Care Diagnostics Market Revenue, By Platform, 2024 – 2032 (USD Million) 106
TABLE NO. 32. :.. Europe Point-Of-Care Diagnostics Market Revenue, By Mode of Purchase, 2018 – 2023 (USD Million) 107
TABLE NO. 33. :.. Europe Point-Of-Care Diagnostics Market Revenue, By Mode of Purchase, 2024 – 2032 (USD Million) 107
TABLE NO. 34. :.. Europe Point-Of-Care Diagnostics Market Revenue, By Sample, 2018 – 2023 (USD Million) 108
TABLE NO. 35. :.. Europe Point-Of-Care Diagnostics Market Revenue, By Sample, 2024 – 2032 (USD Million) 108
TABLE NO. 36. :.. Europe Point-Of-Care Diagnostics Market Revenue, By End-User, 2018 – 2023 (USD Million) 109
TABLE NO. 37. :.. Europe Point-Of-Care Diagnostics Market Revenue, By End-User, 2024 – 2032 (USD Million) 109
TABLE NO. 38. :.. Asia Pacific Point-Of-Care Diagnostics Market Revenue, By Country, 2018 – 2023 (USD Million) 112
TABLE NO. 39. :.. Asia Pacific Point-Of-Care Diagnostics Market Revenue, By Country, 2024 – 2032 (USD Million) 112
TABLE NO. 40. :.. Asia Pacific Point-Of-Care Diagnostics Market Revenue, By Product, 2018 – 2023 (USD Million) 113
TABLE NO. 41. :.. Asia Pacific Point-Of-Care Diagnostics Market Revenue, By Product, 2024 – 2032 (USD Million) 113
TABLE NO. 42. :.. Asia Pacific Point-Of-Care Diagnostics Market Revenue, By Platform, 2018 – 2023 (USD Million) 114
TABLE NO. 43. :.. Asia Pacific Point-Of-Care Diagnostics Market Revenue, By Platform, 2024 – 2032 (USD Million) 114
TABLE NO. 44. :.. Asia Pacific Point-Of-Care Diagnostics Market Revenue, By Mode of Purchase, 2018 – 2023 (USD Million) 115
TABLE NO. 45. :.. Asia Pacific Point-Of-Care Diagnostics Market Revenue, By Mode of Purchase, 2024 – 2032 (USD Million) 115
TABLE NO. 46. :.. Asia Pacific Point-Of-Care Diagnostics Market Revenue, By Sample, 2018 – 2023 (USD Million) 116
TABLE NO. 47. :.. Asia Pacific Point-Of-Care Diagnostics Market Revenue, By Sample, 2024 – 2032 (USD Million) 116
TABLE NO. 48. :.. Asia Pacific Point-Of-Care Diagnostics Market Revenue, By End-User, 2018 – 2023 (USD Million) 117
TABLE NO. 49. :.. Asia Pacific Point-Of-Care Diagnostics Market Revenue, By End-User, 2024 – 2032 (USD Million) 117
TABLE NO. 50. :.. Latin America Point-Of-Care Diagnostics Market Revenue, By Country, 2018 – 2023 (USD Million) 120
TABLE NO. 51. :.. Latin America Point-Of-Care Diagnostics Market Revenue, By Country, 2024 – 2032 (USD Million) 120
TABLE NO. 52. :.. Latin America Point-Of-Care Diagnostics Market Revenue, By Product, 2018 – 2023 (USD Million) 121
TABLE NO. 53. :.. Latin America Point-Of-Care Diagnostics Market Revenue, By Product, 2024 – 2032 (USD Million) 121
TABLE NO. 54. :.. Latin America Point-Of-Care Diagnostics Market Revenue, By Platform, 2018 – 2023 (USD Million) 122
TABLE NO. 55. :.. Latin America Point-Of-Care Diagnostics Market Revenue, By Platform, 2024 – 2032 (USD Million) 122
TABLE NO. 56. :.. Latin America Point-Of-Care Diagnostics Market Revenue, By Mode of Purchase, 2018 – 2023 (USD Million) 123
TABLE NO. 57. :.. Latin America Point-Of-Care Diagnostics Market Revenue, By Mode of Purchase, 2024 – 2032 (USD Million) 123
TABLE NO. 58. :.. Latin America Point-Of-Care Diagnostics Market Revenue, By Sample, 2018 – 2023 (USD Million) 124
TABLE NO. 59. :.. Latin America Point-Of-Care Diagnostics Market Revenue, By Sample, 2024 – 2032 (USD Million) 124
TABLE NO. 60. :.. Latin America Point-Of-Care Diagnostics Market Revenue, By End-User, 2018 – 2023 (USD Million) 125
TABLE NO. 61. :.. Latin America Point-Of-Care Diagnostics Market Revenue, By End-User, 2024 – 2032 (USD Million) 125
TABLE NO. 62. :.. Middle East Point-Of-Care Diagnostics Market Revenue, By Country, 2018 – 2023 (USD Million) 128
TABLE NO. 63. :.. Middle East Point-Of-Care Diagnostics Market Revenue, By Country, 2024 – 2032 (USD Million) 128
TABLE NO. 64. :.. Middle East Point-Of-Care Diagnostics Market Revenue, By Product, 2018 – 2023 (USD Million) 129
TABLE NO. 65. :.. Middle East Point-Of-Care Diagnostics Market Revenue, By Product, 2024 – 2032 (USD Million) 129
TABLE NO. 66. :.. Middle East Point-Of-Care Diagnostics Market Revenue, By Platform, 2018 – 2023 (USD Million) 130
TABLE NO. 67. :.. Middle East Point-Of-Care Diagnostics Market Revenue, By Platform, 2024 – 2032 (USD Million) 130
TABLE NO. 68. :.. Middle East Point-Of-Care Diagnostics Market Revenue, By Mode of Purchase, 2018 – 2023 (USD Million) 131
TABLE NO. 69. :.. Middle East Point-Of-Care Diagnostics Market Revenue, By Mode of Purchase, 2024 – 2032 (USD Million) 131
TABLE NO. 70. :.. Middle East Point-Of-Care Diagnostics Market Revenue, By Sample, 2018 – 2023 (USD Million) 132
TABLE NO. 71. :.. Middle East Point-Of-Care Diagnostics Market Revenue, By Sample, 2024 – 2032 (USD Million) 132
TABLE NO. 72. :.. Middle East Point-Of-Care Diagnostics Market Revenue, By End-User, 2018 – 2023 (USD Million) 133
TABLE NO. 73. :.. Middle East Point-Of-Care Diagnostics Market Revenue, By End-User, 2024 – 2032 (USD Million) 133
TABLE NO. 74. :.. Africa Point-Of-Care Diagnostics Market Revenue, By Country, 2018 – 2023 (USD Million) 136
TABLE NO. 75. :.. Africa Point-Of-Care Diagnostics Market Revenue, By Country, 2024 – 2032 (USD Million) 136
TABLE NO. 76. :.. Africa Point-Of-Care Diagnostics Market Revenue, By Product, 2018 – 2023 (USD Million) 137
TABLE NO. 77. :.. Africa Point-Of-Care Diagnostics Market Revenue, By Product, 2024 – 2032 (USD Million) 137
TABLE NO. 78. :.. Africa Point-Of-Care Diagnostics Market Revenue, By Platform, 2018 – 2023 (USD Million) 138
TABLE NO. 79. :.. Africa Point-Of-Care Diagnostics Market Revenue, By Platform, 2024 – 2032 (USD Million) 138
TABLE NO. 80. :.. Africa Point-Of-Care Diagnostics Market Revenue, By Mode of Purchase, 2018 – 2023 (USD Million) 139
TABLE NO. 81. :.. Africa Point-Of-Care Diagnostics Market Revenue, By Mode of Purchase, 2024 – 2032 (USD Million) 139
TABLE NO. 82. :.. Africa Point-Of-Care Diagnostics Market Revenue, By Sample, 2018 – 2023 (USD Million) 140
TABLE NO. 83. :.. Africa Point-Of-Care Diagnostics Market Revenue, By Sample, 2024 – 2032 (USD Million) 140
TABLE NO. 84. :.. Africa Point-Of-Care Diagnostics Market Revenue, By End-User, 2018 – 2023 (USD Million) 141
TABLE NO. 85. :.. Africa Point-Of-Care Diagnostics Market Revenue, By End-User, 2024 – 2032 (USD Million) 141