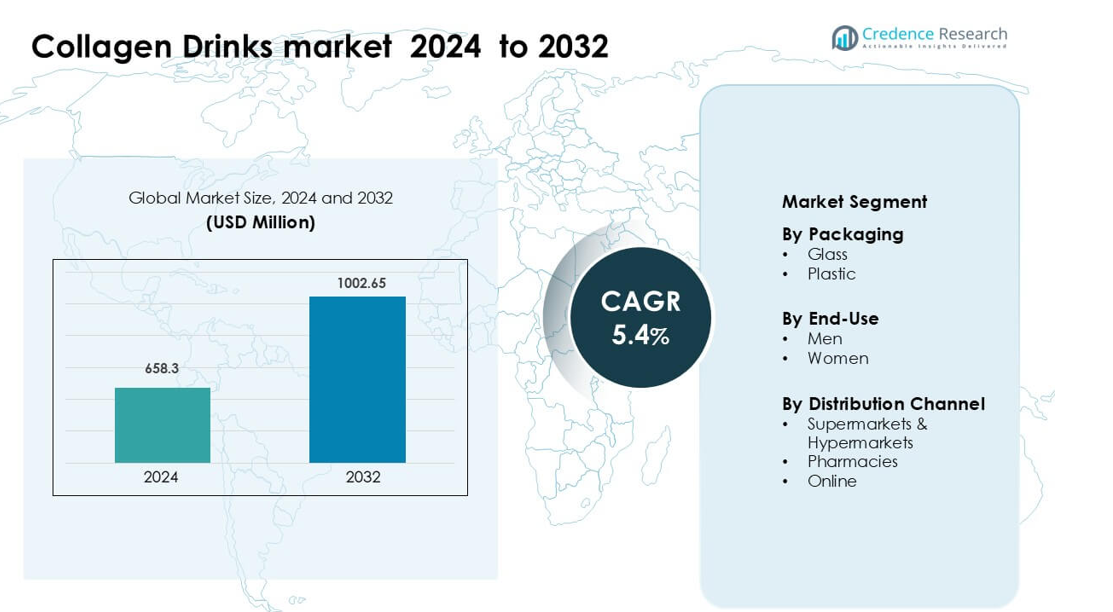
Home » Healthcare » Collagen Drinks Market

Collagen Drinks Market By End User (Male, Female) By Packaging Type (Glass Bottle, Plastic Bottle)-Growth, Future Prospects & Competitive Analysis, 2016 – 2030

Price: $4999

Published: | Report ID: 18815 | Report Format : PDF

Key Highlights of the Report

The global Collagen Drinks market is segmented by end-user, packaging type, distribution channel, and region.  Female category is the most popular form end-user segment, while plastic bottle is the packaging type segment. Pharmacies are the most common distribution channel segment, with North America leading the market growth.

The global Collagen Drinks market has several drivers, including a growing emphasis on health and wellness, a focus on maintaining youthful appearances & growing awareness of age-related concerns, such as wrinkles, joint stiffness, and loss of skin elasticity. However, the market also faces significant challenges; pricing of collagen drinks can be a barrier for certain consumer segments & increasing demand for collagen ensures sustainable and ethical sourcing practices becomes crucial.

Nonetheless, the global Collagen Drinks Market offers significant growth opportunities, including consumers increasingly seeking natural and functional beverages that offer health benefits beyond mere hydration & increasing consumer awareness and education.

Market Overview

The global Collagen Drinks Market has witnessed steady growth in recent years and is expected to continue growing at a CAGR of 13.20% between 2023 and 2030. The market was valued at USD 0.3 billion in 2022 and is expected to reach USD 0.714572408 billion in 2030.

What Are the Main Drivers of The Global Collagen Drinks Market?

The global Collagen Drinks Market is driven by several factors, including Rising emphasis on health and wellness, as well as a focus on maintaining youthful appearances & growing awareness of age-related concerns, such as wrinkles, joint stiffness, and loss of skin elasticity.

Design Element 2

Access crucial information at unmatched prices!

Request your free sample report today & start making informed decisions powered by Credence Research!

Download Free Sample
CTA Design Element 3

What Are the Major Challenges Faced by The Global Collagen Drinks Market?

The global Collagen Drinks Market also faces several challenges, including pricing of collagen drinks can be a barrier for certain consumer segments & increasing demand for collagen, ensuring sustainable and ethical sourcing practices becomes crucial.

What Are the Growth Opportunities in The Global Collagen Drinks Market?

The global Collagen Drinks Market offers significant growth opportunities, including consumers are increasingly seeking natural and functional beverages that offer health benefits beyond mere hydration & increasing consumer awareness and education.

Executive Summary

Overview of the Global Collagen Drinks Market

The global Collagen Drinks Market has been steadily growing in recent years, driven by convenient ways to consume collagen without the need for additional supplements or complex skincare regimens. The market is characterized by a wide range of materials, designs, and sizes, catering to diverse consumer preferences.

Collagen Drinks Market

Market Definition

The collagen drinks market is known as the segment of the beverage industry that focuses on the production, marketing, and sale of drinks fortified with collagen. Consuming collagen, a protein found in the body that maintains the health of the skin, hair, nails, and joints, is made more convenient and enjoyable for consumers by the formulation of collagen drinks. Collagen peptides, which are frequently found in these beverages and are thought to have prospective advantages like enhancing skin elasticity, enhancing joint function, and boosting general wellbeing. Targeting those looking for answers for their beauty and wellness, the market includes a wide variety of goods, tastes, and formulations.

Market Insights

  • The global demand for Collagen Drinks was valued at USD 0.3 Billion in 2022 and is expected to reach USD 0.71 Billion in 2030, growing at a CAGR of 13.20% between 2023 and 2030.
  • Female is the leading segment by End User and held over two-thirds share in terms of value in 2022, while the Male segment is likely to exhibit the fastest CAGR during the forecast period.
  • The Plastic bottle packaging type segment governs the demand for Collagen Drinks globally, holding a massive share of nearly three-fifths in 2022, and is expected to grow at a rapid CAGR.
  • The Pharmacies distribution channel segment is expected to post the highest CAGR during the forecast period, while dairy products & pharmaceuticals are leading the market share with over 32% share in 2022.
  • North America is fuelling the growth of the Collagen Drinks industry with over 42% share in 2022, while Asia Pacific and Europe collectively account for just a two-third share in 2022. Europe held over 22% share in 2022.
  • The market is primarily driven by growing emphasis on health and wellness, as well as a focus on maintaining youthful appearances & growing awareness of age-related concerns, such as wrinkles, joint stiffness, and loss of skin elasticity & need for more scientific research to establish concrete evidence regarding their efficacy & competition from other beauty and health supplements targeting similar benefits are the main restraints.
  • consumers are increasingly seeking natural and functional beverages that offer health benefits beyond mere hydration & increasing consumer awareness and education are the major opportunities in the market.

Segmentation by End User

  • Female is the leading segment by foam type and held over two-thirds share in terms of value in 2022.
  • The Male segment will likely exhibit the fastest CAGR during the forecast period.

Segmentation by Packaging Type

  • The Plastic Bottle segment governs the demand for Collagen Drinks globally, holding a massive share of nearly three-fifths in 2022, and is also expected to grow at a rapid CAGR.
  • Glass Bottle segment contributes to the rest of the demand for the Collagen Drinks industry.

Segmentation by Distribution Channel       

  • Pharmacies are expected to post the highest CAGR during the forecast period.
  • The Online Sales Channel segment is leading the market share with over 32% share in 2022.

Segmentation by Region

  • North America is fuelling the growth of the Collagen Drinks industry with a 42% share in 2022.
  • Asia-Pacific and Europe collectively account for a two-thirds share in 2022, with Europe holding over 22% share in the same year.
  • The rest of the World, including Latin America, The Middle East, and Africa, contributes the remainder to the demand for Collagen Drinks industry.

The growing emphasis on health and wellness, as well as a focus on maintaining youthful appearances & growing awareness of age-related concerns, such as wrinkles, joint stiffness, and loss of skin elasticity to the drive of the market. However, the market needs to be more restrained by the need for more scientific research to establish concrete evidence regarding their efficacy & competition from other beauty and health supplements targeting similar benefits.

Germany has a robust consumer market for wellness and beauty products, with people demonstrating a greater interest in preserving their youthful looks and general well-being. The protein collagen has attracted a lot of interest in the beauty and wellness sectors due to its advantages in increasing skin elasticity and joint health. For consumers wishing to add collagen to their daily regimens, collagen drinks are a practical and alluring choice. It has a growing population that is becoming rising health-conscious. As people age, concerns related to skin aging, wrinkles, joint stiffness, and overall vitality become more prominent.

Japan has a major emphasis on preventive healthcare and overall wellness. In Japan, the idea of “beauty from within” permeates every aspect of life. By offering a comprehensive approach to health and beauty, collagen drinks fit well with this wellness culture. Products that provide both exterior and interior benefits are more likely to be chosen by Japanese consumers. Collagen drinks appeal to the wellness-conscious mindset of Japanese customers by having the ability to improve skin, hair, nails, and joint health. Additionally, Japan has one of the oldest populations in the world, with a sizable percentage of elderly people. Concerns about skin aging, joint stiffness, and general health grow more prevalent as people age.

Health and Beauty Trends

There has been an increasing focus on health & wellness, as well as an emphasis on maintaining youthful appearances. Collagen, a protein that is present in the body and maintains skin elasticity and joint health, has come under scrutiny for its potential advantages in fostering healthy skin, hair, nails, and joints in general. For customers wishing to add collagen to their daily regimens, collagen drinks have emerged as a practical and alluring solution.

The popularity of collagen drinks has significantly increased in Japan in recent years. One well-known illustration is the company “Shiseido The Collagen.” In response to the growing demand for collagen-based products, well-known Japanese beauty brand Shiseido unveiled a line of collagen drinks.

Aging Population

A growing number of people are becoming aware of age-related issues like wrinkles, joint stiffness, and loss of skin elasticity as the world’s population ages. A growing number of older people are turning to collagen drinks as a way to combat these problems and improve their general wellbeing. Furthermore, the development of collagen drinks for older demographics has been supported by scientific research and endorsements from medical professionals. According to studies, collagen supplements can increase skin suppleness, lessen wrinkle depth, and ease joint stiffness.

Lack of Scientific Evidence

Even while collagen drinks have grown in popularity due to their potential advantages, more scientific investigation is still required to provide conclusive proof of their effectiveness. According to certain research, collagen supplements used orally may have a restricted amount of absorption and effectiveness. Consumers and healthcare professionals may be skeptical due to the dearth of reliable clinical trials and standardized testing procedures.

Furthermore, the significance of assertions supported by evidence is becoming more and more apparent to regulatory bodies and health organizations. For instance, the European Food Safety Authority (EFSA) has established standards for health claims relating to collagen, requiring scientific support before marketing claims can be made.

Rising Demand for Natural and Functional Beverages

Natural and useful beverages that provide health advantages beyond hydration are becoming more and more popular with consumers. This trend is supported by collagen beverages because they offer a practical and enjoyable way to take collagen peptides, which are thought to improve joint health, skin health, and general wellbeing. Manufacturers of collagen drinks now have numerous options to reach a wider consumer base thanks to the increasing demand for such beverages.

Competitive Landscape

Key Players

The global Collagen Drinks Market is highly competitive, with the presence of several key players. Some of the major players in the market and their market share are as follows:

  • Bauer Nutrition
  • ATP CO. LTD
  • TCI Co, Ltd
  • SHISEIDO COMPANY, LIMITED
  • AMORE PACIFIC CORPORATION
  • Hangzhou Nutrition Biotechnology Co,
  • Asterism Healthcare
  • WEL-BLOOM BIO-TECH CORPORATION

These companies focus on product innovation, expanding their distribution channels, and mergers and acquisitions to stay ahead in the market.

The major players in the global Collagen Drinks Market are constantly striving to stay ahead by introducing new products and innovations.

In 2020, German company Black Labels Co’s launched a three-strong line of collagen protein drinks. Growing consumer concern regarding health and wellbeing has increased the focus on reducing sugar consumption.

Summary of Key Findings

  • Rising emphasis on health and wellness, as well as a focus on maintaining youthful appearances & growing awareness of age-related concerns, such as wrinkles, joint stiffness, and loss of skin elasticity are driving market growth
  • Market segment by End User, Packaging Type, Distribution Channel, and region.
  • Female is the most popular, with Plastic Bottle as the primary packaging system segment.
  • Pharmacies are the most Distribution Channel segment.
  • North America is leading market growth; the market is highly competitive with key players including Bauer Nutrition, ATP CO. LTD, TCI Co, Ltd, SHISEIDO COMPANY, LIMITED, AMORE PACIFIC CORPORATION, Kinohimitsu, Hangzhou Nutrition Biotechnology Co.,

Shape Your Report to Specific Countries or Regions & Enjoy 30% Off!

Future Outlook

  • Positive outlook for the global Collagen Drinks market with significant growth potential in the North America region.
  • Increased emphasis on health and wellness, as well as a focus on maintaining youthful appearances & growing awareness of age-related concerns, such as wrinkles, joint stiffness, and loss of skin elasticity, is the major driver behind the market.
  • Challenges like the pricing of collagen drinks can be a barrier for certain consumer segments & increasing demand for collagen, ensuring sustainable and ethical sourcing practices becomes crucial.
  • Key players to focus on product innovation, expanding market reach, and maintaining competitive pricing to stay ahead in the market.

Segmentation

  • By End User
    • Male
    • Female
  • By Packaging Type
    • Glass Bottle
    • Plastic Bottle
  • By Distribution Channel    
    • Supermarkets/Hypermarkets
    • Pharmacies
    • Online Sales Channel
    • Others
  • By Region
  • North America
    • The US.
    • Canada
    • Mexico
  • Europe
    • Germany
    • France
    • The U.K.
    • Italy
    • Spain
    • Rest of Europe
  • Asia Pacific
    • China
    • Japan
    • India
    • South Korea
    • South-east Asia
    • Rest of Asia Pacific
  • Latin America
    • Brazil
    • Argentina
    • Rest of Latin America
  • Middle East & Africa
    • GCC Countries
    • South Africa
    • Rest of the Middle East and Africa

1. Preface
1.1. Report Description
1.1.1. Purpose of the Report
1.1.2. Target Audience
1.1.3. USP and Key Offerings
1.2. Research Scope
1.3. Research Methodology
1.3.1. Phase I – Secondary Research
1.3.2. Phase II – Data Modelling
1.3.2.1. Company Share Analysis Model
1.3.2.2. Revenue Based Modelling
1.3.3. Phase III – Primary Research
1.3.4. Research Limitations
1.3.5. Assumptions
1.4. Market Introduction
1.5. Market Research Scope

2. Executive Summary
2.1. Market Snapshot: Global Machine Control System Market
2.2. Global Machine Control System Market, By End User
2.3. Global Machine Control System Market, By Packaging Type
2.4. Global Machine Control System Market, By Distribution Channel
2.5. Global Machine Control System Market, By Region

3. Market Dynamics & Factors Analysis
3.1. Introduction
3.1.1. Global Machine Control System Market Value, 2017-2030, (US$ Bn)
3.1.2. Y-o-Y Growth Trend Analysis
3.2. Market Dynamics
3.2.1. Market Drivers
3.2.2. Market Restraints
3.2.3. Market Opportunities
3.2.4. Major Industry Challenges
3.3. Growth and Development Patterns
3.4. Investment Feasibility Analysis
3.5. Market Opportunity Analysis
3.5.1. End User
3.5.2. Packaging Type
3.5.3. Distribution Channel
3.5.4. Geography

4. Premium Insights
4.1. STAR (Situation, Task, Action, Results) Analysis
4.2. Porter’s Five Forces Analysis
4.2.1. Threat of New Entrants
4.2.2. Bargaining Power of Buyers/Consumers
4.2.3. Bargaining Power of Suppliers
4.2.4. Threat of Substitute types
4.2.5. Intensity of Competitive Rivalry
4.3. Key Market Trends
4.3.1. Demand Side Trends
4.3.2. Supply Side Trends
4.4. Value Chain Analysis
4.5. Technology Analysis
4.6. Analysis and Recommendations
4.7. Marketing Strategy Analysis
4.7.1. Direct Marketing
4.7.2. Indirect Marketing
4.7.3. Marketing Channel Development Trend

5. Market Positioning of Key Players, 2022
5.1. Company market share of key players, 2022
5.2. Competitive Benchmarking
5.3. Market Positioning of Key Vendors
5.4. Geographical Presence Analysis
5.5. Major Strategies Adopted by Key Players
5.5.1. Key Strategies Analysis
5.5.2. Mergers and Acquisitions
5.5.3. Partnerships
5.5.4. Product Launch
5.5.5. Geographical Expansion
5.5.6. Others

6. Economic Impact Analysis
6.1. Recession Impact
6.1.1. North America
6.1.2. Europe
6.1.3. Asia Pacific
6.1.4. Latin America
6.1.5. Middle East and Africa
6.2. Ukraine-Russia War Impact
6.2.1. North America
6.2.2. Europe
6.2.3. Asia Pacific
6.2.4. Latin America
6.2.5. Middle East and Africa
6.3. COVID-19 Impact Analysis
6.3.1. North America
6.3.2. Europe
6.3.3. Asia Pacific
6.3.4. Latin America
6.3.5. Middle East and Africa

7. Global Machine Control System Market, By End User
7.1. Global Machine Control System Market Overview, by End User
7.1.1. Global Machine Control System Market Revenue Share, By End User, 2022 Vs 2030 (in %)
7.2. Male
7.2.1. Global Machine Control System Market, By Region, 2017-2030 (US$ Bn)
7.3. Female
7.3.1. Global Machine Control System Market, By Region, 2017-2030 (US$ Bn)

8. Global Machine Control System Market, by Packaging Type, 2017-2030 (US$ Bn)
8.1. Global Machine Control System Market Overview, by Packaging Type
8.1.1. Global Machine Control System Market, By Packaging Type, 2022 vs 2030 (in%)
8.2. Glass Bottle
8.2.1. Global Machine Control System Market, By Region, 2017-2030 (US$ Bn)
8.3. Plastic Bottle
8.3.1. Global Machine Control System Market, By Region, 2017-2030 (US$ Bn)

9. Global Machine Control System Market, By Distribution Channel
9.1. Global Machine Control System Market Overview, by Distribution Channel
9.1.1. Global Machine Control System Market, By Distribution Channel, 2022 vs 2030 (in %)
9.2. Supermarkets/Hypermarkets
9.2.1. Global Machine Control System Market, By Region, 2017-2030 (US$ Bn)
9.3. Pharmacies
9.3.1. Global Machine Control System Market, By Region, 2017-2030 (US$ Bn)
9.4. Online Sales Channel
9.4.1. Global Machine Control System Market, By Region, 2017-2030 (US$ Bn)
9.5. Others
9.5.1. Global Machine Control System Market, By Region, 2017-2030 (US$ Bn)

10. Global Machine Control System Market, By Region
10.1. Global Machine Control System Market Overview, by Region
10.1.1. Global Machine Control System Market, By Region, 2022 vs 2030 (in%)
10.2. End User
10.2.1. Global Machine Control System Market, By End User, 2017-2030 (US$ Bn)
10.3. Packaging Type
10.3.1. Global Machine Control System Market, By Packaging Type, 2017-2030 (US$ Bn)
10.4. Distribution Channel
10.4.1. Global Machine Control System Market, By Distribution Channel, 2017-2030 (US$ Bn)

11. North America Machine Control System Market Analysis
11.1. North America Machine Control System Market, by End User, 2017-2030(US$ Bn)
11.1.1. Overview
11.1.2. SRC Analysis
11.2. North America Machine Control System Market, by Packaging Type, 2017-2030(US$ Bn)
11.2.1. Overview
11.2.2. SRC Analysis
11.3. North America Machine Control System Market, by Distribution Channel, 2017-2030(US$ Bn)
11.3.1. Overview
11.3.2. SRC Analysis
11.4. North America Machine Control System Market, by Country, 2017-2030 (US$ Bn)
11.4.1. North America Machine Control System Market, by Country, 2022 Vs 2030 (in%)
11.4.2. U.S.
11.4.2.1. U.S. Machine Control System Market Estimates and Forecast, 2017-2030 (US$ Bn)
11.4.2.2. U.S. Machine Control System, By End User, 2017-2030 (US$ Bn)
11.4.2.3. U.S. Machine Control System, By Packaging Type, 2017-2030 (US$ Bn)
11.4.2.4. U.S. Machine Control System, By Distribution Channel, 2017-2030 (US$ Bn)
11.4.3. Canada
11.4.3.1. Canada Machine Control System Market Estimates and Forecast, 2017-2030 (US$ Bn)
11.4.3.2. Canada Machine Control System, By End User, 2017-2030 (US$ Bn)
11.4.3.3. Canada Machine Control System, By Packaging Type, 2017-2030 (US$ Bn)
11.4.3.4. Canada Machine Control System, By Distribution Channel, 2017-2030 (US$ Bn)
11.4.4. Mexico
11.4.4.1. Mexico Machine Control System Market Estimates and Forecast, 2017-2030 (US$ Bn)
11.4.4.2. Mexico Machine Control System, By End User, 2017-2030 (US$ Bn)
11.4.4.3. Mexico Machine Control System, By Packaging Type, 2017-2030 (US$ Bn)
11.4.4.4. Mexico Machine Control System, By Distribution Channel, 2017-2030 (US$ Bn)

12. Europe Machine Control System Market Analysis
12.1. Europe Machine Control System Market, by End User, 2017-2030(US$ Bn)
12.1.1. Overview
12.1.2. SRC Analysis
12.2. Europe Machine Control System Market, by Packaging Type, 2017-2030(US$ Bn)
12.2.1. Overview
12.2.2. SRC Analysis
12.3. Europe Machine Control System Market, by Distribution Channel, 2017-2030(US$ Bn)
12.3.1. Overview
12.3.2. SRC Analysis
12.4. Europe Machine Control System Market, by region, 2017-2030 (US$ Bn)
12.4.1. Europe Machine Control System Market, by Country, 2022 Vs 2030 (in%)
12.4.2. Germany
12.4.2.1. Germany Machine Control System Market Estimates and Forecast, 2017-2030 (US$ Bn)
12.4.2.2. Germany Machine Control System, By End User, 2017-2030 (US$ Bn)
12.4.2.3. Germany Machine Control System, By Packaging Type, 2017-2030 (US$ Bn)
12.4.2.4. Germany Machine Control System, By Distribution Channel, 2017-2030 (US$ Bn)
12.4.3. France
12.4.3.1. France Machine Control System Market Estimates and Forecast, 2017-2030 (US$ Bn)
12.4.3.2. France Machine Control System, By End User, 2017-2030 (US$ Bn)
12.4.3.3. France Machine Control System, By Packaging Type, 2017-2030 (US$ Bn)
12.4.3.4. France Machine Control System, By Distribution Channel, 2017-2030 (US$ Bn)
12.4.4. UK
12.4.4.1. UK Machine Control System Market Estimates and Forecast, 2017-2030 (US$ Bn)
12.4.4.2. UK Machine Control System, By End User, 2017-2030 (US$ Bn)
12.4.4.3. UK Machine Control System, By Packaging Type, 2017-2030 (US$ Bn)
12.4.4.4. UK Machine Control System, By Distribution Channel, 2017-2030 (US$ Bn)
12.4.5. Italy
12.4.5.1. Italy Machine Control System Market Estimates and Forecast, 2017-2030 (US$ Bn)
12.4.5.2. Italy Machine Control System, By End User, 2017-2030 (US$ Bn)
12.4.5.3. Italy Machine Control System, By Packaging Type, 2017-2030 (US$ Bn)
12.4.5.4. Italy Machine Control System, By Distribution Channel, 2017-2030 (US$ Bn)
12.4.6. Spain
12.4.6.1. Spain Machine Control System Market Estimates and Forecast, 2017-2030 (US$ Bn)
12.4.6.2. Spain Machine Control System, By End User, 2017-2030 (US$ Bn)
12.4.6.3. Spain Machine Control System, By Packaging Type, 2017-2030 (US$ Bn)
12.4.6.4. Spain Machine Control System, By Distribution Channel, 2017-2030 (US$ Bn)
12.4.7. Rest of Europe
12.4.7.1. Rest of Europe Machine Control System Market Estimates and Forecast, 2017-2030 (US$ Bn)
12.4.7.2. Rest of Europe Machine Control System, By End User, 2017-2030 (US$ Bn)
12.4.7.3. Rest of Europe Machine Control System, By Packaging Type, 2017-2030 (US$ Bn)
12.4.7.4. Rest of Europe Machine Control System, By Distribution Channel, 2017-2030 (US$ Bn)

13. Asia Pacific Machine Control System Market Analysis
13.1. Asia Pacific Machine Control System Market, by End User, 2017-2030(US$ Bn)
13.1.1. Overview
13.1.2. SRC Analysis
13.2. Asia Pacific Machine Control System Market, by Packaging Type, 2017-2030(US$ Bn)
13.2.1. Overview
13.2.2. SRC Analysis
13.3. Asia Pacific Machine Control System Market, by Distribution Channel, 2017-2030(US$ Bn)
13.3.1. Overview
13.3.2. SRC Analysis
13.4. Asia Pacific Machine Control System Market, by Country, 2017-2030 (US$ Bn)
13.4.1. Asia Pacific Machine Control System Market, by Country, 2022 Vs 2030 (in%)
13.4.2. China
13.4.2.1. China Machine Control System Market Estimates and Forecast, 2017-2030 (US$ Bn)
13.4.2.2. China Machine Control System, By End User, 2017-2030 (US$ Bn)
13.4.2.3. China Machine Control System, By Packaging Type, 2017-2030 (US$ Bn)
13.4.2.4. China Machine Control System, By Distribution Channel, 2017-2030 (US$ Bn)
13.4.3. Japan
13.4.3.1. Japan Machine Control System Market Estimates and Forecast, 2017-2030 (US$ Bn)
13.4.3.2. Japan Machine Control System, By End User, 2017-2030 (US$ Bn)
13.4.3.3. Japan Machine Control System, By Packaging Type, 2017-2030 (US$ Bn)
13.4.3.4. Japan Machine Control System, By Distribution Channel, 2017-2030 (US$ Bn)
13.4.4. India
13.4.4.1. India Machine Control System Market Estimates and Forecast, 2017-2030 (US$ Bn)
13.4.4.2. India Machine Control System, By End User, 2017-2030 (US$ Bn)
13.4.4.3. India Machine Control System, By Packaging Type, 2017-2030 (US$ Bn)
13.4.4.4. India Machine Control System, By Distribution Channel, 2017-2030 (US$ Bn)
13.4.5. South Korea
13.4.5.1. South Korea Machine Control System Market Estimates and Forecast, 2017-2030 (US$ Bn)
13.4.5.2. South Korea Machine Control System, By End User, 2017-2030 (US$ Bn)
13.4.5.3. South Korea Machine Control System, By Packaging Type, 2017-2030 (US$ Bn)
13.4.5.4. South Korea Machine Control System, By Distribution Channel, 2017-2030 (US$ Bn)
13.4.6. South-East Asia
13.4.6.1. South-East Asia Machine Control System Market Estimates and Forecast, 2017-2030 (US$ Bn)
13.4.6.2. South-East Asia Machine Control System, By End User, 2017-2030 (US$ Bn)
13.4.6.3. South-East Asia Machine Control System, By Packaging Type, 2017-2030 (US$ Bn)
13.4.6.4. South-East Asia Machine Control System, By Distribution Channel, 2017-2030 (US$ Bn)
13.4.7. Rest of Asia Pacific
13.4.7.1. Rest of Asia Pacific Machine Control System Market Estimates and Forecast, 2017-2030 (US$ Bn)
13.4.7.2. Rest of Asia Pacific Machine Control System, By End User, 2017-2030 (US$ Bn)
13.4.7.3. Rest of Asia Pacific Machine Control System, By Packaging Type, 2017-2030 (US$ Bn)
13.4.7.4. Rest of Asia Pacific Machine Control System, By Distribution Channel, 2017-2030 (US$ Bn)

14. Latin America Machine Control System Market Analysis
14.1. Latin America Machine Control System Market, by End User, 2017-2030(US$ Bn)
14.1.1. Overview
14.1.2. SRC Analysis
14.2. Latin America Machine Control System Market, by Packaging Type, 2017-2030(US$ Bn)
14.2.1. Overview
14.2.2. SRC Analysis
14.3. Latin America Machine Control System Market, by Distribution Channel, 2017-2030(US$ Bn)
14.3.1. Overview
14.3.2. SRC Analysis
14.4. Latin America Machine Control System Market, by Country, 2017-2030 (US$ Bn)
14.4.1. Latin America Machine Control System Market, by Country, 2022 Vs 2030 (in%)
14.4.2. Brazil
14.4.2.1. Brazil Machine Control System Market Estimates and Forecast, 2017-2030 (US$ Bn)
14.4.2.2. Brazil Machine Control System, By End User, 2017-2030 (US$ Bn)
14.4.2.3. Brazil Machine Control System, By Packaging Type, 2017-2030 (US$ Bn)
14.4.2.4. Brazil Machine Control System, By Distribution Channel, 2017-2030 (US$ Bn)
14.4.3. Argentina
14.4.3.1. Argentina Machine Control System Market Estimates and Forecast, 2017-2030 (US$ Bn)
14.4.3.2. Argentina Machine Control System, By End User, 2017-2030 (US$ Bn)
14.4.3.3. Argentina Machine Control System, By Packaging Type, 2017-2030 (US$ Bn)
14.4.3.4. Argentina Machine Control System, By Distribution Channel, 2017-2030 (US$ Bn)
14.4.4. Rest of Latin America
14.4.4.1. Rest of Latin America Machine Control System Market Estimates and Forecast, 2017-2030 (US$ Bn)
14.4.4.2. Rest of Latin America Machine Control System, By End User, 2017-2030 (US$ Bn)
14.4.4.3. Rest of Latin America Machine Control System, By Packaging Type, 2017-2030 (US$ Bn)
14.4.4.4. Rest of Latin America Machine Control System, By Distribution Channel, 2017-2030 (US$ Bn)

15. Middle East and Africa Machine Control System Market Analysis
15.1. Middle East and Africa Machine Control System Market, by End User, 2017-2030(US$ Bn)
15.1.1. Overview
15.1.2. SRC Analysis
15.2. Middle East and Africa Machine Control System Market, by Packaging Type, 2017-2030(US$ Bn)
15.2.1. Overview
15.2.2. SRC Analysis
15.3. Middle East and Africa Machine Control System Market, by Distribution Channel, 2017-2030(US$ Bn)
15.3.1. Overview
15.3.2. SRC Analysis
15.4. Middle East and Africa Machine Control System Market, by Country, 2017-2030 (US$ Bn)
15.4.1. Middle East and Africa Machine Control System Market, by Country, 2022 Vs 2030 (in%)
15.4.2. GCC Countries
15.4.2.1. GCC Countries Machine Control System Market Estimates and Forecast, 2017-2030 (US$ Bn)
15.4.2.2. GCC Countries Machine Control System, By End User, 2017-2030 (US$ Bn)
15.4.2.3. GCC Countries Machine Control System, By Packaging Type, 2017-2030 (US$ Bn)
15.4.2.4. GCC Countries Machine Control System, By Distribution Channel, 2017-2030 (US$ Bn)
15.4.3. South Africa
15.4.3.1. South Africa Machine Control System Market Estimates and Forecast, 2017-2030 (US$ Bn)
15.4.3.2. South Africa Machine Control System, By End User, 2017-2030 (US$ Bn)
15.4.3.3. South Africa Machine Control System, By Packaging Type, 2017-2030 (US$ Bn)
15.4.3.4. South Africa Machine Control System, By Distribution Channel, 2017-2030 (US$ Bn)
15.4.4. Rest of Middle East and Africa
15.4.4.1. Rest of Middle East and Africa Machine Control System Market Estimates and Forecast, 2017-2030 (US$ Bn)
15.4.4.2. Rest of Middle East and Africa Machine Control System, By End User, 2017-2030 (US$ Bn)
15.4.4.3. Rest of Middle East and Africa Machine Control System, By Packaging Type, 2017-2030 (US$ Bn)
15.4.4.4. Rest of Middle East and Africa Machine Control System, By Distribution Channel, 2017-2030 (US$ Bn)


16. Company Profiles
16.1. Bauer Nutrition
16.1.1. Company Overview
16.1.2. Product/Services Portfolio
16.1.3. Geographical Presence
16.1.4. Financial Summary
16.1.4.1. Market Revenue and Net Profit (2019-2022)
16.1.4.2. Business Segment Revenue Analysis
16.1.4.3. Geographical Revenue Analysis
16.2. ATP CO. LTD
16.3. TCI Co, Ltd
16.4. SHISEIDO COMPANY
16.5. AMORE PACIFIC CORPORATION
16.6. Kinohimitsu
16.7. Hangzhou Nutrition Biotechnology Co
16.8. Asterism Healthcare
16.9. WEL-BLOOM BIO-TECH CORPORATION


List of Figures
FIG. 1 Global Machine Control System Market: Research Methodology
FIG. 2 Market Size Estimation – Top Down & Bottom up Approach
FIG. 3 Global Machine Control System Market Segmentation
FIG. 4 Global Machine Control System Market, by End User, 2022 (US$ Bn)
FIG. 5 Global Machine Control System Market, by Packaging Type, 2022 (US$ Bn)
FIG. 6 Global Machine Control System Market, by Distribution Channel, 2022 (US$ Bn)
FIG. 7 Global Machine Control System Market, by Geography, 2022 (US$ Bn)
FIG. 8 Attractive Investment Proposition, by End User, 2022
FIG. 9 Attractive Investment Proposition, by Packaging Type, 2022
FIG. 10 Attractive Investment Proposition, by Distribution Channel, 2022
FIG. 11 Attractive Investment Proposition, by Geography, 2022
FIG. 12 Global Market Share Analysis of Key Machine Control System Market Manufacturers, 2022
FIG. 13 Global Market Positioning of Key Machine Control System Market Manufacturers, 2022
FIG. 14 Global Machine Control System Market Value Contribution, By End User, 2022 & 2030 (Value %)
FIG. 15 Global Machine Control System Market, by Male, Value, 2017-2030 (US$ Bn)
FIG. 16 Global Machine Control System Market, by Female, Value, 2017-2030 (US$ Bn)
FIG. 17 Global Machine Control System Market Value Contribution, By Packaging Type, 2022 & 2030 (Value %)
FIG. 18 Global Machine Control System Market, by Glass Bottle, Value, 2017-2030 (US$ Bn)
FIG. 19 Global Machine Control System Market, by Plastic Bottle, 2017-2030 (US$ Bn)
FIG. 20 Global Machine Control System Market Value Contribution, By Distribution Channel, 2022 & 2030 (Value %)
FIG. 21 Global Machine Control System Market, by Supermarkets/Hypermarkets, Value, 2017-2030 (US$ Bn)
FIG. 22 Global Machine Control System Market, by Pharmacies, Value, 2017-2030 (US$ Bn)
FIG. 23 Global Machine Control System Market, by Online Sales Channel, Value, 2017-2030 (US$ Bn)
FIG. 24 Global Machine Control System Market, by Others, Value, 2017-2030 (US$ Bn)
FIG. 25 North America Machine Control System Market, 2017-2030 (US$ Bn)
FIG. 26 U.S. Machine Control System Market, 2017-2030 (US$ Bn)
FIG. 27 Canada Machine Control System Market, 2017-2030 (US$ Bn)
FIG. 28 Europe Machine Control System Market, 2017-2030 (US$ Bn)
FIG. 29 Germany Machine Control System Market, 2017-2030 (US$ Bn)
FIG. 30 France Machine Control System Market, 2017-2030 (US$ Bn)
FIG. 31 U.K. Machine Control System Market, 2017-2030 (US$ Bn)
FIG. 32 Italy Machine Control System Market, 2017-2030 (US$ Bn)
FIG. 33 Spain Machine Control System Market, 2017-2030 (US$ Bn)
FIG. 34 Rest of Europe Machine Control System Market, 2017-2030 (US$ Bn)
FIG. 35 Asia Pacific Machine Control System Market, 2017-2030 (US$ Bn)
FIG. 36 China Machine Control System Market, 2017-2030 (US$ Bn)
FIG. 37 Japan Machine Control System Market, 2017-2030 (US$ Bn)
FIG. 38 India Machine Control System Market, 2017-2030 (US$ Bn)
FIG. 39 South Korea Machine Control System Market, 2017-2030 (US$ Bn)
FIG. 40 South-East Asia Machine Control System Market, 2017-2030 (US$ Bn)
FIG. 41 Rest of Asia Pacific Machine Control System Market, 2017-2030 (US$ Bn)
FIG. 42 Latin America Machine Control System Market, 2017-2030 (US$ Bn)
FIG. 43 Brazil Machine Control System Market, 2017-2030 (US$ Bn)
FIG. 44 Mexico Machine Control System Market, 2017-2030 (US$ Bn)
FIG. 45 Rest of Latin America Machine Control System Market, 2017-2030 (US$ Bn)
FIG. 46 Middle East & Africa Machine Control System Market, 2017-2030 (US$ Bn)
FIG. 47 GCC Countries Machine Control System Market, 2017-2030 (US$ Bn)
FIG. 48 South Africa Machine Control System Market, 2017-2030 (US$ Bn)
FIG. 49 Rest of Middle East and Africa Machine Control System Market, 2017-2030 (US$ Bn)

List of Tables
TABLE 1 Market Snapshot: Global Machine Control System Market
TABLE 2 Global Machine Control System Market: Market Drivers Impact Analysis
TABLE 3 Global Machine Control System Market: Market Restraints Impact Analysis
TABLE 4 Global Machine Control System Market, by Competitive Benchmarking, 2022
TABLE 5 Global Machine Control System Market, by Geographical Presence Analysis, 2022
TABLE 6 Global Machine Control System Market, by Key Strategies Analysis, 2022
TABLE 7 Global Machine Control System Market, by Male, By Region, 2017-2022 (US$ Bn)
TABLE 8 Global Machine Control System Market, by Male, By Region, 2023-2030 (US$ Bn)
TABLE 9 Global Machine Control System Market, by Female, By Region, 2017-2022 (US$ Bn)
TABLE 10 Global Machine Control System Market, by Female, By Region, 2023-2030 (US$ Bn)
TABLE 11 Global Machine Control System Market, by Glass Bottle, By Region, 2017-2022 (US$ Bn)
TABLE 12 Global Machine Control System Market, by Glass Bottle, By Region, 2023-2030 (US$ Bn)
TABLE 13 Global Machine Control System Market, by Plastic Bottle, By Region, 2017-2022 (US$ Bn)
TABLE 14 Global Machine Control System Market, by Plastic Bottle, By Region, 2023-2030 (US$ Bn)
TABLE 15 Global Machine Control System Market, by Supermarkets/Hypermarkets, By Region, 2017-2022 (US$ Bn)
TABLE 16 Global Machine Control System Market, by Supermarkets/Hypermarkets, By Region, 2023-2030 (US$ Bn)
TABLE 17 Global Machine Control System Market, by Pharmacies, By Region, 2017-2022 (US$ Bn)
TABLE 18 Global Machine Control System Market, by Pharmacies, By Region, 2023-2030 (US$ Bn)
TABLE 19 Global Machine Control System Market, by Online Sales Channel, By Region, 2023-2030 (US$ Bn)
TABLE 20 Global Machine Control System Market, by Online Sales Channel, By Region, 2023-2030 (US$ Bn)
TABLE 21 Global Machine Control System Market, by Others, By Region, 2023-2030 (US$ Bn)
TABLE 22 Global Machine Control System Market, by Others, By Region, 2023-2030 (US$ Bn)
TABLE 23 Global Machine Control System Market, by End User, 2017-2022 (US$ Bn)
TABLE 24 Global Machine Control System Market, by End User, 2023-2030 (US$ Bn)
TABLE 25 Global Machine Control System Market, by Packaging Type, 2017-2022 (US$ Bn)
TABLE 26 Global Machine Control System Market, by Packaging Type, 2023-2030 (US$ Bn)
TABLE 27 Global Machine Control System Market, by Distribution Channel, 2017-2022 (US$ Bn)
TABLE 28 Global Machine Control System Market, by Distribution Channel, 2023-2030 (US$ Bn)
TABLE 29 Global Machine Control System Market, by Region, 2017-2022 (US$ Bn)
TABLE 30 Global Machine Control System Market, by Region, 2023-2030 (US$ Bn)
TABLE 31 North America Machine Control System Market, by End User, 2017-2022 (US$ Bn)
TABLE 32 North America Machine Control System Market, by End User, 2023-2030 (US$ Bn)
TABLE 33 North America Machine Control System Market, by Packaging Type, 2017-2022 (US$ Bn)
TABLE 34 North America Machine Control System Market, by Packaging Type, 2023-2030 (US$ Bn)
TABLE 35 North America Machine Control System Market, by Distribution Channel, 2017-2022 (US$ Bn)
TABLE 36 North America Machine Control System Market, by Distribution Channel, 2023-2030 (US$ Bn)
TABLE 37 North America Machine Control System Market, by Country, 2017-2022 (US$ Bn)
TABLE 38 North America Machine Control System Market, by Country, 2023-2030 (US$ Bn)
TABLE 39 United States Machine Control System Market, by End User, 2017-2022 (US$ Bn)
TABLE 40 United States Machine Control System Market, by End User, 2023-2030 (US$ Bn)
TABLE 41 United States Machine Control System Market, by Packaging Type, 2017-2022 (US$ Bn)
TABLE 42 United States Machine Control System Market, by Packaging Type, 2023-2030 (US$ Bn)
TABLE 43 United States Machine Control System Market, by Distribution Channel, 2017-2022 (US$ Bn)
TABLE 44 United States Machine Control System Market, by Distribution Channel, 2023-2030 (US$ Bn)
TABLE 45 Canada Machine Control System Market, by End User, 2017-2022 (US$ Bn)
TABLE 46 Canada Machine Control System Market, by End User, 2023-2030 (US$ Bn)
TABLE 47 Canada Machine Control System Market, by Packaging Type, 2017-2022 (US$ Bn)
TABLE 48 Canada Machine Control System Market, by Packaging Type, 2023-2030 (US$ Bn)
TABLE 49 Canada Machine Control System Market, by Distribution Channel, 2017-2022 (US$ Bn)
TABLE 50 Canada Machine Control System Market, by Distribution Channel, 2023-2030 (US$ Bn)
TABLE 51 Mexico Machine Control System Market, by End User, 2017-2022 (US$ Bn)
TABLE 52 Mexico Machine Control System Market, by End User, 2023-2030 (US$ Bn)
TABLE 53 Mexico Machine Control System Market, by Packaging Type, 2017-2022 (US$ Bn)
TABLE 54 Mexico Machine Control System Market, by Packaging Type, 2023-2030 (US$ Bn)
TABLE 55 Mexico Machine Control System Market, by Distribution Channel, 2017-2022 (US$ Bn)
TABLE 56 Mexico Machine Control System Market, by Distribution Channel, 2023-2030 (US$ Bn)
TABLE 57 Europe Machine Control System Market, by End User, 2017-2022 (US$ Bn)
TABLE 58 Europe Machine Control System Market, by End User, 2023-2030 (US$ Bn)
TABLE 59 Europe Machine Control System Market, by Packaging Type, 2017-2022 (US$ Bn)
TABLE 60 Europe Machine Control System Market, by Packaging Type, 2023-2030 (US$ Bn)
TABLE 61 Europe Machine Control System Market, by Distribution Channel, 2017-2022 (US$ Bn)
TABLE 62 Europe Machine Control System Market, by Distribution Channel, 2023-2030 (US$ Bn)
TABLE 63 Europe Machine Control System Market, by Country, 2017-2022 (US$ Bn)
TABLE 64 Europe Machine Control System Market, by Country, 2023-2030 (US$ Bn)
TABLE 65 Germany Machine Control System Market, by End User, 2017-2022 (US$ Bn)
TABLE 66 Germany Machine Control System Market, by End User, 2023-2030 (US$ Bn)
TABLE 67 Germany Machine Control System Market, by Packaging Type, 2017-2022 (US$ Bn)
TABLE 68 Germany Machine Control System Market, by Packaging Type, 2023-2030 (US$ Bn)
TABLE 69 Germany Machine Control System Market, by Distribution Channel, 2017-2022 (US$ Bn)
TABLE 70 Germany Machine Control System Market, by Distribution Channel, 2023-2030 (US$ Bn)
TABLE 71 France Machine Control System Market, by End User, 2017-2022 (US$ Bn)
TABLE 72 France Machine Control System Market, by End User, 2023-2030 (US$ Bn)
TABLE 73 France Machine Control System Market, by Packaging Type, 2017-2022 (US$ Bn)
TABLE 74 France Machine Control System Market, by Packaging Type, 2023-2030 (US$ Bn)
TABLE 75 France Machine Control System Market, by Distribution Channel, 2017-2022 (US$ Bn)
TABLE 76 France Machine Control System Market, by Distribution Channel, 2023-2030 (US$ Bn)
TABLE 77 United Kingdom Machine Control System Market, by End User, 2017-2022 (US$ Bn)
TABLE 78 United Kingdom Machine Control System Market, by End User, 2023-2030 (US$ Bn)
TABLE 79 United Kingdom Machine Control System Market, by Packaging Type, 2017-2022 (US$ Bn)
TABLE 80 United Kingdom Machine Control System Market, by Packaging Type, 2023-2030 (US$ Bn)
TABLE 81 United Kingdom Machine Control System Market, by Distribution Channel, 2017-2022 (US$ Bn)
TABLE 82 United Kingdom Machine Control System Market, by Distribution Channel, 2023-2030 (US$ Bn)
TABLE 83 Italy Machine Control System Market, by End User, 2017-2022 (US$ Bn)
TABLE 84 Italy Machine Control System Market, by End User, 2023-2030 (US$ Bn)
TABLE 85 Italy Machine Control System Market, by Packaging Type, 2017-2022 (US$ Bn)
TABLE 86 Italy Machine Control System Market, by Packaging Type, 2023-2030 (US$ Bn)
TABLE 87 Italy Machine Control System Market, by Distribution Channel, 2017-2022 (US$ Bn)
TABLE 88 Italy Machine Control System Market, by Distribution Channel, 2023-2030 (US$ Bn)
TABLE 89 Spain Machine Control System Market, by End User, 2017-2022 (US$ Bn)
TABLE 90 Spain Machine Control System Market, by End User, 2023-2030 (US$ Bn)
TABLE 91 Spain Machine Control System Market, by Packaging Type, 2017-2022 (US$ Bn)
TABLE 92 Spain Machine Control System Market, by Packaging Type, 2023-2030 (US$ Bn)
TABLE 93 Spain Machine Control System Market, by Distribution Channel, 2017-2022 (US$ Bn)
TABLE 94 Spain Machine Control System Market, by Distribution Channel, 2023-2030 (US$ Bn)
TABLE 95 Rest of Europe Machine Control System Market, by End User, 2017-2022 (US$ Bn)
TABLE 96 Rest of Europe Machine Control System Market, by End User, 2023-2030 (US$ Bn)
TABLE 97 Rest of Europe Machine Control System Market, by Packaging Type, 2017-2022 (US$ Bn)
TABLE 98 Rest of Europe Machine Control System Market, by Distribution Channel, 2023-2030 (US$ Bn)
TABLE 99 Rest of Europe Machine Control System Market, by Distribution Channel, 2017-2022 (US$ Bn)
TABLE 100 Rest of Europe Machine Control System Market, by Packaging Type, 2023-2030 (US$ Bn)
TABLE 101 Asia Pacific Machine Control System Market, by End User, 2017-2022 (US$ Bn)
TABLE 102 Asia Pacific Machine Control System Market, by End User, 2023-2030 (US$ Bn)
TABLE 103 Asia Pacific Machine Control System Market, by Packaging Type, 2017-2022 (US$ Bn)
TABLE 104 Asia Pacific Machine Control System Market, by Packaging Type, 2023-2030 (US$ Bn)
TABLE 105 Asia Pacific Machine Control System Market, by Distribution Channel, 2017-2022 (US$ Bn)
TABLE 106 Asia Pacific Machine Control System Market, by Distribution Channel, 2023-2030 (US$ Bn)
TABLE 107 Asia Pacific Machine Control System Market, by Country, 2017-2022 (US$ Bn)
TABLE 108 Asia Pacific Machine Control System Market, by Country, 2023-2030 (US$ Bn)
TABLE 109 China Machine Control System Market, by End User, 2017-2022 (US$ Bn)
TABLE 110 China Machine Control System Market, by End User, 2023-2030 (US$ Bn)
TABLE 111 China Machine Control System Market, by Packaging Type, 2017-2022 (US$ Bn)
TABLE 112 China Machine Control System Market, by Packaging Type, 2023-2030 (US$ Bn)
TABLE 113 China Machine Control System Market, by Distribution Channel, 2017-2022 (US$ Bn)
TABLE 114 China Machine Control System Market, by Distribution Channel, 2023-2030 (US$ Bn)
TABLE 115 Japan Machine Control System Market, by End User, 2017-2022 (US$ Bn)
TABLE 116 Japan Machine Control System Market, by End User, 2023-2030 (US$ Bn)
TABLE 117 Japan Machine Control System Market, by Packaging Type, 2017-2022 (US$ Bn)
TABLE 118 Japan Machine Control System Market, by Packaging Type, 2023-2030 (US$ Bn)
TABLE 119 Japan Machine Control System Market, by Distribution Channel, 2017-2022 (US$ Bn)
TABLE 120 Japan Machine Control System Market, by Distribution Channel, 2023-2030 (US$ Bn)
TABLE 121 India Machine Control System Market, by End User, 2017-2022 (US$ Bn)
TABLE 122 India Machine Control System Market, by End User, 2023-2030 (US$ Bn)
TABLE 123 India Machine Control System Market, by Packaging Type, 2017-2022 (US$ Bn)
TABLE 124 India Machine Control System Market, by Packaging Type, 2023-2030 (US$ Bn)
TABLE 125 India Machine Control System Market, by Distribution Channel, 2017-2022 (US$ Bn)
TABLE 126 India Machine Control System Market, by Distribution Channel, 2023-2030 (US$ Bn)
TABLE 127 South Korea Machine Control System Market, by End User, 2017-2022 (US$ Bn)
TABLE 128 South Korea Machine Control System Market, by End User, 2023-2030 (US$ Bn)
TABLE 129 South Korea Machine Control System Market, by Packaging Type, 2017-2022 (US$ Bn)
TABLE 130 South Korea Machine Control System Market, by Packaging Type, 2023-2030 (US$ Bn)
TABLE 131 South Korea Machine Control System Market, by Distribution Channel, 2017-2022 (US$ Bn)
TABLE 132 South Korea Machine Control System Market, by Distribution Channel, 2023-2030 (US$ Bn)
TABLE 133 South-East Asia Machine Control System Market, by End User, 2017-2022 (US$ Bn)
TABLE 134 South-East Asia Machine Control System Market, by End User, 2023-2030 (US$ Bn)
TABLE 135 South-East Asia Machine Control System Market, by Packaging Type, 2017-2022 (US$ Bn)
TABLE 136 South-East Asia Machine Control System Market, by Packaging Type, 2023-2030 (US$ Bn)
TABLE 137 South-East Asia Machine Control System Market, by Distribution Channel, 2017-2022 (US$ Bn)
TABLE 138 South-East Asia Machine Control System Market, by Distribution Channel, 2023-2030 (US$ Bn)
TABLE 139 Rest of Asia Pacific Machine Control System Market, by End User, 2017-2022 (US$ Bn)
TABLE 140 Rest of Asia Pacific Machine Control System Market, by End User, 2023-2030 (US$ Bn)
TABLE 141 Rest of Asia Pacific Machine Control System Market, by Packaging Type, 2017-2022 (US$ Bn)
TABLE 142 Rest of Asia Pacific Machine Control System Market, by Packaging Type, 2023-2030 (US$ Bn)
TABLE 143 Rest of Asia Pacific Machine Control System Market, by Distribution Channel, 2017-2022 (US$ Bn)
TABLE 144 Rest of Asia Pacific Machine Control System Market, by Distribution Channel, 2023-2030 (US$ Bn)
TABLE 145 Latin America Machine Control System Market, by End User, 2017-2022 (US$ Bn)
TABLE 146 Latin America Machine Control System Market, by End User, 2023-2030 (US$ Bn)
TABLE 147 Latin America Machine Control System Market, by Packaging Type, 2017-2022 (US$ Bn)
TABLE 148 Latin America Machine Control System Market, by Packaging Type, 2023-2030 (US$ Bn)
TABLE 149 Latin America Machine Control System Market, by Distribution Channel, 2017-2022 (US$ Bn)
TABLE 150 Latin America Machine Control System Market, by Distribution Channel, 2023-2030 (US$ Bn)
TABLE 151 Latin America Machine Control System Market, by Country, 2017-2022 (US$ Bn)
TABLE 152 Latin America Machine Control System Market, by Country, 2023-2030 (US$ Bn)
TABLE 153 Brazil Machine Control System Market, by End User, 2017-2022 (US$ Bn)
TABLE 154 Brazil Machine Control System Market, by End User, 2023-2030 (US$ Bn)
TABLE 155 Brazil Machine Control System Market, by Packaging Type, 2017-2022 (US$ Bn)
TABLE 156 Brazil Machine Control System Market, by Packaging Type, 2023-2030 (US$ Bn)
TABLE 157 Brazil Machine Control System Market, by Distribution Channel, 2017-2022 (US$ Bn)
TABLE 158 Brazil Machine Control System Market, by Distribution Channel, 2023-2030 (US$ Bn)
TABLE 159 Argentina Machine Control System Market, by End User, 2017-2022 (US$ Bn)
TABLE 160 Argentina Machine Control System Market, by End User, 2023-2030 (US$ Bn)
TABLE 161 Argentina Machine Control System Market, by Packaging Type, 2017-2022 (US$ Bn)
TABLE 162 Argentina Machine Control System Market, by Packaging Type, 2023-2030 (US$ Bn)
TABLE 163 Argentina Machine Control System Market, by Distribution Channel, 2017-2022 (US$ Bn)
TABLE 164 Argentina Machine Control System Market, by Distribution Channel, 2023-2030 (US$ Bn)
TABLE 165 Rest of Latin America Machine Control System Market, by End User, 2017-2022 (US$ Bn)
TABLE 166 Rest of Latin America Machine Control System Market, by End User, 2023-2030 (US$ Bn)
TABLE 167 Rest of Latin America Machine Control System Market, by Packaging Type, 2017-2022 (US$ Bn)
TABLE 168 Rest of Latin America Machine Control System Market, by Packaging Type, 2023-2030 (US$ Bn)
TABLE 169 Rest of Latin America Machine Control System Market, by Distribution Channel, 2017-2022 (US$ Bn)
TABLE 170 Rest of Latin America Machine Control System Market, by Distribution Channel, 2023-2030 (US$ Bn)
TABLE 171 Middle East and Africa Machine Control System Market, by End User, 2017-2022 (US$ Bn)
TABLE 172 Middle East and Africa Machine Control System Market, by End User, 2023-2030 (US$ Bn)
TABLE 173 Middle East and Africa Machine Control System Market, by Packaging Type, 2017-2022 (US$ Bn)
TABLE 174 Middle East and Africa Machine Control System Market, by Packaging Type, 2023-2030 (US$ Bn)
TABLE 175 Middle East and Africa Machine Control System Market, by Distribution Channel, 2017-2022 (US$ Bn)
TABLE 176 Middle East and Africa Machine Control System Market, by Distribution Channel, 2023-2030 (US$ Bn)
TABLE 177 Middle East and Africa Machine Control System Market, by Country, 2017-2022 (US$ Bn)
TABLE 178 Middle East and Africa Machine Control System Market, by Country, 2023-2030 (US$ Bn)
TABLE 179 GCC Countries Machine Control System Market, by End User, 2017-2022 (US$ Bn)
TABLE 180 GCC Countries Machine Control System Market, by End User, 2023-2030 (US$ Bn)
TABLE 181 GCC Countries Machine Control System Market, by Packaging Type, 2017-2022 (US$ Bn)
TABLE 182 GCC Countries Machine Control System Market, by Packaging Type, 2023-2030 (US$ Bn)
TABLE 183 GCC Countries Machine Control System Market, by Distribution Channel, 2017-2022 (US$ Bn)
TABLE 184 GCC Countries Machine Control System Market, by Distribution Channel, 2023-2030 (US$ Bn)
TABLE 185 South Africa Machine Control System Market, by End User, 2017-2022 (US$ Bn)
TABLE 186 South Africa Machine Control System Market, by End User, 2023-2030 (US$ Bn)
TABLE 187 South Africa Machine Control System Market, by Packaging Type, 2017-2022 (US$ Bn)
TABLE 188 South Africa Machine Control System Market, by Packaging Type, 2023-2030 (US$ Bn)
TABLE 189 South Africa Machine Control System Market, by Distribution Channel, 2017-2022 (US$ Bn)
TABLE 190 South Africa Machine Control System Market, by Distribution Channel, 2023-2030 (US$ Bn)
TABLE 191 Rest of Middle East and Africa Machine Control System Market, by End User, 2017-2022 (US$ Bn)
TABLE 192 Rest of Middle East and Africa Machine Control System Market, by End User, 2023-2030 (US$ Bn)
TABLE 193 Rest of Middle East and Africa Machine Control System Market, by Packaging Type, 2017-2022 (US$ Bn)
TABLE 194 Rest of Middle East and Africa Machine Control System Market, by Packaging Type, 2023-2030 (US$ Bn)
TABLE 195 Rest of Middle East and Africa Machine Control System Market, by Distribution Channel, 2017-2022 (US$ Bn)
TABLE 196 Rest of Middle East and Africa Machine Control System Market, by Distribution Channel, 2023-2030 (US$ Bn)

Frequently Asked Questions

What is the current size of the global Collagen Drinks Market?

The global Collagen Drinks Market was valued at USD 0.3 Billion in 2022.

What is the expected growth rate of the Collagen Drinks Market between 2023 and 2030?

The Collagen Drinks Market is expected to grow at a CAGR of 13.20% between 2023 and 2030, reaching USD 0.714572408 Billion in 2030.

Which segment is leading the market share in terms of End User type?

Female is the leading segment by End User, holding over two-thirds share in terms of value in 2022.

Which Packaging Type segment governs the demand for Collagen Drinks in the world?

Plastic Bottle segment governs the demand for Collagen Drinks in the world, holding a massive share of nearly three-fifths in 2022.

Which segment is expected to post the highest CAGR during the forecast period?

Glass Bottle segment is expected to post the highest CAGR during the forecast period.

Which region is fuelling the growth of the Collagen Drinks industry?

North America is fuelling the growth of the Collagen Drinks industry, with over 42% share in 2022.

Who are the major players in the global Collagen Drinks Market?

The top players include Bauer Nutrition, ATP CO. LTD, TCI Co, Ltd, SHISEIDO COMPANY, LIMITED, AMORE PACIFIC CORPORATION, Kinohimitsu, Hangzhou Nutrition Biotechnology Co, Heivy,

What are the major market drivers of the Collagen Drinks industry?

Growing emphasis on health and wellness, as well as a focus on maintaining youthful appearances & growing awareness of age-related concerns, such as wrinkles, joint stiffness, and loss of skin elasticity are the major market drivers.

What are the major market restraints of the Collagen Drinks industry?

The need for more scientific research to establish concrete evidence regarding their efficacy & competition from other beauty and health supplements targeting similar benefits are the major market restraints.

What are the major market opportunities of the Collagen Drinks industry?

Consumers are increasingly seeking natural and functional beverages that offer health benefits beyond mere hydration & increasing consumer awareness and education opportunities for the Collagen Drinks industry.

Endoscopic Submucosal Dissection (ESD) Market

Published:
Report ID: 37490

Hyperthermia Cancer Treatment Market

Published:
Report ID: 37492

Australia Veterinary Imaging Market

Published:
Report ID: 37574

Japan’s Pharmacy Automation Market

Published:
Report ID: 37511

Syringes Market

Published:
Report ID: 37485

Sterile Active Pharmaceutical Ingredient Market

Published:
Report ID: 37476

Organ Preservation Solutions Market

Published:
Report ID: 37472

Middle East and Africa Veterinary Vaccines Market

Published:
Report ID: 37309

North America Cancer Therapy Market

Published:
Report ID: 37315

Liver Health Supplements Market

Published:
Report ID: 37298

Asia Pacific Stem Cell Therapy Market

Published:
Report ID: 37280

Walking Assist Devices Market

Published:
Report ID: 37276

Purchase Options

$2999
Delivery Format: Excel.
$4999
Designed for the individual purchaser.
$6999
Users located at a single corporate site or regional office.
$7999
Allowed for unlimited sharing globally within one company.
Smallform of Sample request

Have a question?

User Profile

Don’t settle for less – trust Mitul to help you find the best solution.

Report delivery within 24 to 48 hours

– Other Info –

What people say?-

User Review

I am very impressed with the information in this report. The author clearly did their research when they came up with this product and it has already given me a lot of ideas.

Jana Schmidt
CEDAR CX Technologies

– Connect with us –

Phone

+91 6232 49 3207


support

24/7 Research Support


sales@credenceresearch.com

– Research Methodology –

Going beyond the basics: advanced techniques in research methodology

– Trusted By –

Pepshi, LG, Nestle
Motorola, Honeywell, Johnson and johnson
LG Chem, SIEMENS, Pfizer
Unilever, Samsonite, QIAGEN