
Cosmeceutical API Market Overview:
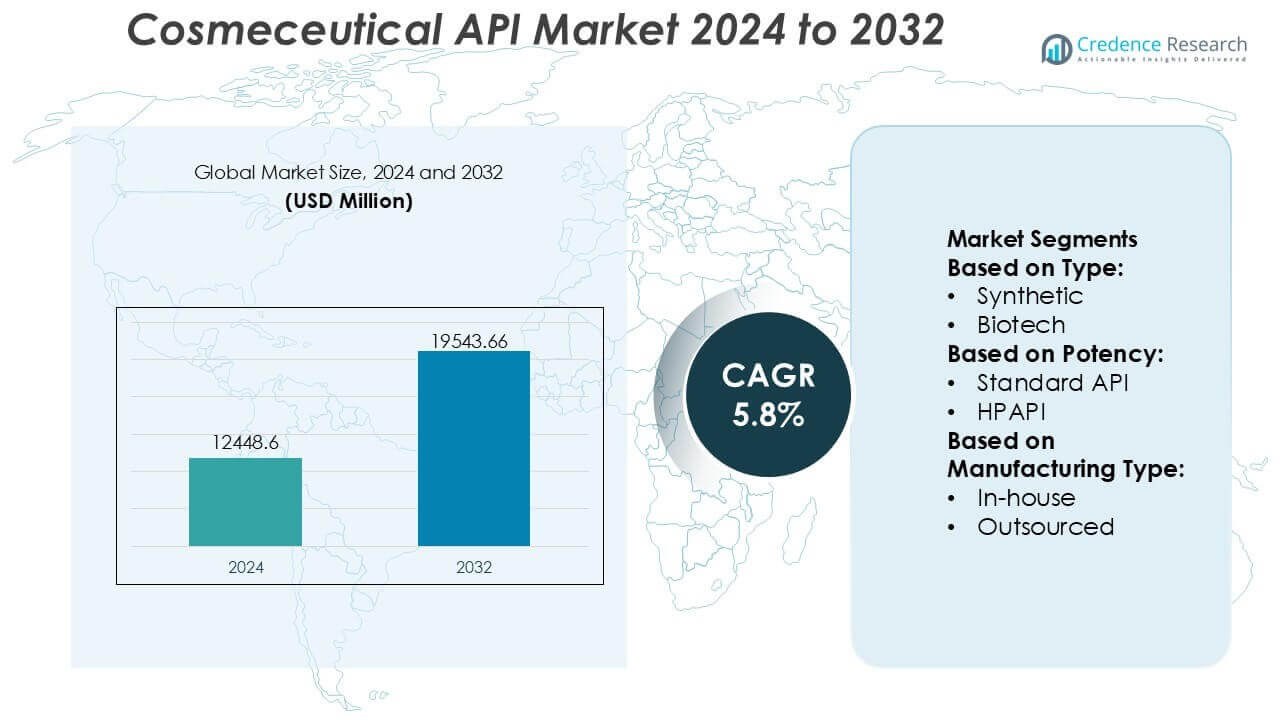
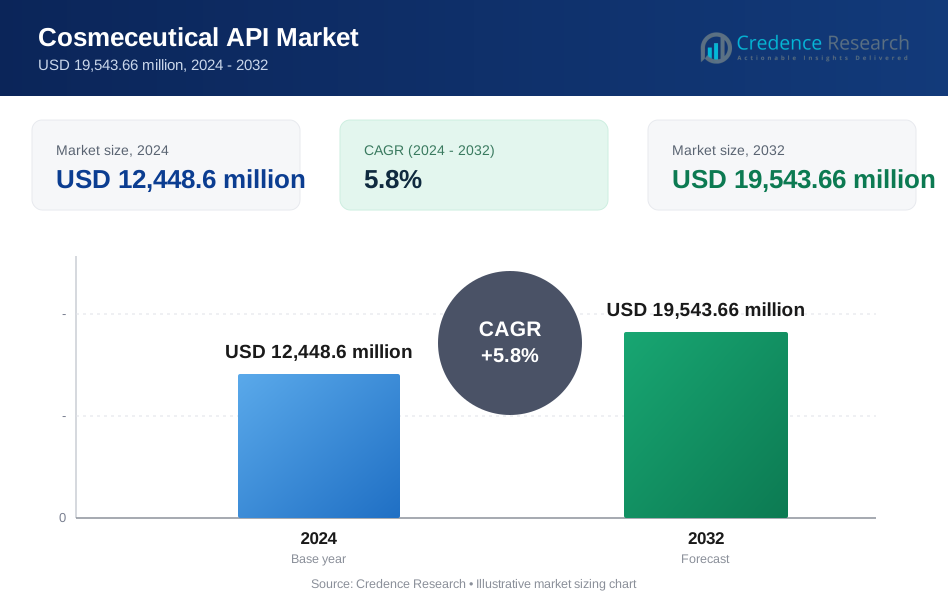
Cosmeceutical API Market size was valued USD 12448.6 million in 2024 and is anticipated to reach USD 19543.66 million by 2032, at a CAGR of 5.8% during the forecast period.
| REPORT ATTRIBUTE | DETAILS |
|---|---|
| Historical Period | 2020-2023 |
| Base Year | 2024 |
| Forecast Period | 2025-2032 |
| Cosmeceutical API Market Size 2024 | USD 12448.6 million |
| Cosmeceutical API Market, CAGR | 5.8% |
| Cosmeceutical API Market Size 2032 | USD 19543.66 million |
Cosmeceutical API Market Insights
- Market growth is primarily driven by rising demand for clinically validated, high-purity APIs supporting anti-aging, skin repair, pigmentation control, and sensitive-skin formulations.
- Innovation trends focus on biotech-derived and sustainably sourced APIs, while synthetic APIs remain dominant, accounting for approximately 58% market share due to scalability and formulation consistency.
- Competitive intensity remains high, with leading players leveraging strong R&D pipelines, proprietary molecules, vertical integration, and strategic partnerships to accelerate product commercialization.
- Regionally, North America leads the global market with an exact 41% share, supported by premium skincare consumption, advanced R&D infrastructure, and early adoption of science-backed cosmeceutical actives.
Cosmeceutical API Market Segmentation Analysis:
By Type
By type, synthetic cosmeceutical APIs dominate the market, accounting for an estimated 58% market share. Their leadership is driven by consistent quality, scalable production, and well-established chemical synthesis routes that ensure batch-to-batch reproducibility. Synthetic APIs are widely used in anti-aging, acne, and skin-brightening formulations due to predictable efficacy and regulatory familiarity. Strong demand from mass-market and premium brands alike supports volume growth, while continuous optimization in chemical synthesis and cost efficiency further reinforces the dominance of synthetic APIs over biotech-derived alternatives.
- For instance, Croda International Plc operates high-precision esterification and hydrogenation platforms capable of producing synthetic cosmetic actives at reactor scales exceeding 20,000 liters per batch, while achieving purity levels above 99.5% confirmed through validated HPLC and GC analytical methods, ensuring consistent performance across global formulation programs.
By Potency
By potency, standard APIs hold a dominant share of approximately 72% of the market, reflecting their broad applicability across daily-use skincare and dermatological products. These APIs offer a balanced profile of efficacy, safety, and formulation flexibility, making them suitable for moisturizers, sunscreens, and anti-pollution products. High-potent active pharmaceutical ingredients (HPAPIs) remain niche, primarily used in targeted dermatological treatments. The dominance of standard APIs is driven by higher production volumes, lower manufacturing complexity, and widespread acceptance in both prescription-linked and over-the-counter cosmeceutical formulations.
- For instance, Estée Lauder Inc. has disclosed that its global R&D and manufacturing network supports standardized cosmetic active production across more than 25 dedicated formulation and testing laboratories, with validated analytical platforms capable of detecting active ingredient stability and degradation at concentrations as low as 0.001 milligrams per gram, ensuring reproducible performance across high-volume skincare product lines.
By Manufacturing Type
By manufacturing type, in-house production leads the cosmeceutical API market with an estimated 64% market share. Companies favor in-house manufacturing to maintain tighter control over quality, intellectual property, and formulation confidentiality. This approach supports faster product development cycles and better alignment between API design and finished formulation requirements. Large cosmeceutical and dermatology players leverage existing infrastructure and technical expertise to reduce dependency on external suppliers. While outsourcing is growing for cost optimization, in-house manufacturing remains dominant due to strategic control and quality assurance priorities.
Key Growth Drivers
Rising Demand for Evidence-Based Cosmetic Formulations
The cosmeceutical API market benefits strongly from rising consumer demand for clinically supported cosmetic products that deliver measurable skin benefits. Dermatologist-endorsed formulations and science-backed claims have accelerated the adoption of APIs with proven efficacy, such as retinoids, peptides, and antioxidant actives. Brand owners increasingly invest in standardized, high-purity APIs to ensure reproducibility, safety, and regulatory compliance. This shift from traditional cosmetics to performance-oriented cosmeceuticals drives sustained demand for pharmaceutical-grade ingredients across skincare, anti-aging, and dermatology-linked applications.
- For instance, Sabinsa has developed and commercialized cosmeceutical-grade botanical actives manufactured in facilities that process over 600 metric tons of standardized plant extracts annually, supported by more than 120 published clinical studies, while its in-house laboratories routinely achieve marker-compound standardization accuracy down to microgram-per-gram levels using validated HPLC and LC-MS systems, ensuring consistent clinical performance across global cosmetic formulations.
Expansion of Dermatology-Focused and Premium Skincare Brands
The rapid expansion of dermatology-driven, premium, and physician-dispensed skincare brands is a major growth catalyst. These brands emphasize therapeutic positioning, requiring APIs with higher potency, validated bioavailability, and consistent quality. As clinical skincare penetrates mass-premium and e-commerce channels, API suppliers benefit from increased volume demand and long-term supply contracts. Growth is further supported by rising disposable incomes and greater willingness to pay for high-efficacy products, particularly in anti-aging, pigmentation control, and acne management segments.
- For instance, Beiersdorf AG operates advanced skin research and formulation centers where encapsulation technologies such as lipid-based carrier systems are engineered at particle sizes below 200 nanometers, and its Hamburg research hub conducts more than 1,500 skin-related studies annually using over 600,000 biological samples, enabling precise optimization of API stability, penetration depth, and functional performance across its dermatological and dermocosmetic product platforms.
Advancements in API Manufacturing and Formulation Technologies
Technological progress in API synthesis, fermentation, and purification is improving yield, scalability, and cost efficiency. Innovations such as biotechnological production routes, green chemistry, and enhanced encapsulation technologies enable safer and more stable cosmeceutical actives. These advancements expand the addressable API portfolio while supporting regulatory acceptance and sustainability goals. Improved manufacturing precision also enables customization of APIs for specific skin conditions, strengthening partnerships between ingredient manufacturers and cosmetic formulators.
Key Trends & Opportunities
Shift Toward Biotech and Fermentation-Derived APIs
A notable trend is the shift from purely synthetic actives toward biotech-derived and fermentation-based APIs. These ingredients offer improved skin compatibility, traceability, and sustainability, aligning with clean-beauty and ESG priorities. Biotech APIs such as bio-identical peptides, hyaluronic acid, and post-biotic actives provide consistent quality and scalable production. This trend creates strong opportunities for API manufacturers with bioprocessing expertise to differentiate through innovation and secure premium pricing.
- For instance, Procter & Gamble operates large-scale fermentation and biotechnology platforms across its global R&D network, with pilot and commercial fermenters exceeding 100,000 liters and downstream purification systems capable of achieving endotoxin levels below 0.05 EU/mL, while its biotech ingredient programs are supported by more than 3,000 active patents and patent applications, enabling reproducible production of high-purity bio-derived cosmetic actives for global skincare brands.
Growing Demand for High-Potency and Targeted APIs
Demand is increasing for high-potency APIs designed for targeted dermatological outcomes, including hyperpigmentation, photoaging, and barrier repair. Brands increasingly seek APIs that deliver efficacy at lower dosages while meeting safety thresholds. This trend favors suppliers with capabilities in HPAPI handling, advanced purification, and stability optimization. Targeted APIs also enable product differentiation, supporting higher margins and faster adoption in clinical and professional skincare channels.
- For instance, Kao Corporation has developed proprietary high-potency biofunctional actives through its Skin Research Institute, supported by more than 80 dedicated skin scientists, where controlled manufacturing environments handle actives with specification limits measured at microgram-per-gram levels.
Emerging Market Expansion and Localized Formulations
Emerging markets present strong growth opportunities as skincare awareness and dermatological care adoption rise. Local brands increasingly incorporate advanced cosmeceutical APIs to compete with global players. This creates opportunities for regional API manufacturing, customized formulations, and cost-optimized supply chains tailored to local regulatory and climatic needs, supporting long-term market penetration.
Key Challenges
Regulatory Complexity and Compliance Burden
The cosmeceutical API market faces challenges from fragmented and evolving regulatory frameworks across regions. APIs positioned at the intersection of cosmetics and pharmaceuticals require extensive safety documentation, stability data, and quality controls. Differences in permissible concentrations and claims increase compliance costs and lengthen product development timelines. Smaller manufacturers may struggle to meet stringent standards, limiting market entry and slowing innovation despite strong demand fundamentals.
Cost Pressures and Supply Chain Volatility
Rising raw material costs, energy prices, and logistics disruptions pose ongoing challenges for API manufacturers. High-purity and biotech-derived APIs require capital-intensive production processes, increasing cost sensitivity. Additionally, dependence on specialized intermediates and limited supplier bases can create supply risks. Managing cost efficiency while maintaining consistent quality and regulatory compliance remains critical for sustaining profitability and long-term customer relationships.
Regional Analysis
North America
North America leads the global cosmeceutical API market with an estimated 34% share, driven by strong demand for clinically validated skincare products and a mature dermatology ecosystem. The region benefits from high consumer awareness, premium skincare spending, and the presence of leading cosmetic and pharmaceutical brands that prioritize pharmaceutical-grade APIs. Robust regulatory frameworks encourage the use of standardized, high-purity ingredients, supporting consistent demand. Additionally, advanced R&D infrastructure and close collaboration between API manufacturers and formulators accelerate innovation in anti-aging, acne, and pigment-correction applications.
Europe
Europe accounts for approximately 29% of the cosmeceutical API market, supported by stringent quality standards and a strong preference for science-backed and sustainable ingredients. The region emphasizes regulatory compliance, safety, and traceability, driving demand for well-documented APIs. Growth is reinforced by strong dermatological research, premium skincare brands, and rising adoption of biotech-derived actives. Clean beauty trends and restrictions on certain synthetic ingredients further support innovation in bio-based and fermentation-derived APIs, positioning Europe as a key hub for high-value cosmeceutical ingredient development.
Asia-Pacific
Asia-Pacific holds an estimated 28% market share and represents the fastest-growing regional market. Rapid urbanization, increasing disposable incomes, and strong beauty consciousness drive high demand for cosmeceutical formulations. Countries across the region actively adopt advanced APIs for skin brightening, anti-aging, and barrier repair products. Local manufacturers increasingly integrate pharmaceutical-grade APIs to compete with global brands, while strong manufacturing capabilities support cost-efficient production. The region’s dynamic e-commerce landscape further accelerates product launches and API consumption across mass-premium and clinical skincare segments.
Latin America
Latin America accounts for roughly 5% of the global cosmeceutical API market, supported by growing skincare awareness and expanding middle-class populations. Demand is rising for APIs used in anti-aging, sun protection, and skin-repair formulations, reflecting regional climatic conditions. While the market remains price-sensitive, increasing penetration of dermocosmetic brands and professional skincare channels supports gradual adoption of higher-quality APIs. Regulatory harmonization efforts and investments in local manufacturing are improving market access, creating opportunities for regional and international API suppliers.
Middle East & Africa
The Middle East & Africa region represents about 4% of the cosmeceutical API market, with growth driven by rising dermatology awareness and premium skincare consumption in urban centers. Demand is particularly strong for APIs addressing hyperpigmentation, sun damage, and skin hydration. Although overall market size remains smaller, improving healthcare infrastructure and expanding retail distribution support steady growth. Dependence on imported APIs remains high, creating opportunities for global suppliers to establish partnerships and tailored offerings aligned with regional skin-care needs and regulatory requirements.
Cosmeceutical API Market Segmentations:
By Type:
- Synthetic
- Biotech
By Potency:
- Standard API
- HPAPI
By Manufacturing Type:
- In-house
- Outsourced
By Geography
- North America
- U.S.
- Canada
- Mexico
- Europe
- Germany
- France
- U.K.
- Italy
- Spain
- Rest of Europe
- Asia Pacific
- China
- Japan
- India
- South Korea
- South-east Asia
- Rest of Asia Pacific
- Latin America
- Brazil
- Argentina
- Rest of Latin America
- Middle East & Africa
- GCC Countries
- South Africa
- Rest of the Middle East and Africa
Key Player Analysis
- Croda International Plc
- Estee Lauder Inc.
- Sabinsa
- Beiersdorf AG
- Procter & Gamble
- Kao Corporation
- AbbVie Inc.
- L’Oreal S.A.
- Johnson & Johnson Services, Inc.
- Unilever
Recent Developments
- In June 2025, Hikal said that it had successfully cleared the Good Manufacturing Practices (GMP) inspection conducted by the Brazilian Health Regulatory Agency (ANVISA) at its API manufacturing unit in Jigani, Bengaluru, Karnataka.
- In June 2025, Natco Pharma Ltd. reported that its active pharmaceutical ingredient manufacturing facility in Mekaguda, Hyderabad, received one observation from the US Food and Drug Administration, which conducted an investigation.]
- In November 2024, Sebamed, a German skincare brand, launched 'Project Skin Deep' in India to enhance consumer understanding of skin health. The initiative features detailed imagery of skin layers, emphasizing the importance of pH-balanced formulations for overall skin wellness.
- In November 2024, Himalaya Wellness launched a new campaign promoting its Pollution Detox Charcoal range to enhance urban skin health amidst rising pollution levels. This initiative includes a face wash, scrub, and pack specifically formulated for urban consumers.
Report Coverage
The research report offers an in-depth analysis based on Type, Potency, Manufacturing Type and Geography. It details leading market players, providing an overview of their business, product offerings, investments, revenue streams, and key applications. Additionally, the report includes insights into the competitive environment, SWOT analysis, current market trends, as well as the primary drivers and constraints. Furthermore, it discusses various factors that have driven market expansion in recent years. The report also explores market dynamics, regulatory scenarios, and technological advancements that are shaping the industry. It assesses the impact of external factors and global economic changes on market growth. Lastly, it provides strategic recommendations for new entrants and established companies to navigate the complexities of the market.
Future Outlook
- Clinical validation and evidence-based efficacy will increasingly define API selection and product differentiation.
- Biotech-derived and fermentation-based APIs will gain wider adoption due to consistency, safety, and sustainability advantages.
- Demand for multifunctional APIs addressing aging, sensitivity, pigmentation, and barrier repair will continue to expand.
- Regulatory harmonization and stricter compliance requirements will drive higher investment in documentation and safety testing.
- Sustainable sourcing and green chemistry practices will become standard expectations across the API value chain.
- Integration of digital tools and AI-driven screening will accelerate active ingredient discovery and optimization.
- Customized and region-specific APIs will grow in importance to address diverse skin types and climatic conditions.
- Strategic collaborations between ingredient developers and brand owners will intensify to shorten innovation cycles.
- Advanced delivery technologies will enhance bioavailability and performance of cosmeceutical APIs.
- Emerging markets will see faster adoption of premium cosmeceutical actives supported by rising dermatological awareness.
Request a Free Sample
Fill in your details and we'll send you a free sample report.
- Sample data tables & charts
- Research methodology
Need a Custom Version of This Report?
Tailor the scope, geography, or segments to your exact requirements.
- Custom geography or segment scope
- Direct access to our analyst team
Frequently Asked Questions
What is the current market size for the Cosmeceutical API Market, and what is its projected size in 2032?
At what Compound Annual Growth Rate is the Cosmeceutical API Market projected to grow between 2024 and 2032?
Which Cosmeceutical API Market segment held the largest share in 2024?
What are the primary factors fueling the growth of the Cosmeceutical API Market?
Who are the leading companies in the Cosmeceutical API Market?
Which region commanded the largest share of the Cosmeceutical API Market in 2024?
Table of Content
Chapter 1. Report Introduction
- 1.1 Report Description & Purpose
- 1.1.1 Report Title & Market Definition
- 1.1.2 Unique Selling Propositions (USP) & Key Differentiators
- 1.1.3 Value Proposition for Stakeholders
- 1.2 Research Objectives
- 1.2.1 Market Sizing Objectives (Volume & Revenue)
- 1.2.2 Segmentation Objectives
- 1.2.3 Competitive Intelligence Objectives
- 1.2.4 Forecast & Scenario Objectives
- 1.3 Report Scope
- 1.3.1 Cosmeceutical API Scope – Types & Subtypes Covered
- 1.3.2 Geographic Scope – Regions & Countries Covered
- 1.3.3 Historical Period, Base Year & Forecast Period (2024; forecast to 2032)
- 1.3.4 Inclusions & Exclusions
- 1.4 HS Code & Classification Framework
- 1.5 Currency, Units & Pricing Basis
- 1.6 Target Stakeholders
- 1.7 Limitations & Assumptions
Chapter 2. Executive Summary
- 2.1 Global Cosmeceutical API Market Snapshot
- 2.1.1 Market Size – Historical (2024) & Forecast (2024-2032) (2024: USD 12,448.6 million → 2032: USD 19,543.66 million)
- 2.1.2 Volume & Revenue – Global Totals
- 2.1.3 Key Market Highlights – Top Five Facts
- 2.2 Cosmeceutical API Market Segmentation Snapshot
- 2.2.1 Market Split by Region – 2024 vs. 2032
- 2.3 Competitive Snapshot
- 2.3.1 Top 10 Players by Revenue Share – 2024
- 2.3.2 Top 10 Players by Volume Share – 2024
- 2.3.3 Recent Strategic Developments (18-Month Summary)
- 2.4 Key Investment Highlights & Strategic Conclusions
Chapter 3. Cosmeceutical API Market Dynamics & Industry Analysis
- 3.1 Market Overview & Context
- 3.1.1 Cosmeceutical API Market Position in the Broader Automotive Value Chain
- 3.1.2 OEM vs. Replacement Market Dynamics
- 3.1.3 Market Maturity & Development Stage by Region
- 3.2 Cosmeceutical API Market Drivers
- 3.3 Cosmeceutical API Market Restraints & Challenges
- 3.4 Cosmeceutical API Market Opportunities
- 3.5 Porter's Five Forces Analysis
- 3.5.1 Threat of New Entrants
- 3.5.2 Bargaining Power of Suppliers
- 3.5.3 Bargaining Power of Buyers
- 3.5.4 Threat of Substitutes
- 3.5.5 Competitive Rivalry – Intensity Assessment
- 3.6 Cosmeceutical API Value Chain Analysis
- 3.6.1 Upstream – Raw Material/Input Suppliers
- 3.6.1.1 Raw Material/Input 1
- 3.6.1.2 Raw Material/Input 2
- 3.6.1.3 Raw Material/Input 3
- 3.6.2 Midstream – Production/Manufacturing/Service Delivery
- 3.6.2.1 Production/Process Overview
- 3.6.2.2 Key Facility Locations & Capacity by Manufacturer
- 3.6.3 Downstream – Distribution & End Consumer
- 3.6.3.1 Primary Channel – B2B/OEM
- 3.6.3.2 Secondary Channels – Dealer, Retail, Online, Direct
- 3.6.4 Value Chain Profitability Analysis
- 3.6.1 Upstream – Raw Material/Input Suppliers
- 3.7 PESTEL Analysis
- 3.7.1 Political Factors
- 3.7.2 Economic Factors
- 3.7.3 Social Factors
- 3.7.4 Technological Factors
- 3.7.5 Environmental Factors
- 3.7.6 Legal Factors
- 3.8 Cosmeceutical API Supply Chain Analysis
- 3.8.1 Raw Material/Input Supply Risk Assessment
- 3.8.2 Manufacturing Concentration Risk (Geographic Exposure)
- 3.8.3 Trade Disruption Impact Analysis
- 3.9 Regulatory & Policy Landscape
Note: The regulatory and policy landscape section covers regulations based on their applicability to the market, Cosmeceutical API category, geography, and scope of the study. Only regulatory frameworks with a material impact on operations, compliance, trade, sustainability, or market access are analyzed in detail.
Chapter 4. Key Investment Pockets & Opportunity Analysis
- 4.1 Cosmeceutical API Market Attractiveness Analysis
- 4.1.1 By Region – Investment Attractiveness Matrix (Volume × CAGR)
- 4.2 Absolute Revenue Growth Opportunity
- 4.2.1 By Region – Absolute USD Growth Through 2032
- 4.3 Incremental Volume Opportunity
- 4.3.1 By Region – Incremental Volume Through 2032
- 4.3.2 Segment – Incremental Volume
- 4.4 Emerging Submarket Opportunity Deep Dive (Subject to Applicability)
- 4.5 Emerging Market Opportunity Scorecards
- 4.5.1 United States
- 4.5.2 Europe
- 4.5.3 Asia
- 4.5.4 Middle East & Africa
Note: Emerging Market Opportunity Scorecards will be included based on relevance and strategic importance. Regions listed are indicative and may vary depending on data availability and market dynamics.
Chapter 5. Cosmeceutical API Import-Export Analysis & Trade Flows
- 5.1 Global Trade Overview
- 5.1.1 Global Export Value by Country (2024)
- 5.1.2 Global Export Volume by Country (2024)
- 5.1.3 Global Import Value by Country (2024)
- 5.1.4 Global Import Volume by Country (2024)
- 5.1.5 Net Trade Balance by Country (2024)
- 5.2 Export Analysis – Segment
- 5.2.1 Type 1 (HS Code)
- 5.2.2 Type 2 (HS Code)
- 5.2.3 Type 3 (HS Code)
- 5.2.4 Type 4 (HS Code)
- 5.2.5 Type 5 (HS Code)
- 5.3 Import Analysis – Segment
- 5.3.1 Type 1 (HS Code)
- 5.3.2 Type 2 (HS Code)
- 5.3.3 Type 3 (HS Code)
- 5.3.4 Type 4 (HS Code)
- 5.3.5 Type 5 (HS Code)
- 5.4 Average Unit Trade Prices
- 5.4.1 Average Export Price – Segment & Country
- 5.4.2 Average Import Price – Segment & Source Country
- 5.4.3 Price Trends (2024)
- 5.5 Key Trade Route Analysis
- 5.5.1 Trade Route 1
- 5.5.2 Trade Route 2
- 5.5.3 Trade Route 3
- 5.5.4 Trade Route 4
- 5.5.5 Trade Route 5
- 5.6 Trade Policy Impact Assessment
- 5.6.1 US Anti-Dumping & Section 301 Tariffs
- 5.6.2 EU Customs Union Impact
- 5.6.3 Major Free Trade Agreements
- 5.6.4 USMCA Rules of Origin
Note: Trade policy analysis will be included only where relevant to the Cosmeceutical API market.
Chapter 6. Competitive Landscape & Company Benchmarking
- 6.1 Cosmeceutical API Market Concentration & Structure
- 6.1.1 Herfindahl-Hirschman Index (HHI) – vs. 2024
- 6.1.2 Tier 1, Tier 2 & Tier 3 Market Structure
- 6.1.3 Global, Regional & Local Player Dynamics
- 6.2 Cosmeceutical API Market Share Analysis – 2024
- 6.2.1 Global Revenue Share by Company
- 6.2.2 Global Volume Share by Company
- 6.2.3 Regional Revenue Share
- 6.2.4 Market Share Evolution ( vs. 2024)
- 6.2.5 OEM Segment Share by Company
- 6.2.6 Replacement Segment Share by Company
- 6.3 Production/Delivery Capacity & Facility Analysis
- 6.3.1 Global Installed Capacity
- 6.3.2 Capacity Utilization Rates
- 6.3.3 Production/Output Volume
- 6.3.4 Facility Locations & Capacity Map
- 6.3.5 Planned Capacity Additions
- 6.4 Cosmeceutical API Competitive Benchmarking Matrix
- 6.4.1 Revenue, Volume, CAGR & Profitability Comparison
- 6.4.2 Channel Revenue Mix
- 6.4.3 Geographic Revenue Exposure
- 6.4.4 R&D Intensity
- 6.4.5 Sustainability Maturity
- 6.5 Strategic Developments in Cosmeceutical API (Last 24 Months)
- 6.5.1 Mergers, Acquisitions & Divestments
- 6.5.2 New Cosmeceutical API Launches
- 6.5.3 Facility Expansions
- 6.5.4 Strategic Alliances, Joint Ventures & Partnerships
- 6.5.5 Distribution Expansion & Market Entry
- 6.5.6 Sustainability & ESG Initiatives
- 6.6 Competitive Strategy Mapping
- 6.6.1 Leader, Challenger, Follower & Niche Classification
- 6.6.2 Pricing Strategy Comparison
- 6.6.3 Channel Strategy Matrix
Note: Strategic developments are included based on their materiality and the availability of reliable information.
Chapter 7. Global Cosmeceutical API Market – By Distribution Channel
- 7.1 Segment Overview
- 7.1.1 Volume & Revenue Split by Channel (2024 & 2032)
- 7.1.2 Channel Mix Evolution (2024-2032)
Chapter 8. Regional Market Analysis – Global Overview
- 8.1 Global Regional Overview
- 8.1.1 Regional Volume Share
- 8.1.2 Regional Revenue Share
- 8.1.3 Regional Volume by Region
- 8.1.4 Regional Revenue by Region
- 8.1.5 Regional Forecast Through 2032
- 8.2 Cross-Regional Segment Analysis
- 8.2.1 By Distribution Channel
- 8.2.2 By Brand/Price Tier
Chapter 9. North America Cosmeceutical API Market
- 9.1 United States
- 9.2 Canada
- 9.3 Mexico
Chapter 10. Europe Cosmeceutical API Market
- 10.1 Germany
- 10.2 France
- 10.3 Italy
- 10.4 United Kingdom
- 10.5 Spain
- 10.6 Poland
- 10.7 Russia
- 10.8 Netherlands
- 10.9 Belgium
- 10.10 Sweden
- 10.11 Denmark
- 10.12 Norway
- 10.13 Rest of Europe
Chapter 11. Asia Pacific Cosmeceutical API Market
- 11.1 China
- 11.2 India
- 11.3 Japan
- 11.4 South Korea
- 11.5 Thailand
- 11.6 Indonesia
- 11.7 Vietnam
- 11.8 Malaysia
- 11.9 Australia
- 11.10 Rest of Asia Pacific
Chapter 12. Latin America Cosmeceutical API Market
- 12.1 Brazil
- 12.2 Argentina
- 12.3 Colombia
- 12.4 Chile
- 12.5 Rest of Latin America
Chapter 13. Middle East Cosmeceutical API Market
- 13.1 Saudi Arabia
- 13.2 United Arab Emirates
- 13.3 Turkey
- 13.4 Israel
- 13.5 Iran
- 13.6 Rest of the Middle East
Chapter 14. Africa Cosmeceutical API Market
- 14.1 South Africa
- 14.2 Egypt
- 14.3 Nigeria
- 14.4 Morocco
- 14.5 Rest of Africa
Chapter 15. Cosmeceutical API Company Profiles
- 15.1 [Company 01]
- 15.1.1 Company Overview
- 15.1.2 Key Management Personnel
- 15.1.3 Products & Services Portfolio
- 15.1.4 Financial Performance
- 15.1.5 Key Market Focus & Geographic Presence
- 15.1.6 Recent Developments & Strategic Initiatives
Note: The company profile list is preliminary and may change based on research findings, market developments, data availability, and client requirements.
Chapter 16. Appendices
- Appendix A – List of Abbreviations & Acronyms
- Appendix B – Industry Classification Code Reference – Full Series
- Appendix C – Production & Capacity Data Tables
- Appendix D – End-Use & Demand Base Tables
- Appendix E – Consumption & Replacement Rate Assumptions
- Appendix F – ASP Reference Tables
- Appendix G – Manufacturing & Facility Database
- Appendix H – Import-Export Data Tables
- Appendix I – Regulatory Summary Tables
- Appendix J – Primary Research Participant List (Anonymized)
- Appendix K – Primary Research Questionnaire Framework
- Appendix L – Data Sources & Bibliography
- Appendix M – Market Size Divergence & Source Comparison
Chapter 17. Research Methodology
- 17.1 Research Framework & Philosophy
- 17.2 Secondary Research – Sources, Hierarchy & Data Extraction
- 17.3 Data Modeling – Bottom-Up & Top-Down Market Sizing
- 17.4 Primary Research – Stakeholder Framework, LOI & Sample Sizes
- 17.5 Forecast Methodology – Regression, Scenario & Sensitivity Analysis
- 17.6 Quality Control – Four-Layer Validation Framework
- 17.7 Limitations & Standard Assumptions
- 17.8 Disclaimer
