
Surface Water Sports Equipment Market Overview:
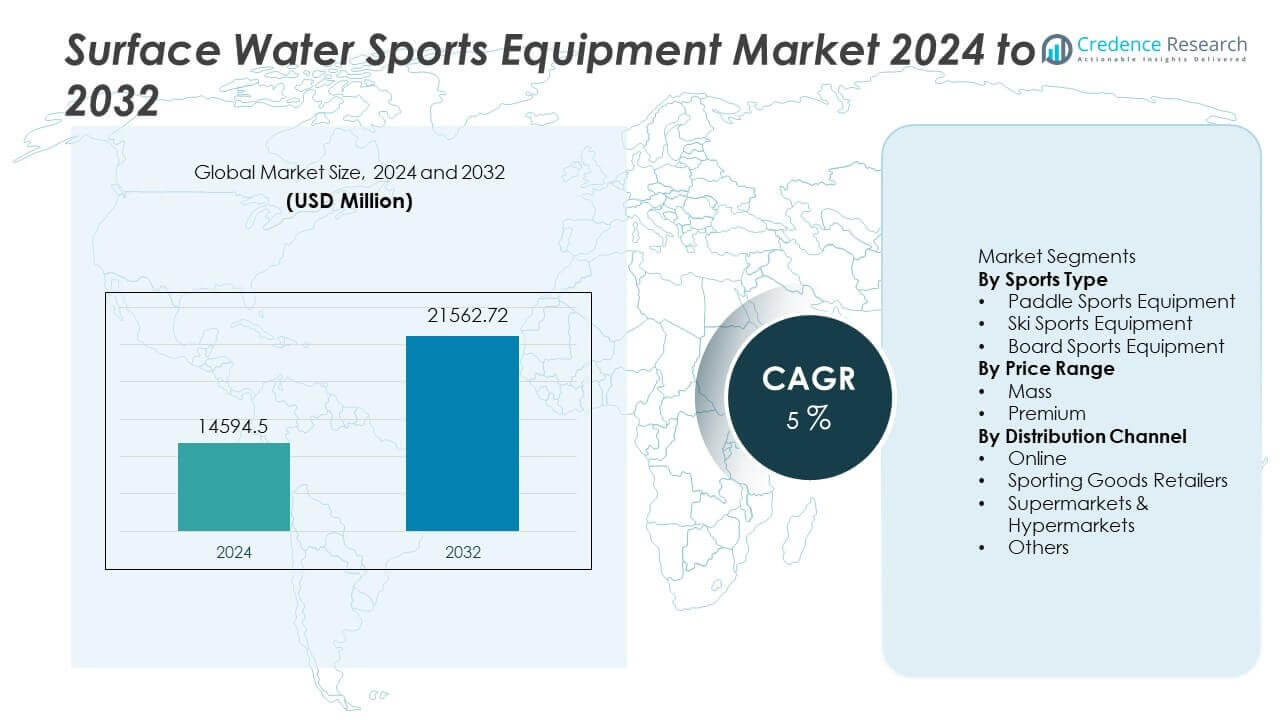
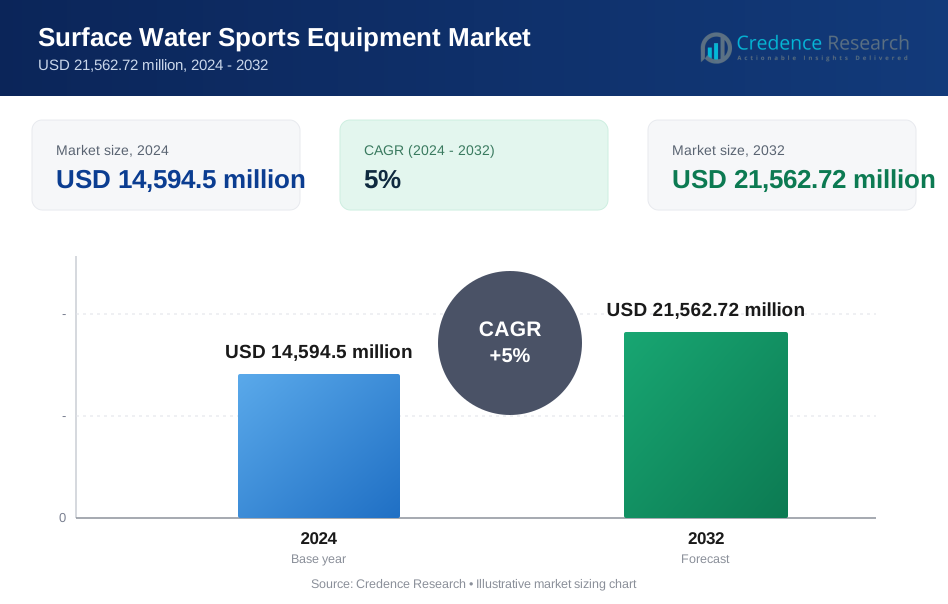
The surface water sports equipment market was valued at USD 14,594.5 million in 2024 and is expected to reach USD 21,562.72 million by 2032, growing at a CAGR of 5% during the forecast period.
| REPORT ATTRIBUTE | DETAILS |
|---|---|
| Historical Period | 2020-2023 |
| Base Year | 2024 |
| Forecast Period | 2025-2032 |
| Surface Water Sports Equipment Market Size 2024 | USD 14,594.5 million |
| Surface Water Sports Equipment Market, CAGR | 5% |
| Surface Water Sports Equipment Market Size 2032 | USD 21,562.72 million |
Surface Water Sports Equipment Market Insights
- Growing interest in outdoor recreation and water-based fitness acts as a key market driver, with paddle sports equipment leading the sports type segment at a 42% share due to ease of use and wide appeal.
- Major market trends include strong demand for mass-priced products, which hold a 63% share, driven by affordability and high adoption among recreational and first-time users.
- Competitive analysis shows a fragmented market with global and regional players competing through product innovation, retail reach, and direct-to-consumer strategies.
- Regional analysis indicates North America leads with a 33% market share, followed by Asia Pacific at 28%, Europe at 26%, Latin America at 7%, and the Middle East and Africa at 6%.
Surface Water Sports Equipment Market Segmentation Analysis:
By Sports Type
By sports type, paddle sports equipment dominates the surface water sports equipment market with a 42% market share, driven by strong participation in kayaking, canoeing, and stand-up paddleboarding. These activities appeal to a wide age group due to ease of learning and suitability for recreational use. Growing tourism activities and water-based leisure programs further support demand. Lightweight materials and inflatable designs improve portability and storage, encouraging first-time buyers. Ski sports equipment follows, supported by coastal and lake-based recreation hubs, while board sports equipment maintains steady demand from surfing and wakeboarding enthusiasts seeking performance-driven products.
- For instance, Decathlon launched inflatable stand-up paddleboards with a board weight of 8.5 kilograms, supporting easy transport and storage.
By Price Range
By price range, the mass segment leads with a 63% market share, supported by high-volume sales among recreational users and beginners. Affordable pricing improves accessibility across emerging and developed markets. Mass products benefit from standard designs, durable materials, and wide retail availability. Growing participation in casual water sports drives repeat purchases in this segment. The premium segment holds a smaller share but shows strong value growth, driven by demand for advanced materials, enhanced safety features, and professional-grade performance equipment preferred by experienced users and competitive athletes.
- For instance, Kent Outdoors reported a steady demand for mass-range towable tubes and skis, reflecting continued interest and strong activity among casual water sports enthusiasts.
By Distribution Channel
By distribution channel, sporting goods retailers hold the largest share at 39%, supported by in-store product trials, expert guidance, and strong brand presence. Consumers prefer physical stores for equipment fitting and performance comparison. Online channels follow closely, driven by convenience, wider product selection, and competitive pricing. E-commerce platforms benefit from growing digital adoption and direct-to-consumer strategies by brands. Supermarkets and hypermarkets capture demand for entry-level and seasonal products, while other channels, including specialty stores and rental outlets, support localized and tourism-driven sales.
Key Growth Drivers
Rising Participation in Recreational and Adventure Water Sports
Growing interest in outdoor recreation strongly drives the surface water sports equipment market. Consumers increasingly participate in kayaking, paddleboarding, surfing, and water skiing as lifestyle activities. Tourism operators promote water sports to enhance visitor experiences, increasing equipment demand. Youth engagement and family-oriented recreation further expand participation. Improved access to lakes, rivers, and coastal areas supports growth. Entry-level equipment designs reduce skill barriers, encouraging first-time users. This driver remains strong as consumers seek active leisure options that combine fitness, adventure, and social experiences.
- For instance, Johnson Outdoors marketed a range of recreational kayaks under the Old Town brand in 2024, though the segment faced a broader market slowdown and increased competition that impacted overall sales performance.
Expansion of Water Tourism and Coastal Infrastructure
Investment in water tourism infrastructure supports market growth. Coastal destinations, resorts, and inland water recreation parks continue to expand. Governments and private operators develop marinas, water sports zones, and safety facilities. Rental services and training centers increase equipment turnover and replacement demand. Organized water sports events and festivals further promote participation. This driver benefits both recreational and professional segments. Growth in domestic tourism strengthens demand, especially in regions with abundant natural water resources and favorable climate conditions.
- For instance, Marine Products Corporation manufactures Chaparral and Robalo boats, which are distributed to a network of independent dealers serving recreational boaters and seasonal resort markets.
Growing Awareness of Health, Fitness, and Wellness Activities
Health-conscious consumers increasingly adopt water sports as low-impact fitness activities. Paddle sports and board sports offer cardiovascular benefits while reducing joint stress. Wellness-focused lifestyles encourage regular participation across age groups. Schools and community programs promote water-based activities, supporting early adoption. Equipment manufacturers respond with ergonomic designs and lightweight materials to improve comfort. This driver supports consistent demand growth as fitness and mental well-being gain priority in consumer lifestyle choices.
Key Trends and Opportunities
Product Innovation Using Lightweight and Durable Materials
Material innovation creates strong growth opportunities. Manufacturers increasingly use carbon fiber, reinforced plastics, and advanced composites to improve performance and durability. Lightweight designs enhance portability and ease of use. Inflatable and foldable equipment gains popularity among urban users with storage constraints. Enhanced safety features and ergonomic improvements attract new users. Innovation-driven differentiation allows brands to target both mass and premium segments, strengthening competitive positioning and customer loyalty.
- For instance, Belassi GmbH integrates carbon fiber components in its Burrasca watercraft, significantly reducing the overall mass while maintaining high structural strength.
Growth of E-Commerce and Direct-to-Consumer Sales
Digital channels create new opportunities for market expansion. Online platforms offer wider product selection and price transparency. Brands use direct-to-consumer models to improve margins and customer engagement. Virtual product demonstrations and reviews support informed purchasing decisions. E-commerce adoption increases accessibility in remote regions. Seasonal promotions and bundled offerings drive online sales. This trend supports faster market penetration and strengthens brand-consumer relationships.
- For instance, Escalade Inc. reported growth in its e-commerce sales channel within its water sports equipment category, supported by expanded digital outreach and optimized fulfillment capacity.
Key Challenges
Seasonal Demand and Weather Dependency
The market faces strong seasonality challenges. Surface water sports rely heavily on favorable weather and climate conditions. Off-season periods reduce sales volumes and affect inventory planning. Regional climate variations create uneven demand patterns. Manufacturers and retailers must manage supply chain efficiency and storage costs. This challenge impacts cash flow and revenue predictability, especially for smaller players with limited geographic diversification.
High Equipment Costs and Safety Regulations
High-quality equipment involves significant material and manufacturing costs. Premium products may limit affordability for price-sensitive consumers. Safety regulations and certification requirements increase compliance expenses. Consumers also face costs related to safety gear and training. These factors can slow adoption in emerging markets. Balancing safety, performance, and cost remains a critical challenge for manufacturers seeking broader market reach.
Regional Analysis
North America
North America holds 33% market share in the surface water sports equipment market, supported by high participation in recreational and adventure water sports. Strong presence of lakes, rivers, and coastal areas drives demand for paddle, board, and ski sports equipment. Consumers actively invest in premium and mass products for leisure and fitness activities. Well-developed retail networks and strong online penetration support product accessibility. Organized water sports events and rental services further boost equipment sales. High disposable income and strong outdoor culture continue to support steady replacement demand and innovation-driven purchases.
Europe
Europe accounts for 26% market share, driven by strong water sports participation across coastal and inland regions. Countries with extensive shorelines and lake systems support demand for paddleboarding, kayaking, and surfing equipment. Tourism-focused economies promote water-based recreation, increasing equipment usage. Environmental awareness encourages durable and high-quality product adoption. Sporting goods retailers play a key role in distribution, while online channels gain traction. Government-supported outdoor activity programs and growing interest in wellness-based recreation sustain long-term market growth across the region.
Asia Pacific
Asia Pacific commands 28% market share, supported by rising disposable income, expanding tourism, and growing youth participation in water sports. Coastal countries and island nations drive strong demand for board and paddle sports equipment. Government investments in water tourism infrastructure increase equipment rentals and sales. Urban consumers show growing interest in recreational fitness activities. Expanding e-commerce platforms improve product access across developing markets. The region benefits from a large population base, favorable climate conditions, and increasing adoption of organized water sports activities.
Latin America
Latin America holds 7% market share, supported by natural water resources and expanding tourism activity. Coastal regions and inland water bodies drive participation in surfing, kayaking, and water skiing. Demand remains concentrated in tourist hubs and urban centers. Local sporting events and water sports schools support entry-level equipment sales. Price sensitivity favors mass-market products, while premium demand remains limited. Improving retail infrastructure and growing online penetration gradually strengthen market reach across key countries in the region.
Middle East and Africa
The Middle East and Africa represent 6% market share, driven by growing tourism and water-based leisure activities. Coastal destinations and resort developments support demand for recreational water sports equipment. Rental services dominate usage, supporting frequent equipment replacement. Rising investment in marine tourism infrastructure strengthens long-term potential. Consumer demand focuses on entry-level and durable products due to climate conditions. While participation remains limited compared to other regions, expanding leisure tourism and recreational initiatives support gradual market growth.
Surface Water Sports Equipment Market Segmentations:
By Sports Type
- Paddle Sports Equipment
- Ski Sports Equipment
- Board Sports Equipment
By Price Range
- Mass
- Premium
By Distribution Channel
- Online
- Sporting Goods Retailers
- Supermarkets & Hypermarkets
- Others
By Geography
- North America
- U.S.
- Canada
- Mexico
- Europe
- Germany
- France
- U.K.
- Italy
- Spain
- Rest of Europe
- Asia Pacific
- China
- Japan
- India
- South Korea
- South-east Asia
- Rest of Asia Pacific
- Latin America
- Brazil
- Argentina
- Rest of Latin America
- Middle East & Africa
- GCC Countries
- South Africa
- Rest of the Middle East and Africa
Competitive Landscape
Competitive landscape analysis highlights a moderately fragmented surface water sports equipment market led by key players including Belassi GmbH, Blue Sea Watersports, BomBoard LLC, Decathlon SA, Escalade Inc., Imagine Nation Sports LLC, Johnson Outdoors Inc., Kent Water Sports LLC, KJK Sports, and Marine Products Corp. These companies compete through product breadth, pricing strategies, and innovation in materials and design. Established brands leverage strong retail networks and global sourcing to serve mass and premium segments. Product differentiation focuses on lightweight construction, durability, and safety features. Decathlon and Johnson Outdoors benefit from scale and brand reach, while niche players target performance users and rental operators. E-commerce expansion and direct-to-consumer models strengthen margins and customer engagement. Partnerships with resorts, clubs, and tourism operators support steady demand. Seasonal promotions, new model launches, and sustainability-focused materials further shape competitive positioning across regions.
Key Player Analysis
- Johnson Outdoors Inc.
- BomBoard LLC
- Decathlon SA
- Marine Products Corp.
- Imagine Nation Sports LLC
- Belassi GmbH
- KJK Sports
- Escalade Inc.
- Blue Sea Watersports
- Kent Water Sports LLC
Recent Developments
- In June 2025, Decathlon announced a global innovation partnership with Rheon Labs to develop next-generation, performance-driven sports apparel.
- In April 2023, Red Sea Global launched Akun, a new adventure sports company in the Kingdom of Saudi Arabia.
Report Coverage
The research report offers an in-depth analysis based on Sports Type, Price Range, Distribution Channel and Geography. It details leading market players, providing an overview of their business, product offerings, investments, revenue streams, and key applications. Additionally, the report includes insights into the competitive environment, SWOT analysis, current market trends, as well as the primary drivers and constraints. Furthermore, it discusses various factors that have driven market expansion in recent years. The report also explores market dynamics, regulatory scenarios, and technological advancements that are shaping the industry. It assesses the impact of external factors and global economic changes on market growth. Lastly, it provides strategic recommendations for new entrants and established companies to navigate the complexities of the market.
Future Outlook
- Participation in recreational and adventure water sports will continue to increase globally.
- Demand for paddle and board sports equipment will remain strong due to ease of entry.
- Innovation in lightweight and durable materials will enhance product performance.
- Mass-priced equipment will sustain high sales volumes among casual users.
- Premium products will gain traction among professional and performance-focused athletes.
- Growth of water tourism will support rental and replacement equipment demand.
- E-commerce and direct-to-consumer channels will expand market reach.
- Sustainability-focused materials and designs will gain industry attention.
- Emerging markets will see rising adoption supported by tourism development.
- Partnerships with resorts and recreational centers will strengthen long-term demand.
Request a Free Sample
Fill in your details and we'll send you a free sample report.
- Sample data tables & charts
- Research methodology
Need a Custom Version of This Report?
Tailor the scope, geography, or segments to your exact requirements.
- Custom geography or segment scope
- Direct access to our analyst team
Frequently Asked Questions
What is the current market size for the Surface Water Sports Equipment market, and what is its projected size in 2032?
At what Compound Annual Growth Rate is the Surface Water Sports Equipment market projected to grow between 2024 and 2032?
Which Surface Water Sports Equipment market segment held the largest share in 2024?
What are the primary factors fueling the growth of the Surface Water Sports Equipment market?
Who are the leading companies in the Surface Water Sports Equipment market?
Which region commanded the largest share of the Surface Water Sports Equipment market in 2024?
Table of Content
Chapter 1. Report Introduction
- 1.1 Report Description & Purpose
- 1.1.1 Report Title & Market Definition
- 1.1.2 Unique Selling Propositions (USP) & Key Differentiators
- 1.1.3 Value Proposition for Stakeholders
- 1.2 Research Objectives
- 1.2.1 Market Sizing Objectives (Volume & Revenue)
- 1.2.2 Segmentation Objectives
- 1.2.3 Competitive Intelligence Objectives
- 1.2.4 Forecast & Scenario Objectives
- 1.3 Report Scope
- 1.3.1 Surface Water Sports Equipment Scope – Types & Subtypes Covered
- 1.3.2 Geographic Scope – Regions & Countries Covered
- 1.3.3 Historical Period, Base Year & Forecast Period (2024; forecast to 2032)
- 1.3.4 Inclusions & Exclusions
- 1.4 HS Code & Classification Framework
- 1.5 Currency, Units & Pricing Basis
- 1.6 Target Stakeholders
- 1.7 Limitations & Assumptions
Chapter 2. Executive Summary
- 2.1 Global Surface Water Sports Equipment Market Snapshot
- 2.1.1 Market Size – Historical (2024) & Forecast (2024-2032) (2024: USD 14,594.5 million → 2032: USD 21,562.72 million)
- 2.1.2 Volume & Revenue – Global Totals
- 2.1.3 Key Market Highlights – Top Five Facts
- 2.2 Surface Water Sports Equipment Market Segmentation Snapshot
- 2.2.1 Market Split by Region – 2024 vs. 2032
- 2.3 Competitive Snapshot
- 2.3.1 Top 10 Players by Revenue Share – 2024
- 2.3.2 Top 10 Players by Volume Share – 2024
- 2.3.3 Recent Strategic Developments (18-Month Summary)
- 2.4 Key Investment Highlights & Strategic Conclusions
Chapter 3. Surface Water Sports Equipment Market Dynamics & Industry Analysis
- 3.1 Market Overview & Context
- 3.1.1 Surface Water Sports Equipment Market Position in the Broader Automotive Value Chain
- 3.1.2 OEM vs. Replacement Market Dynamics
- 3.1.3 Market Maturity & Development Stage by Region
- 3.2 Surface Water Sports Equipment Market Drivers
- 3.3 Surface Water Sports Equipment Market Restraints & Challenges
- 3.4 Surface Water Sports Equipment Market Opportunities
- 3.5 Porter's Five Forces Analysis
- 3.5.1 Threat of New Entrants
- 3.5.2 Bargaining Power of Suppliers
- 3.5.3 Bargaining Power of Buyers
- 3.5.4 Threat of Substitutes
- 3.5.5 Competitive Rivalry – Intensity Assessment
- 3.6 Surface Water Sports Equipment Value Chain Analysis
- 3.6.1 Upstream – Raw Material/Input Suppliers
- 3.6.1.1 Raw Material/Input 1
- 3.6.1.2 Raw Material/Input 2
- 3.6.1.3 Raw Material/Input 3
- 3.6.2 Midstream – Production/Manufacturing/Service Delivery
- 3.6.2.1 Production/Process Overview
- 3.6.2.2 Key Facility Locations & Capacity by Manufacturer
- 3.6.3 Downstream – Distribution & End Consumer
- 3.6.3.1 Primary Channel – B2B/OEM
- 3.6.3.2 Secondary Channels – Dealer, Retail, Online, Direct
- 3.6.4 Value Chain Profitability Analysis
- 3.6.1 Upstream – Raw Material/Input Suppliers
- 3.7 PESTEL Analysis
- 3.7.1 Political Factors
- 3.7.2 Economic Factors
- 3.7.3 Social Factors
- 3.7.4 Technological Factors
- 3.7.5 Environmental Factors
- 3.7.6 Legal Factors
- 3.8 Surface Water Sports Equipment Supply Chain Analysis
- 3.8.1 Raw Material/Input Supply Risk Assessment
- 3.8.2 Manufacturing Concentration Risk (Geographic Exposure)
- 3.8.3 Trade Disruption Impact Analysis
- 3.9 Regulatory & Policy Landscape
Note: The regulatory and policy landscape section covers regulations based on their applicability to the market, Surface Water Sports Equipment category, geography, and scope of the study. Only regulatory frameworks with a material impact on operations, compliance, trade, sustainability, or market access are analyzed in detail.
Chapter 4. Key Investment Pockets & Opportunity Analysis
- 4.1 Surface Water Sports Equipment Market Attractiveness Analysis
- 4.1.1 By Region – Investment Attractiveness Matrix (Volume × CAGR)
- 4.2 Absolute Revenue Growth Opportunity
- 4.2.1 By Region – Absolute USD Growth Through 2032
- 4.3 Incremental Volume Opportunity
- 4.3.1 By Region – Incremental Volume Through 2032
- 4.3.2 Segment – Incremental Volume
- 4.4 Emerging Submarket Opportunity Deep Dive (Subject to Applicability)
- 4.5 Emerging Market Opportunity Scorecards
- 4.5.1 United States
- 4.5.2 Europe
- 4.5.3 Asia
- 4.5.4 Middle East & Africa
Note: Emerging Market Opportunity Scorecards will be included based on relevance and strategic importance. Regions listed are indicative and may vary depending on data availability and market dynamics.
Chapter 5. Surface Water Sports Equipment Import-Export Analysis & Trade Flows
- 5.1 Global Trade Overview
- 5.1.1 Global Export Value by Country (2024)
- 5.1.2 Global Export Volume by Country (2024)
- 5.1.3 Global Import Value by Country (2024)
- 5.1.4 Global Import Volume by Country (2024)
- 5.1.5 Net Trade Balance by Country (2024)
- 5.2 Export Analysis – Segment
- 5.2.1 Type 1 (HS Code)
- 5.2.2 Type 2 (HS Code)
- 5.2.3 Type 3 (HS Code)
- 5.2.4 Type 4 (HS Code)
- 5.2.5 Type 5 (HS Code)
- 5.3 Import Analysis – Segment
- 5.3.1 Type 1 (HS Code)
- 5.3.2 Type 2 (HS Code)
- 5.3.3 Type 3 (HS Code)
- 5.3.4 Type 4 (HS Code)
- 5.3.5 Type 5 (HS Code)
- 5.4 Average Unit Trade Prices
- 5.4.1 Average Export Price – Segment & Country
- 5.4.2 Average Import Price – Segment & Source Country
- 5.4.3 Price Trends (2024)
- 5.5 Key Trade Route Analysis
- 5.5.1 Trade Route 1
- 5.5.2 Trade Route 2
- 5.5.3 Trade Route 3
- 5.5.4 Trade Route 4
- 5.5.5 Trade Route 5
- 5.6 Trade Policy Impact Assessment
- 5.6.1 US Anti-Dumping & Section 301 Tariffs
- 5.6.2 EU Customs Union Impact
- 5.6.3 Major Free Trade Agreements
- 5.6.4 USMCA Rules of Origin
Note: Trade policy analysis will be included only where relevant to the Surface Water Sports Equipment market.
Chapter 6. Competitive Landscape & Company Benchmarking
- 6.1 Surface Water Sports Equipment Market Concentration & Structure
- 6.1.1 Herfindahl-Hirschman Index (HHI) – vs. 2024
- 6.1.2 Tier 1, Tier 2 & Tier 3 Market Structure
- 6.1.3 Global, Regional & Local Player Dynamics
- 6.2 Surface Water Sports Equipment Market Share Analysis – 2024
- 6.2.1 Global Revenue Share by Company
- 6.2.2 Global Volume Share by Company
- 6.2.3 Regional Revenue Share
- 6.2.4 Market Share Evolution ( vs. 2024)
- 6.2.5 OEM Segment Share by Company
- 6.2.6 Replacement Segment Share by Company
- 6.3 Production/Delivery Capacity & Facility Analysis
- 6.3.1 Global Installed Capacity
- 6.3.2 Capacity Utilization Rates
- 6.3.3 Production/Output Volume
- 6.3.4 Facility Locations & Capacity Map
- 6.3.5 Planned Capacity Additions
- 6.4 Surface Water Sports Equipment Competitive Benchmarking Matrix
- 6.4.1 Revenue, Volume, CAGR & Profitability Comparison
- 6.4.2 Channel Revenue Mix
- 6.4.3 Geographic Revenue Exposure
- 6.4.4 R&D Intensity
- 6.4.5 Sustainability Maturity
- 6.5 Strategic Developments in Surface Water Sports Equipment (Last 24 Months)
- 6.5.1 Mergers, Acquisitions & Divestments
- 6.5.2 New Surface Water Sports Equipment Launches
- 6.5.3 Facility Expansions
- 6.5.4 Strategic Alliances, Joint Ventures & Partnerships
- 6.5.5 Distribution Expansion & Market Entry
- 6.5.6 Sustainability & ESG Initiatives
- 6.6 Competitive Strategy Mapping
- 6.6.1 Leader, Challenger, Follower & Niche Classification
- 6.6.2 Pricing Strategy Comparison
- 6.6.3 Channel Strategy Matrix
Note: Strategic developments are included based on their materiality and the availability of reliable information.
Chapter 7. Global Surface Water Sports Equipment Market – By Distribution Channel
- 7.1 Segment Overview
- 7.1.1 Volume & Revenue Split by Channel (2024 & 2032)
- 7.1.2 Channel Mix Evolution (2024-2032)
Chapter 8. Regional Market Analysis – Global Overview
- 8.1 Global Regional Overview
- 8.1.1 Regional Volume Share
- 8.1.2 Regional Revenue Share
- 8.1.3 Regional Volume by Region
- 8.1.4 Regional Revenue by Region
- 8.1.5 Regional Forecast Through 2032
- 8.2 Cross-Regional Segment Analysis
- 8.2.1 By Distribution Channel
- 8.2.2 By Brand/Price Tier
Chapter 9. North America Surface Water Sports Equipment Market
- 9.1 United States
- 9.2 Canada
- 9.3 Mexico
Chapter 10. Europe Surface Water Sports Equipment Market
- 10.1 Germany
- 10.2 France
- 10.3 Italy
- 10.4 United Kingdom
- 10.5 Spain
- 10.6 Poland
- 10.7 Russia
- 10.8 Netherlands
- 10.9 Belgium
- 10.10 Sweden
- 10.11 Denmark
- 10.12 Norway
- 10.13 Rest of Europe
Chapter 11. Asia Pacific Surface Water Sports Equipment Market
- 11.1 China
- 11.2 India
- 11.3 Japan
- 11.4 South Korea
- 11.5 Thailand
- 11.6 Indonesia
- 11.7 Vietnam
- 11.8 Malaysia
- 11.9 Australia
- 11.10 Rest of Asia Pacific
Chapter 12. Latin America Surface Water Sports Equipment Market
- 12.1 Brazil
- 12.2 Argentina
- 12.3 Colombia
- 12.4 Chile
- 12.5 Rest of Latin America
Chapter 13. Middle East Surface Water Sports Equipment Market
- 13.1 Saudi Arabia
- 13.2 United Arab Emirates
- 13.3 Turkey
- 13.4 Israel
- 13.5 Iran
- 13.6 Rest of the Middle East
Chapter 14. Africa Surface Water Sports Equipment Market
- 14.1 South Africa
- 14.2 Egypt
- 14.3 Nigeria
- 14.4 Morocco
- 14.5 Rest of Africa
Chapter 15. Surface Water Sports Equipment Company Profiles
- 15.1 [Company 01]
- 15.1.1 Company Overview
- 15.1.2 Key Management Personnel
- 15.1.3 Products & Services Portfolio
- 15.1.4 Financial Performance
- 15.1.5 Key Market Focus & Geographic Presence
- 15.1.6 Recent Developments & Strategic Initiatives
Note: The company profile list is preliminary and may change based on research findings, market developments, data availability, and client requirements.
Chapter 16. Appendices
- Appendix A – List of Abbreviations & Acronyms
- Appendix B – Industry Classification Code Reference – Full Series
- Appendix C – Production & Capacity Data Tables
- Appendix D – End-Use & Demand Base Tables
- Appendix E – Consumption & Replacement Rate Assumptions
- Appendix F – ASP Reference Tables
- Appendix G – Manufacturing & Facility Database
- Appendix H – Import-Export Data Tables
- Appendix I – Regulatory Summary Tables
- Appendix J – Primary Research Participant List (Anonymized)
- Appendix K – Primary Research Questionnaire Framework
- Appendix L – Data Sources & Bibliography
- Appendix M – Market Size Divergence & Source Comparison
Chapter 17. Research Methodology
- 17.1 Research Framework & Philosophy
- 17.2 Secondary Research – Sources, Hierarchy & Data Extraction
- 17.3 Data Modeling – Bottom-Up & Top-Down Market Sizing
- 17.4 Primary Research – Stakeholder Framework, LOI & Sample Sizes
- 17.5 Forecast Methodology – Regression, Scenario & Sensitivity Analysis
- 17.6 Quality Control – Four-Layer Validation Framework
- 17.7 Limitations & Standard Assumptions
- 17.8 Disclaimer
