Market overview
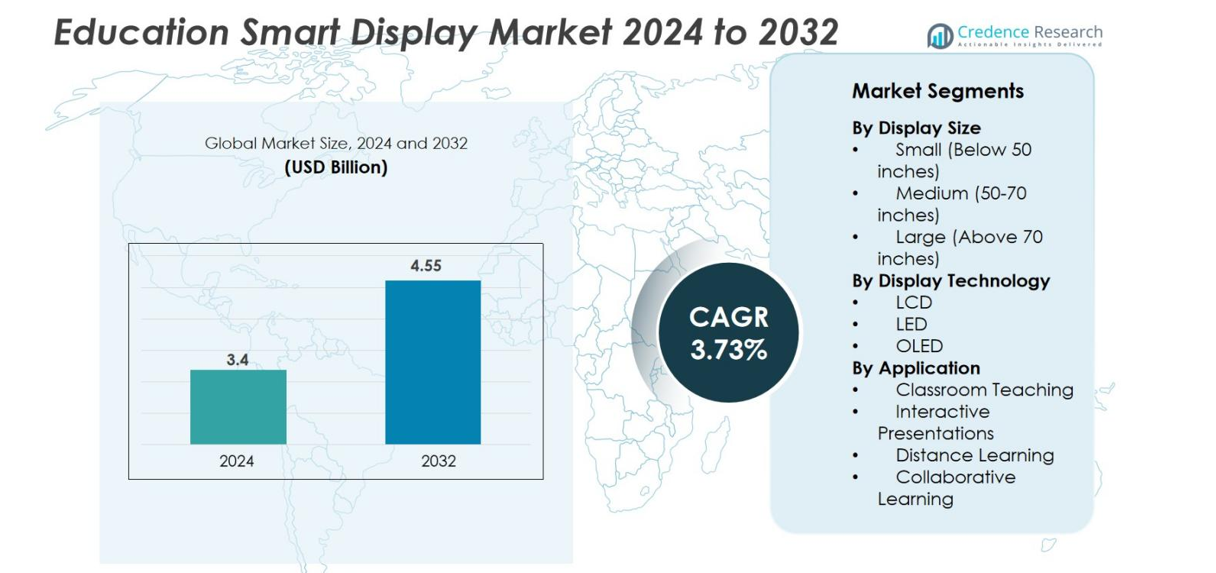
The Education Smart Display market size was valued at USD 3.4 billion in 2024 and is anticipated to reach USD 4.55 billion by 2032, at a CAGR of 3.73% during the forecast period.
| REPORT ATTRIBUTE |
DETAILS |
| Historical Period |
2020-2023 |
| Base Year |
2024 |
| Forecast Period |
2025-2032 |
| Education Smart Display Market Size 2024 |
USD 3.4 billion |
| Education Smart Display Market, CAGR |
3.73% |
| Education Smart Display Market Size 2032 |
USD 4.55 billion |
The Education Smart Display market is driven by prominent firms such as Samsung Electronics (South Korea), LG Electronics (South Korea), Newline Interactive Inc. (U.S.), PPDS (Netherlands) and SMART Technologies ULC (Canada) that compete actively through product innovation and global expansion. Regionally, North America leads with about 40% of the global market share, supported by high ed‑tech investment and maturity. Europe follows with roughly 30%, while Asia‑Pacific holds around 25%, benefitting from strong government initiatives and rapid school infrastructure growth.
Market Insights
- The Education Smart Display market was valued at USD 3.4 billion in 2024 and is expected to reach USD 4.55 billion by 2032, growing at a CAGR of 3.73% during the forecast period.
- Key drivers of market growth include the increasing adoption of digital learning tools, rising demand for collaborative learning solutions, and government funding for educational technology infrastructure.
- Market trends point to the integration of AI in smart displays, enhancing interactivity and personalization, and the shift toward hybrid learning models, driving adoption across regions.
- Competitive analysis reveals major players like Samsung, LG Electronics, Newline Interactive, and SMART Technologies, with strong market presence in North America (40%), Europe (30%), and Asia-Pacific (25%).
- Key restraints include high initial investment costs for educational institutions and challenges related to integrating new technology with legacy systems, which may slow down adoption in certain regions.
Access crucial information at unmatched prices!
Request your sample report today & start making informed decisions powered by Credence Research Inc.!
Download Sample
Market Segmentation Analysis
By Display Size
The Education Smart Display market is segmented by display size into small (below 50 inches), medium (50-70 inches), and large (above 70 inches) displays. The medium display segment (50-70 inches) is the dominant sub-segment, holding the largest market share of approximately 45%. This size range is preferred for classrooms and interactive learning environments, providing an ideal balance between space and visibility. The growth of this segment is driven by increasing adoption of digital learning tools in educational institutions, along with the growing trend toward more interactive and engaging teaching methods.
- For instance, SMART Technologies offers the MX series interactive whiteboards in popular sizes such as 55”, 65”, and 75”, designed specifically for classroom environments with features like multi-touch points and integrated microphones to enhance engagement.
By Display Technology
In terms of display technology, the market is categorized into LCD, LED, and OLED displays. The LED technology segment holds the largest market share, accounting for approximately 55%. LED displays are favored for their energy efficiency, longer lifespan, and lower cost compared to OLED and LCD options, making them the most suitable choice for education environments. The adoption of LED technology continues to rise as educational institutions seek cost-effective, durable solutions that offer high-quality visuals for interactive learning and presentations.
- For instance, LG Electronics also integrates LED panels in its education range, offering durable screens optimized for interactive learning with lower power consumption.
By Application
The Education Smart Display market is also segmented by application into classroom teaching, interactive presentations, distance learning, and collaborative learning. The classroom teaching segment is the dominant sub-segment, representing approximately 40% of the market share. This growth is attributed to the increasing integration of smart displays into traditional classrooms to enhance the learning experience through interactive lessons, multimedia, and real-time student engagement. The demand is fueled by the need for more dynamic teaching tools that promote student participation and improve educational outcomes.
Key Growth Drivers
Increasing Adoption of Digital Learning Tools
The rising integration of digital learning tools and technologies in educational settings is a significant growth driver for the Education Smart Display market. As schools, universities, and other educational institutions move toward more interactive and engaging teaching methods, smart displays have become essential. These displays facilitate multimedia learning, enhance interactivity, and provide real-time feedback, thereby improving the overall learning experience. Moreover, the global shift toward blended learning models, which combine in-person and online education, has accelerated the need for technology that bridges these two formats. Smart displays not only support traditional classroom teaching but also aid in distance learning, making them indispensable in today’s educational landscape.
- For instance, platforms like Coursera have expanded online course access to hundreds of millions of learners worldwide, showcasing the shift toward blended and distance learning models.
Rising Demand for Collaborative Learning Solutions
Collaborative learning, which emphasizes group-based learning activities and student interaction, is another key driver propelling the growth of the Education Smart Display market. Educational institutions are increasingly focusing on enhancing peer-to-peer interaction and collaborative problem-solving in classrooms. Smart displays provide an ideal platform for such activities, offering interactive features that allow students to engage with each other and the content simultaneously. These displays enable real-time sharing of ideas, digital whiteboarding, and group discussions, all of which are essential for collaborative learning environments.
- For instance, platforms like Microsoft Teams and Google Workspace enable real-time sharing, digital whiteboarding, and group discussions, increasing classroom engagement and collaborative participation.
Government Initiatives and Funding for Educational Technology
Governments across the globe are making substantial investments in education technology to improve the quality of education and ensure equitable access to modern learning resources. These initiatives often include funding for the installation of advanced technological tools such as smart displays in classrooms. In many regions, policies aimed at digital transformation in education are creating an environment conducive to the widespread adoption of smart displays. For instance, government-backed programs focusing on digital literacy, remote learning, and smart classroom setups are pushing schools to upgrade their infrastructure.
Key Trends & Opportunities
Shift Toward Hybrid Learning Models
The shift toward hybrid learning models, blending in-person and remote education, presents a significant opportunity for the Education Smart Display market. The COVID-19 pandemic accelerated the adoption of digital learning tools, and now, educational institutions are increasingly adopting hybrid learning strategies as the new norm. Hybrid models require versatile, interactive tools that can cater to both in-person and online learners, which is where smart displays shine. They offer seamless integration with virtual classrooms and digital content, ensuring that both remote and on-site students have equal access to the learning experience.
- For instance, Samsung and Cisco have collaborated on hybrid classroom solutions featuring Samsung’s QBR displays and Cisco’s Room Kit Mini, enabling real-time interaction between remote and in-person students, ensuring an equitable learning experience regardless of location.
Integration of AI and Interactive Features
The integration of Artificial Intelligence (AI) and other advanced technologies in smart displays presents a lucrative opportunity for the market. AI-powered features, such as voice recognition, personalized content delivery, and real-time performance analytics, can significantly enhance the learning experience. These technologies allow smart displays to adapt to the individual needs of students, making learning more personalized and efficient. Additionally, interactive features such as gesture control, touch recognition, and real-time collaboration foster engagement and improve retention rates.
- For instance, AI-powered voice recognition systems, such as Samsung’s AI-enabled interactive displays, allow students to navigate lessons through simple voice commands, enhancing accessibility.
Key Challenges
High Initial Investment Costs
One of the primary challenges facing the Education Smart Display market is the high initial cost of installation. While the long-term benefits of smart displays, such as enhanced learning outcomes and increased student engagement, are clear, the upfront costs associated with purchasing and installing these systems can be prohibitively expensive for many educational institutions. This is particularly true for schools and colleges in developing regions, where budgets for educational technology are often limited. Although prices are expected to decrease over time as the technology matures and scales, the initial investment remains a significant barrier for wide-scale adoption.
Integration with Legacy Systems
Another significant challenge is the integration of Education Smart Displays with existing legacy systems used in educational institutions. Many schools and universities still rely on older equipment, such as traditional projectors, whiteboards, and other non-digital teaching tools. These legacy systems can be incompatible with newer smart display technologies, leading to difficulties in integrating new hardware and software into the classroom environment. The lack of seamless compatibility between old and new technologies can create disruption and inefficiencies, discouraging institutions from adopting smart displays. Overcoming these integration challenges requires additional resources, training, and infrastructure upgrades, which can be costly and time-consuming for educational institutions.
Regional Analysis
North America
The North American region commands 40% of the global education smart display market. This dominance arises from substantial investments in educational technology infrastructure across the U.S. and Canada, an advanced ed-tech ecosystem, and strong demand for interactive classroom solutions. Institutional focus on student engagement and remote-learning readiness has driven adoption of large-format smart displays in K-12 and higher education settings. The presence of established manufacturers and supportive governmental funding for digital classrooms further reinforces the region’s leading share.
Europe
Europe holds 30% of the market, underpinned by widespread digitalisation of teaching environments, government-led smart-classroom initiatives, and strong presence of display-technology suppliers. Countries such as Germany, the UK, and France have integrated interactive panels into curricula and institutional strategies, accelerating uptake. The region’s stable demand and developed infrastructure contribute to its sizeable share, while ongoing upgrades in universities and corporate-training centres keep the growth momentum.
Asia-Pacific
Asia-Pacific accounts for 25% of the market and is poised to register the highest growth rate among regions. Growth drivers include large-scale government programmes for smart schooling in China, India, Japan, and South Korea, rising private-sector ed-tech adoption, and expanding display-manufacturing capacity in the region. Urbanisation and increasing internet connectivity support deployment of smart displays across K-12 and higher-education institutions. Despite a lower base share, the region’s CAGR outpaces others, signalling strong future potential.
Middle East & Africa
The Middle East & Africa region currently captures 5% of the global market. Growth here is driven by state-led investments in modernising school infrastructure, expanding access to digital education tools, and elevating classroom interactivity. Although adoption remains lower compared to mature regions, incremental upgrades in Gulf countries and African hubs, and increasing partnerships with display-technology vendors offer meaningful opportunity. Cost-sensitivity and infrastructure gaps, however, temper the pace of growth.
Latin America
Latin America holds less than 5% of the market share but is gradually gaining traction. Key factors include rising demand for blended and remote-learning solutions in Brazil, Mexico, and Argentina, combined with growing awareness of smart-classroom benefits. Budget constraints, mixed infrastructure readiness, and slower procurement cycles moderate near-term growth, yet the region offers latent potential for display-technology providers focusing on cost-efficient and scalable solutions.
Market Segmentations
By Display Size
- Small (Below 50 inches)
- Medium (50-70 inches)
- Large (Above 70 inches)
By Display Technology
By Application
- Classroom Teaching
- Interactive Presentations
- Distance Learning
- Collaborative Learning
By Geography
- North America
- Europe
- Germany
- France
- U.K.
- Italy
- Spain
- Rest of Europe
- Asia Pacific
- China
- Japan
- India
- South Korea
- South-east Asia
- Rest of Asia Pacific
- Latin America
- Brazil
- Argentina
- Rest of Latin America
- Middle East & Africa
- GCC Countries
- South Africa
- Rest of the Middle East and Africa
Competitive Landscape
The competitive landscape of the education smart display market features several key global players who actively pursue innovation, strategic partnerships and geographic expansion to strengthen their positions. Leading companies such as Samsung Electronics, LG Electronics and Newline Interactive dominate through broad product portfolios tailored for classroom, distance‑learning and collaborative settings. Meanwhile, European‑based firms like PPDS and North American companies like SMART Technologies ULC differentiate via channel partnerships and region‑specific offerings. These companies invest heavily in R&D, user‑experience enhancements and service ecosystems to differentiate. Competitive dynamics likewise include pricing pressures, rapid technology cycles and the need for seamless integration into institutional IT infrastructures. Overall, the market is moderately consolidated, yet open to niche disruptors offering specialised features or lower‑cost alternatives.
Shape Your Report to Specific Countries or Regions & Enjoy 30% Off!
Key Player Analysis
Recent Developments
- In September 2024, SMART Technologies, a leading provider of interactive displays for the education sector, entered the Indian market and introduced a new range of smart interactive displays tailored for local needs, marking a significant expansion into one of the world’s fastest-growing EdTech markets.
- In January 2024, Sharp introduced the PN-LA series, the latest addition to its AQUOS BOARD interactive display range. The series features a modern design, improved touch performance, and integrated software including Windows 11 Pro, SHARP Pen Software, and Sharp Touch Viewer to deliver a secure and flexible collaboration environment
Report Coverage
The research report offers an in-depth analysis based on Display Size, Display Technology, Application and Geography. It details leading market players, providing an overview of their business, product offerings, investments, revenue streams, and key applications. Additionally, the report includes insights into the competitive environment, SWOT analysis, current market trends, as well as the primary drivers and constraints. Furthermore, it discusses various factors that have driven market expansion in recent years. The report also explores market dynamics, regulatory scenarios, and technological advancements that are shaping the industry. It assesses the impact of external factors and global economic changes on market growth. Lastly, it provides strategic recommendations for new entrants and established companies to navigate the complexities of the market.
Future Outlook
- Growing demand for hybrid and remote learning setups will push broader adoption of smart displays across institutions worldwide.
- Increasing integration of artificial intelligence and analytics in smart displays will enable adaptive learning and personalized classroom experiences.
- Expansion into emerging markets in Asia‑Pacific, Latin America and Africa will drive the next phase of growth as infrastructure improves.
- Institutions will increasingly prefer subscription and service‑based models over outright purchases, enabling cost flexibility and faster upgrades.
- Manufacturers will shift toward larger display sizes (above 70 inches) and higher‑resolution panels to support immersive and collaborative learning.
- Partnerships between display manufacturers and educational content/cloud‑platform providers will create bundled ecosystems as a competitive differentiator.
- Sustainability considerations and energy‑efficient display technologies will become more important for procurement decisions in schools and universities.
- Interoperability with existing classroom hardware and software will gain prominence, reducing resistance from institutions with legacy systems.
- Budget constraints and varying infrastructure maturity among regions will continue to shape deployment pace and business models.
- Service, training and ecosystem support will emerge as key value propositions, not just hardware, to ensure educational institutions maximise return on investment.



