
Market Overview:
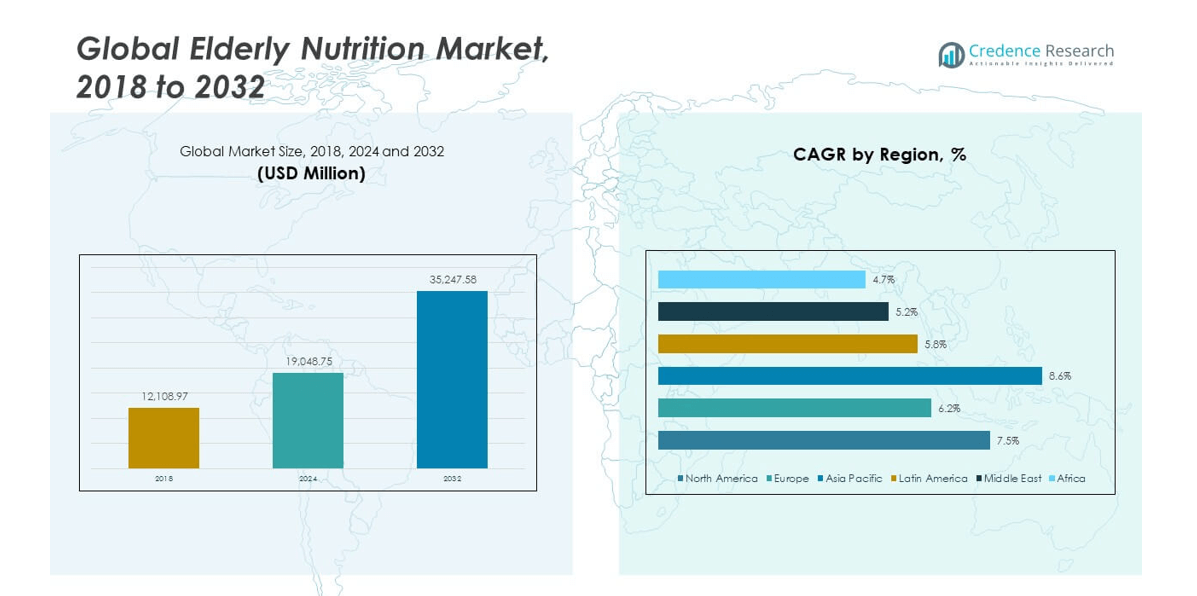
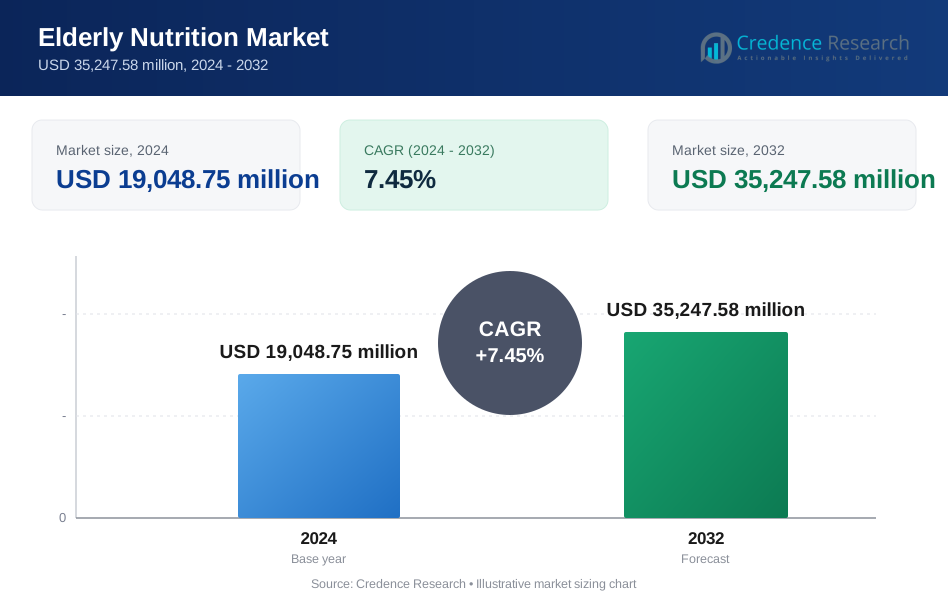
The Global Elderly Nutrition Market size was valued at USD 12,108.97 million in 2018 to USD 19,048.75 million in 2024 and is anticipated to reach USD 35,247.58 million by 2032, at a CAGR of 7.45% during the forecast period.
| REPORT ATTRIBUTE | DETAILS |
|---|---|
| Historical Period | 2020-2023 |
| Base Year | 2024 |
| Forecast Period | 2025-2032 |
| Elderly Nutrition Market Size 2024 | USD 19,048.75 million |
| Elderly Nutrition Market, CAGR | 7.45% |
| Elderly Nutrition Market Size 2032 | USD 35,247.58 million |
Market growth is driven by rising elderly populations and longer lifespans worldwide. Older adults face higher risks of malnutrition and chronic disease. Nutrition products support muscle strength, bone health, and immune function. Healthcare providers recommend dietary supplements for preventive care. Higher awareness of healthy aging improves adoption rates. Product innovation focuses on easy digestion and high nutrient density. Ready-to-consume formats support daily use. Medical nutrition plays a stronger role in elderly care plans.
North America leads the market due to advanced healthcare systems and strong consumer awareness. Europe follows with high elderly population shares and preventive health focus. Japan stands out due to rapid population aging and clinical nutrition adoption. China shows strong growth from rising senior numbers and urban healthcare access. India and Southeast Asia emerge with improving income levels and care awareness. Latin America grows steadily through private healthcare expansion. Middle East markets remain early-stage but show long-term potential.
Market Insights:
- The Global Elderly Nutrition Market was valued at USD 12,108.97 million in 2018, reached USD 19,048.75 million in 2024, and is projected to hit USD 35,247.58 million by 2032, growing at a CAGR of 7.45%, supported by aging populations and preventive healthcare adoption.
- North America led with about 43.8% share in 2024 due to strong healthcare access, Asia Pacific followed with 29.5% from rapid aging and income growth, and Europe held nearly 17.5% driven by public healthcare support and high elderly ratios.
- Asia Pacific remains the fastest-growing region with a 29.5% share, supported by rising elderly populations, urbanization, family-led care decisions, and expanding access to nutrition products.
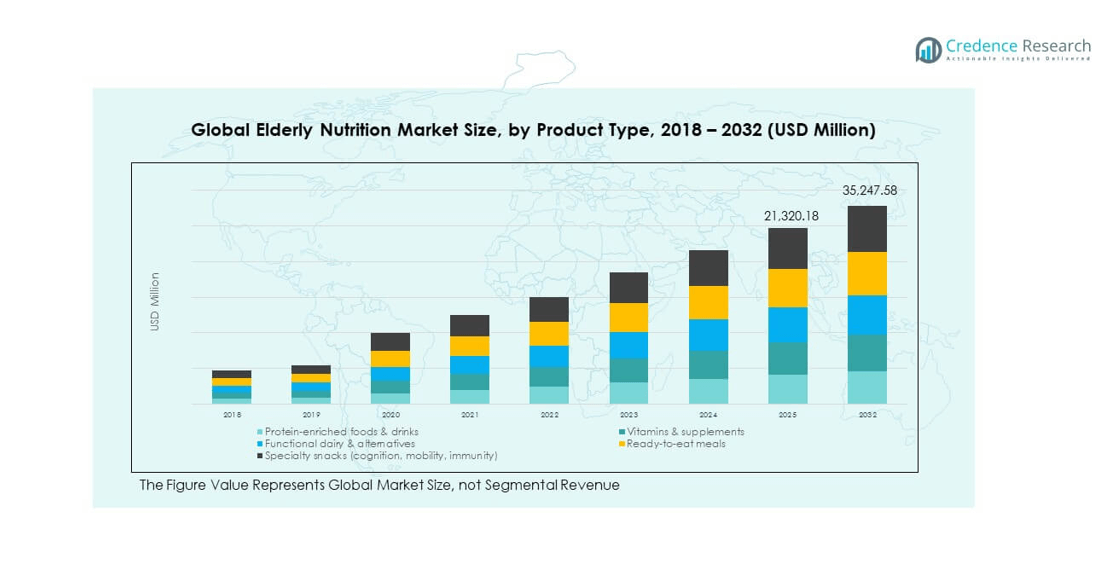
- By product type, protein-enriched foods and drinks dominated with around 35% share, followed by vitamins and supplements at nearly 28%, reflecting focus on muscle health and micronutrient support.
- Ready-to-eat meals accounted for about 18%, while functional dairy alternatives and specialty snacks together contributed roughly 19%, supported by convenience and targeted health benefits.
Market Drivers:
Rapid Growth Of Aging Population And Life Expectancy
The Global Elderly Nutrition Market benefits from rising life expectancy across developed and emerging economies. Older populations expand faster than other age groups worldwide. This shift raises demand for age-specific dietary support products. Elderly consumers face higher nutrition gaps due to reduced absorption. Healthcare systems promote nutrition to support healthy aging. Governments support senior wellness through public health programs. Nutrition brands align products with geriatric dietary needs. This demographic shift sustains long-term market demand.
- For instance, Nestlé Health Science expanded its senior nutrition portfolio to support muscle and immune health, with products designed to deliver balanced protein, vitamins, and minerals per daily serving.
Higher Prevalence Of Chronic And Age-Related Conditions
Chronic diseases increase sharply with age across global populations. Conditions include diabetes, osteoporosis, and cardiovascular disorders. Nutrition plays a key role in disease management strategies. Physicians recommend tailored diets for elderly patients. Clinical nutrition supports recovery and daily health maintenance. Functional nutrients address immunity and muscle loss concerns. The Global Elderly Nutrition Market aligns products with medical guidance. Disease burden continues to drive consistent product uptake.
- For instance, Abbott’s Ensure Enlive provides 20 grams of protein and 1.5 grams of HMB per serving, clinically shown to support muscle strength in older adults.
Rising Awareness Of Preventive Healthcare And Nutrition
Preventive healthcare gains priority among aging consumers. Seniors seek nutrition to maintain independence and mobility. Caregivers also influence dietary product selection. Health campaigns highlight nutrition benefits for elderly wellbeing. Retail pharmacies promote senior-focused nutrition categories. Medical professionals guide diet-based prevention approaches. Nutrition brands invest in education and clear labelling. Awareness growth improves regular consumption habits.
Expansion Of Institutional And Home-Based Elderly Care
Elderly care facilities expand due to nuclear family structures. Home-based care services also grow in urban areas. Nutrition forms a core part of elderly care routines. Care providers prefer standardized and reliable nutrition products. Ready-to-use formats support daily feeding schedules. Hospitals integrate nutrition into post-treatment recovery plans. The Global Elderly Nutrition Market supports both care models. Care infrastructure growth strengthens product demand.
Market Trends:
Shift Toward Condition-Specific And Personalized Nutrition
Elderly consumers seek nutrition aligned with specific health needs. Products target bone health, digestion, and immunity. Personalized formulations gain interest among urban seniors. Brands use age and condition-based positioning. Healthcare input guides product development strategies. Packaging highlights targeted functional benefits. The Global Elderly Nutrition Market reflects this customization trend. Demand favors tailored over generic nutrition products.
- For instance, Otsuka’s senior-focused nutrition lines incorporate tailored electrolyte and micronutrient profiles to support hydration and metabolic balance in aging populations.
Growth Of Convenient And Easy-To-Consume Formats
Convenience drives product choice among elderly users. Liquid supplements and soft textures gain preference. Easy swallowing supports users with chewing difficulties. Single-serve packaging improves portion control. Ready-to-drink formats support daily compliance. Care facilities prefer standardized servings. The Global Elderly Nutrition Market adapts to usability needs. Format innovation improves consumption consistency.
- For instance, Yili introduced ready-to-drink elderly nutrition beverages designed for daily intake, with shelf-stable formats supporting consistent use in home and institutional care.
Rising Demand For Clean Label And Natural Ingredients
Elderly consumers show strong trust in simple formulations. Clean labels reduce concerns over additives. Natural ingredients support long-term consumption confidence. Brands highlight plant-based and dairy-based proteins. Transparency improves brand credibility among caregivers. Regulatory focus supports cleaner product standards. The Global Elderly Nutrition Market reflects ingredient scrutiny. Clean nutrition trends shape new product launches.
Integration Of Nutrition With Digital Health Guidance
Digital health tools support elderly nutrition planning. Apps track diet adherence and wellness goals. Telehealth platforms guide nutrition choices remotely. Caregivers use digital tools for monitoring intake. Brands partner with health platforms for engagement. Education improves correct product usage. The Global Elderly Nutrition Market aligns with digital care models. Technology improves nutrition compliance.
Market Challenges Analysis:
Affordability Constraints And Price Sensitivity Among Seniors
Elderly consumers often rely on fixed incomes. Premium nutrition products face affordability barriers. Price sensitivity affects repeat purchase behavior. Public healthcare coverage varies widely by region. Limited reimbursement restricts clinical nutrition access. Brands face pressure to balance quality and cost. The Global Elderly Nutrition Market faces uneven pricing acceptance. Cost concerns limit penetration in developing regions.
Regulatory Complexity And Product Trust Issues
Nutrition products face strict regulatory oversight. Compliance requirements vary across countries. Claims must meet medical and nutritional standards. Misleading labels reduce consumer trust. Elderly users require clear usage guidance. Approval timelines slow product launches. The Global Elderly Nutrition Market operates under high scrutiny. Regulatory complexity increases operational challenges.
Market Opportunities:
Expansion Across Emerging Elderly Populations In Asia
Asia shows rapid growth in elderly population numbers. Urbanization improves access to nutrition products. Rising incomes support preventive health spending. Governments promote senior healthcare initiatives. Local brands adapt products to regional diets. Distribution networks expand through pharmacies and clinics. The Global Elderly Nutrition Market gains momentum in Asia. Early entry offers long-term growth potential.
Innovation In Clinical And Functional Nutrition Solutions
Clinical nutrition offers strong growth opportunities. Products support recovery, mobility, and immunity needs. Hospitals increase nutrition-based care protocols. Functional ingredients enhance product differentiation. Research supports targeted elderly nutrition outcomes. Partnerships with healthcare providers improve adoption. The Global Elderly Nutrition Market benefits from innovation focus. Advanced formulations support premium positioning.
Market Segmentation Analysis:
By Product Type
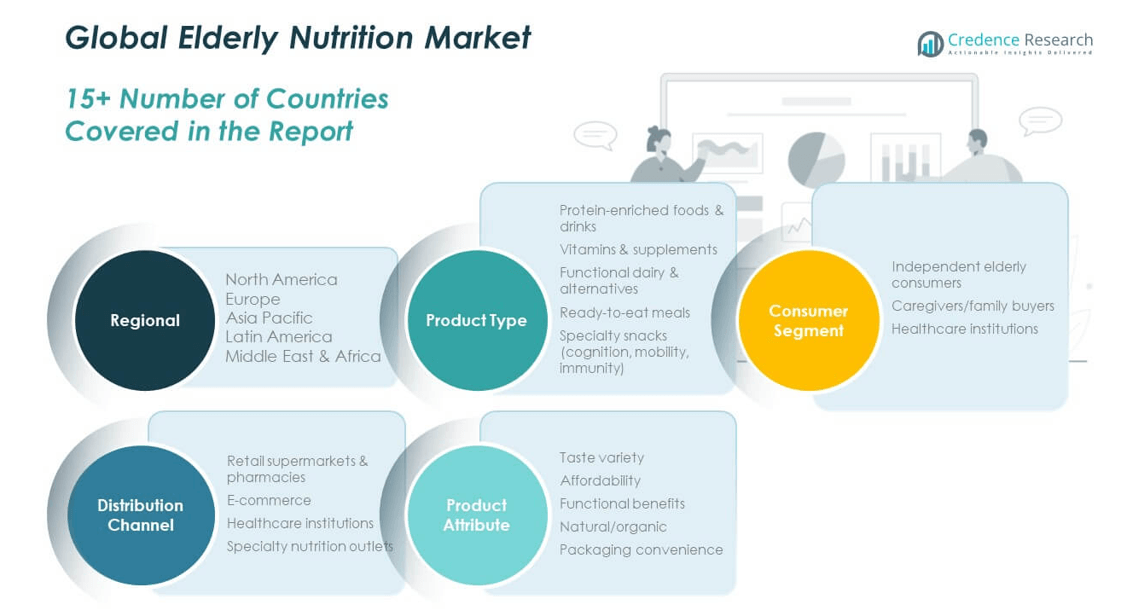
Oral nutritional supplements form the largest share due to daily preventive use. Enteral nutrition supports patients with swallowing or digestion limits. Parenteral nutrition serves critical care and severe malnutrition cases. Dietary supplements address micronutrient gaps in routine diets. Functional food and beverages gain demand through convenience and taste appeal. Innovation focuses on balanced formulas and easy absorption. Medical endorsement supports product credibility. The Global Elderly Nutrition Market reflects strong diversity across product categories.
- For instance, Nestlé’s oral clinical nutrition products are widely used in hospitals, meeting clinical protein and calorie requirements for elderly patients.
By Consumer Segment
The age 60–70 group drives early adoption through preventive health focus. The age 71–80 segment shows higher dependence on clinical nutrition. The age above 80 group relies on assisted feeding solutions. Male elderly users focus on muscle and heart health. Female elderly users prioritize bone strength and immunity. Caregivers influence product selection across all groups. Health awareness shapes consistent usage patterns. Segment needs vary by age and gender.
- For instance, Abbott positions different Ensure variants to address muscle support, bone health, and glycemic control, aligning formulations with age- and gender-specific nutritional needs.
By Distribution Channel
Hospital pharmacies lead through clinical and post-care nutrition supply. Retail pharmacies support easy access and repeat purchases. Online platforms grow due to home delivery and subscriptions. Supermarkets and hypermarkets serve ambulatory elderly consumers. Direct-to-consumer models support brand engagement and education. Channel choice depends on care intensity and mobility. Trust and availability drive channel preference. Distribution diversity supports market reach.
By Product Attributes
Protein-enriched products address muscle loss concerns. Fiber-enriched options support digestion and gut health. Vitamin and mineral fortified products prevent deficiencies. Low sugar formulations suit diabetic elderly users. Lactose-free products serve sensitive digestion needs. Attribute-based selection improves compliance. Clear labeling guides informed choices. Attribute focus strengthens differentiation.
Segmentation:
By Product Type
- Oral nutritional supplements
- Enteral nutrition
- Parenteral nutrition
- Dietary supplements
- Functional food and beverages
By Consumer Segment
- Age 60–70
- Age 71–80
- Age above 80
- Male elderly
- Female elderly
By Distribution Channel
- Hospital pharmacies
- Retail pharmacies
- Online platforms
- Supermarkets and hypermarkets
- Direct-to-consumer
By Product Attributes
- Protein-enriched
- Fiber-enriched
- Vitamin and mineral fortified
- Low sugar
- Lactose-free
By Region
- North America
- U.S.
- Canada
- Mexico
- Europe
- Germany
- France
- U.K.
- Italy
- Spain
- Rest of Europe
- Asia Pacific
- China
- Japan
- India
- South Korea
- South-east Asia
- Rest of Asia Pacific
- Latin America
- Brazil
- Argentina
- Rest of Latin America
- Middle East & Africa
- GCC Countries
- South Africa
- Rest of the Middle East and Africa
Regional Analysis:
North America
The North America Elderly Nutrition Market size was valued at USD 5,355.01 million in 2018 to USD 8,337.63 million in 2024 and is anticipated to reach USD 15,470.15 million by 2032, at a CAGR of 7.5% during the forecast period. North America accounted for about 43.8% market share in 2024. The region leads due to advanced healthcare systems and strong preventive nutrition awareness. Elderly consumers actively adopt supplements for daily health support. Hospitals integrate nutrition into recovery protocols. Retail pharmacies ensure high product availability. Insurance coverage supports clinical nutrition access. The Global Elderly Nutrition Market benefits from strong physician recommendation levels here.
Europe
The Europe Elderly Nutrition Market size was valued at USD 2,244.34 million in 2018 to USD 3,335.77 million in 2024 and is anticipated to reach USD 5,608.51 million by 2032, at a CAGR of 6.2% during the forecast period. Europe held nearly 17.5% market share in 2024. Aging demographics strongly influence demand across Western Europe. Public healthcare systems emphasize preventive elderly care. Nutrition products align with clinical dietary guidelines. Pharmacies remain the primary distribution channel. Home care adoption supports steady consumption. The Global Elderly Nutrition Market gains stability from regulated European demand.
Asia Pacific
The Asia Pacific Elderly Nutrition Market size was valued at USD 3,376.40 million in 2018 to USD 5,618.80 million in 2024 and is anticipated to reach USD 11,371.20 million by 2032, at a CAGR of 8.6% during the forecast period. Asia Pacific captured about 29.5% market share in 2024. Rapid population aging drives demand in Japan and China. Urbanization improves access to nutrition products. Rising incomes support preventive health spending. Families play a key role in purchase decisions. Local brands adapt products to regional diets. The Global Elderly Nutrition Market shows its fastest growth momentum here.
Latin America
The Latin America Elderly Nutrition Market size was valued at USD 584.06 million in 2018 to USD 907.61 million in 2024 and is anticipated to reach USD 1,490.51 million by 2032, at a CAGR of 5.8% during the forecast period. Latin America represented nearly 4.8% market share in 2024. Growth comes from improving healthcare access. Urban elderly populations show higher nutrition awareness. Private healthcare expansion supports product uptake. Pharmacies remain central to distribution. Price sensitivity shapes buying behavior. The Global Elderly Nutrition Market sees gradual expansion across this region.
Middle East
The Middle East Elderly Nutrition Market size was valued at USD 343.24 million in 2018 to USD 494.11 million in 2024 and is anticipated to reach USD 773.30 million by 2032, at a CAGR of 5.2% during the forecast period. The region held about 2.6% market share in 2024. Government healthcare investments support elderly care services. Nutrition awareness grows in urban centers. Hospitals drive clinical nutrition demand. Retail access remains uneven across countries. Imports dominate premium product supply. The Global Elderly Nutrition Market shows early-stage development here.
Africa
The Africa Elderly Nutrition Market size was valued at USD 205.93 million in 2018 to USD 354.83 million in 2024 and is anticipated to reach USD 533.91 million by 2032, at a CAGR of 4.7% during the forecast period. Africa accounted for roughly 1.9% market share in 2024. Market growth remains limited by income levels. Public healthcare funding stays constrained. Urban areas show higher adoption rates. Basic nutrition products dominate demand. Awareness programs support gradual uptake. The Global Elderly Nutrition Market holds long-term potential across Africa.
Key Player Analysis:
- Nestlé Health Science
- Abbott
- Yili
- Otsuka
- Care/of
Competitive Analysis:
The Global Elderly Nutrition Market shows moderate to high competitive intensity. Large multinational firms dominate through strong clinical portfolios and global distribution. These players focus on science-backed formulations and physician trust. Product breadth supports coverage across preventive and clinical nutrition needs. Mid-sized firms compete through niche positioning and clean-label offerings. Regional brands gain traction by aligning products with local diets. Innovation centers on protein balance, digestion support, and immune health. Strategic partnerships strengthen healthcare access and retail reach. Brand reputation and regulatory compliance shape competitive positioning. It remains innovation-driven with steady portfolio upgrades.
Recent Developments:
- In November 2025, Abbott launched a New and Advanced Ensure Diabetes Care formulation in India (specifically on November 13, 2025), designed to help manage blood glucose levels and support weight management for adults. This new product features a "triple care system" with 4X higher myo-inositol and a low glycemic index carbohydrate blend, directly targeting the growing diabetic elderly population. Earlier updates in late 2025 also highlighted the promotion of Ensure High Protein as a key nutritional solution for active adults to combat age-related muscle loss.
- In May 2025, Otsuka Pharmaceutical Factory America took a significant step in the clinical nutrition space by acquiring a 60% interest in ICU Medical’s IV solution business, establishing a new joint venture named Otsuka ICU Medical LLC on May 1, 2025. This move strengthens their supply chain for essential clinical nutrition products often used in elderly care. In the consumer space, Otsuka’s Nature Made brand launched its "Advanced Multi for Adults Gummies" in March 2024, delivering a high-absorption magnesium citrate formulation specifically designed to support muscle, nerve, and bone health in aging adults.
- In June 2024, Nestlé Health Science launched a comprehensive new platform, glp-1nutrition.com, specifically designed to support the nutritional needs of individuals on weight management journeys, including those using GLP-1 medications. This platform addresses muscle preservation and micronutrient intake-critical concerns for aging adults on these therapies. Additionally, in July 2025, the company announced a strategic review of its vitamin, mineral, and supplement (VMS) assets, including major brands like Nature’s Bounty and Osteo Bi-Flex, as it considers divesting these businesses to refocus its portfolio. On the partnership front, their joint venture with Dr. Reddy’s Laboratories in India became operational in Q2 2024, aiming to bring their medical nutrition portfolio to a wider patient base.
Report Coverage:
The research report offers an in-depth analysis based on product type, consumer segment, distribution channel, product attributes, and region. It details leading market players, providing an overview of their business, product offerings, investments, revenue streams, and key applications. Additionally, the report includes insights into the competitive environment, SWOT analysis, current market trends, as well as the primary drivers and constraints. Furthermore, it discusses various factors that have driven market expansion in recent years. The report also explores market dynamics, regulatory scenarios, and technological advancements that are shaping the industry. It assesses the impact of external factors and global economic changes on market growth. Lastly, it provides strategic recommendations for new entrants and established companies to navigate the complexities of the market.
Future Outlook:
- Aging populations will continue to expand demand for elderly-focused nutrition products worldwide.
- Clinical nutrition will gain wider use within hospitals and post-acute care settings.
- Personalized nutrition solutions will attract stronger adoption among health-aware seniors.
- Convenient and easy-to-consume formats will support daily and long-term compliance.
- Clean-label and transparent formulations will strengthen trust among elderly consumers.
- Digital health platforms will guide nutrition planning and monitoring for seniors.
- Asia Pacific will emerge as a key growth engine due to rapid demographic shifts.
- Home-based elderly care services will increase reliance on nutrition products.
- Partnerships between nutrition brands and healthcare providers will expand market reach.
- Ongoing innovation will focus on digestion, immunity, and muscle health support.
Request a Free Sample
Fill in your details and we'll send you a free sample report.
- Sample data tables & charts
- Research methodology
Need a Custom Version of This Report?
Tailor the scope, geography, or segments to your exact requirements.
- Custom geography or segment scope
- Direct access to our analyst team
Frequently Asked Questions
What is the current size of the Elderly Nutrition Market?
At what Compound Annual Growth Rate is the Global Elderly Nutrition Market projected to grow between 2025 and 2032?
What factors are driving the growth of the Elderly Nutrition Market?
What are some challenges faced by the Elderly Nutrition Market?
Who are the major players in the Elderly Nutrition Market?
Table of Content
Chapter 1. Report Introduction
- 1.1 Report Description & Purpose
- 1.1.1 Report Title & Market Definition
- 1.1.2 Unique Selling Propositions (USP) & Key Differentiators
- 1.1.3 Value Proposition for Stakeholders
- 1.2 Research Objectives
- 1.2.1 Market Sizing Objectives (Volume & Revenue) (Volume Where Applicable)
- 1.2.2 Segmentation Objectives
- 1.2.3 Competitive Intelligence Objectives
- 1.2.4 Forecast & Scenario Objectives
- 1.3 Report Scope
- 1.3.1 Elderly Nutrition Scope – Segments & Subsegments Covered
- 1.3.2 Geographic Scope – Regions & Countries Covered
- 1.3.3 Historical Period, Base Year & Forecast Period (2024; forecast to 2032)
- 1.3.4 Inclusions & Exclusions
- 1.4 Industry Classification & Applicable Codes
- 1.5 Currency, Measurement Units & Valuation Basis
- 1.6 Target Stakeholders
- 1.7 Limitations & Assumptions
Chapter 2. Executive Summary
- 2.1 Global Elderly Nutrition Market Snapshot
- 2.1.1 Market Size – Historical (2024) & Forecast (2024-2032) (2024: USD 19,048.75 million → 2032: USD 35,247.58 million)
- 2.1.2 Volume & Revenue – Global Totals (Volume Where Applicable)
- 2.1.3 Key Market Highlights – Top Five Facts
- 2.2 Elderly Nutrition Market Segmentation Snapshot
- 2.2.1 Market Split by Region – 2024 vs. 2032
- 2.3 Competitive Snapshot
- 2.3.1 Top 10 Players by Revenue Share – 2024
- 2.3.2 Top 10 Players by Volume Share – 2024 (Volume Where Applicable)
- 2.3.3 Recent Strategic Developments (18-Month Summary)
- 2.4 Key Investment Highlights & Strategic Conclusions
Chapter 3. Elderly Nutrition Market Dynamics & Industry Analysis
- 3.1 Market Overview & Context
- 3.1.1 Elderly Nutrition Market Position in the Broader Industry Value Chain
- 3.1.2 Demand Structure & Purchasing Dynamics
- 3.1.3 Market Maturity & Development Stage by Region
- 3.2 Elderly Nutrition Market Drivers
- 3.3 Elderly Nutrition Market Restraints & Challenges
- 3.4 Elderly Nutrition Market Opportunities
- 3.5 Porter's Five Forces Analysis
- 3.5.1 Threat of New Entrants
- 3.5.2 Bargaining Power of Suppliers
- 3.5.3 Bargaining Power of Buyers
- 3.5.4 Threat of Substitutes
- 3.5.5 Competitive Rivalry – Intensity Assessment
- 3.6 Elderly Nutrition Value Chain Analysis
- 3.6.1 Upstream – Key Inputs, Resources & Suppliers
- 3.6.1.1 Key Input/Resource 1
- 3.6.1.2 Key Input/Resource 2
- 3.6.1.3 Key Input/Resource 3
- 3.6.2 Midstream – Core Operations & Value Creation
- 3.6.2.1 Operating Model & Process Overview
- 3.6.2.2 Key Operating Locations & Capabilities by Company
- 3.6.3 Downstream – Market Channels & End Users
- 3.6.3.1 Direct Sales & Customer Engagement Channels
- 3.6.3.2 Indirect Sales, Intermediaries & Partner Channels
- 3.6.4 Value Chain Profitability Analysis
- 3.6.1 Upstream – Key Inputs, Resources & Suppliers
- 3.7 PESTEL Analysis
- 3.7.1 Political Factors
- 3.7.2 Economic Factors
- 3.7.3 Social Factors
- 3.7.4 Technological Factors
- 3.7.5 Environmental Factors
- 3.7.6 Legal Factors
- 3.8 Elderly Nutrition Supply Chain Analysis
- 3.8.1 Critical Input & Resource Availability Risk Assessment
- 3.8.2 Supplier & Operational Concentration Risk (Geographic Exposure)
- 3.8.3 Supply & Service Disruption Impact Analysis
- 3.9 Regulatory & Policy Landscape
Note: The regulatory and policy landscape section covers regulations based on their applicability to the market, Elderly Nutrition category, geography, and scope of the study. Only regulatory frameworks with a material impact on operations, compliance, trade, sustainability, or market access are analyzed in detail.
Chapter 4. Key Investment Pockets & Opportunity Analysis
- 4.1 Elderly Nutrition Market Attractiveness Analysis
- 4.1.1 By Region – Investment Attractiveness Matrix (Market Size × CAGR)
- 4.2 Absolute Revenue Growth Opportunity
- 4.2.1 By Region – Absolute Revenue Growth Through 2032
- 4.3 Incremental Demand Opportunity
- 4.3.1 By Region – Incremental Demand Through 2032
- 4.3.2 Segment – Incremental Demand
- 4.4 Emerging Submarket Opportunity Deep Dive (Subject to Applicability)
- 4.5 Priority Market Opportunity Scorecards
- 4.5.1 United States
- 4.5.2 Europe
- 4.5.3 Asia
- 4.5.4 Middle East & Africa
Note: Priority market opportunity scorecards reflect the geographic scope and strategic relevance of the study. Listed markets are indicative and may be adapted to the industry.
Chapter 5. Elderly Nutrition Cross-Border Trade & Market Access Analysis
- 5.1 International Trade & Cross-Border Activity Overview
- 5.1.1 Global Export Value by Country (2024)
- 5.1.2 Global Export Volume by Country (2024) (Volume Where Applicable)
- 5.1.3 Global Import Value by Country (2024)
- 5.1.4 Global Import Volume by Country (2024) (Volume Where Applicable)
- 5.1.5 Net Trade Balance by Country (2024)
- 5.2 Export Analysis – Segment
- 5.2.1 Category 1 (Applicable Classification Code)
- 5.2.2 Category 2 (Applicable Classification Code)
- 5.2.3 Category 3 (Applicable Classification Code)
- 5.2.4 Category 4 (Applicable Classification Code)
- 5.2.5 Category 5 (Applicable Classification Code)
- 5.3 Import Analysis – Segment
- 5.3.1 Category 1 (Applicable Classification Code)
- 5.3.2 Category 2 (Applicable Classification Code)
- 5.3.3 Category 3 (Applicable Classification Code)
- 5.3.4 Category 4 (Applicable Classification Code)
- 5.3.5 Category 5 (Applicable Classification Code)
- 5.4 Cross-Border Pricing & Transaction Benchmarks
- 5.4.1 Export Pricing – Segment & Country
- 5.4.2 Import Pricing – Segment & Source Country
- 5.4.3 Price Trends (2024)
- 5.5 Key Cross-Border Trade & Delivery Routes
- 5.5.1 Cross-Border Trade/Delivery Route 1
- 5.5.2 Cross-Border Trade/Delivery Route 2
- 5.5.3 Cross-Border Trade/Delivery Route 3
- 5.5.4 Cross-Border Trade/Delivery Route 4
- 5.5.5 Cross-Border Trade/Delivery Route 5
- 5.6 Trade Policy & Market Access Impact Assessment
- 5.6.1 Tariff & Non-Tariff Barriers
- 5.6.2 Regional Trade & Economic Integration Frameworks
- 5.6.3 Bilateral & Multilateral Trade Agreements
- 5.6.4 Cross-Border Operating, Licensing & Localization Requirements
Note: This chapter applies where cross-border trade or delivery is relevant to Elderly Nutrition. Goods, services, and digital offerings are assessed using applicable classifications and transaction measures. Import-export volumes, trade balances, and route analyses are included only where meaningful to the market.
Chapter 6. Competitive Landscape & Company Benchmarking
- 6.1 Elderly Nutrition Market Concentration & Structure
- 6.1.1 Herfindahl-Hirschman Index (HHI) – vs. 2024
- 6.1.2 Leading, Mid-Sized & Emerging Player Structure
- 6.1.3 Global, Regional & Local Player Dynamics
- 6.2 Elderly Nutrition Market Share Analysis – 2024
- 6.2.1 Global Revenue Share by Company
- 6.2.2 Global Volume Share by Company (Volume Where Applicable)
- 6.2.3 Regional Revenue Share
- 6.2.4 Market Share Evolution ( vs. 2024)
- 6.2.5 Company Market Share by Key Segment
- 6.2.6 Company Market Share by Customer Group
- 6.3 Operating Scale, Capacity & Infrastructure Analysis
- 6.3.1 Global Operating Scale & Supply Capacity
- 6.3.2 Resource Utilization & Operating Efficiency
- 6.3.3 Output, Service Delivery & Activity Metrics
- 6.3.4 Operating Footprint & Infrastructure Map
- 6.3.5 Planned Operational & Capacity Expansion
- 6.4 Elderly Nutrition Competitive Benchmarking Matrix
- 6.4.1 Revenue, Growth, Profitability & Operating Metric Comparison
- 6.4.2 Channel Revenue Mix
- 6.4.3 Geographic Revenue Exposure
- 6.4.4 R&D Intensity
- 6.4.5 Sustainability Maturity
- 6.5 Strategic Developments in Elderly Nutrition (Last 24 Months)
- 6.5.1 Mergers, Acquisitions & Divestments
- 6.5.2 New Products, Services & Solutions in Elderly Nutrition
- 6.5.3 Operational & Infrastructure Expansions
- 6.5.4 Strategic Alliances, Joint Ventures & Partnerships
- 6.5.5 Distribution Expansion & Market Entry
- 6.5.6 Sustainability & ESG Initiatives
- 6.6 Competitive Strategy Mapping
- 6.6.1 Leader, Challenger, Follower & Niche Classification
- 6.6.2 Pricing Strategy Comparison
- 6.6.3 Channel Strategy Matrix
Note: Strategic developments are included based on their materiality and the availability of reliable information.
Chapter 7. Global Elderly Nutrition Market – By Sales & Delivery Channel
- 7.1 Segment Overview
- 7.1.1 Volume & Revenue Split by Channel (2024 & 2032) (Volume Where Applicable)
- 7.1.2 Channel Mix Evolution (2024-2032)
Chapter 8. Regional Market Analysis – Global Overview
- 8.1 Global Regional Overview
- 8.1.1 Regional Volume Share (Volume Where Applicable)
- 8.1.2 Regional Revenue Share
- 8.1.3 Regional Volume by Region (Volume Where Applicable)
- 8.1.4 Regional Revenue by Region
- 8.1.5 Regional Forecast Through 2032
- 8.2 Cross-Regional Segment Analysis
- 8.2.1 By Sales & Delivery Channel
- 8.2.2 By Competitive Positioning & Price Tier
Chapter 9. North America Elderly Nutrition Market
- 9.1 United States
- 9.2 Canada
- 9.3 Mexico
Chapter 10. Europe Elderly Nutrition Market
- 10.1 Germany
- 10.2 France
- 10.3 Italy
- 10.4 United Kingdom
- 10.5 Spain
- 10.6 Poland
- 10.7 Russia
- 10.8 Netherlands
- 10.9 Belgium
- 10.10 Sweden
- 10.11 Denmark
- 10.12 Norway
- 10.13 Rest of Europe
Chapter 11. Asia Pacific Elderly Nutrition Market
- 11.1 China
- 11.2 India
- 11.3 Japan
- 11.4 South Korea
- 11.5 Thailand
- 11.6 Indonesia
- 11.7 Vietnam
- 11.8 Malaysia
- 11.9 Australia
- 11.10 Rest of Asia Pacific
Chapter 12. Latin America Elderly Nutrition Market
- 12.1 Brazil
- 12.2 Argentina
- 12.3 Colombia
- 12.4 Chile
- 12.5 Rest of Latin America
Chapter 13. Middle East Elderly Nutrition Market
- 13.1 Saudi Arabia
- 13.2 United Arab Emirates
- 13.3 Turkey
- 13.4 Israel
- 13.5 Iran
- 13.6 Rest of the Middle East
Chapter 14. Africa Elderly Nutrition Market
- 14.1 South Africa
- 14.2 Egypt
- 14.3 Nigeria
- 14.4 Morocco
- 14.5 Rest of Africa
Chapter 15. Elderly Nutrition Company Profiles
- 15.1 [Company 01]
- 15.1.1 Company Overview
- 15.1.2 Key Management Personnel
- 15.1.3 Products & Services Portfolio
- 15.1.4 Financial Performance
- 15.1.5 Key Market Focus & Geographic Presence
- 15.1.6 Recent Developments & Strategic Initiatives
Note: The company profile list is preliminary and may change based on research findings, market developments, data availability, and client requirements.
Chapter 16. Appendices
- Appendix A – List of Abbreviations & Acronyms
- Appendix B – Industry Classification Code Reference – Full Series
- Appendix C – Supply, Output & Operating Capacity Data Tables
- Appendix D – End-Use & Demand Base Tables
- Appendix E – Demand, Adoption & Usage Assumptions
- Appendix F – Pricing & Revenue Metric Reference Tables
- Appendix G – Company Operations & Infrastructure Database
- Appendix H – Cross-Border Trade & Activity Data Tables (Where Applicable)
- Appendix I – Regulatory Summary Tables
- Appendix J – Primary Research Participant List (Anonymized)
- Appendix K – Primary Research Questionnaire Framework
- Appendix L – Data Sources & Bibliography
- Appendix M – Market Size Divergence & Source Comparison
Chapter 17. Research Methodology
- 17.1 Research Framework & Philosophy
- 17.2 Secondary Research – Sources, Hierarchy & Data Extraction
- 17.3 Data Modeling – Bottom-Up & Top-Down Market Sizing
- 17.4 Primary Research – Stakeholder Framework, LOI & Sample Sizes
- 17.5 Forecast Methodology – Regression, Scenario & Sensitivity Analysis
- 17.6 Quality Control – Four-Layer Validation Framework
- 17.7 Limitations & Standard Assumptions
- 17.8 Disclaimer
