
Market Overview:
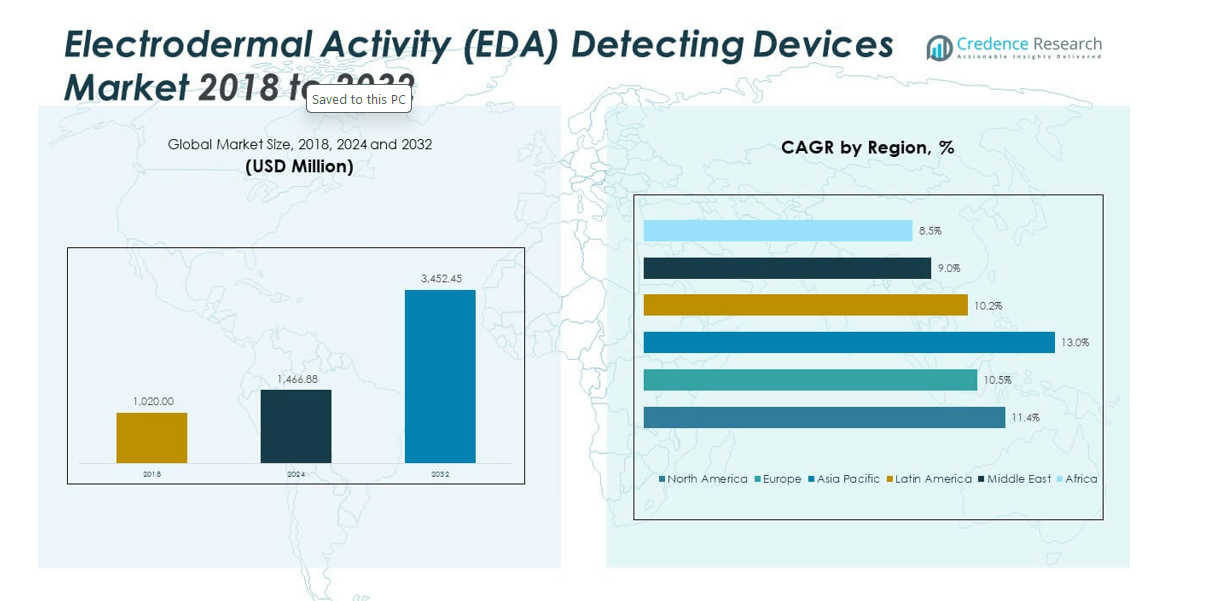
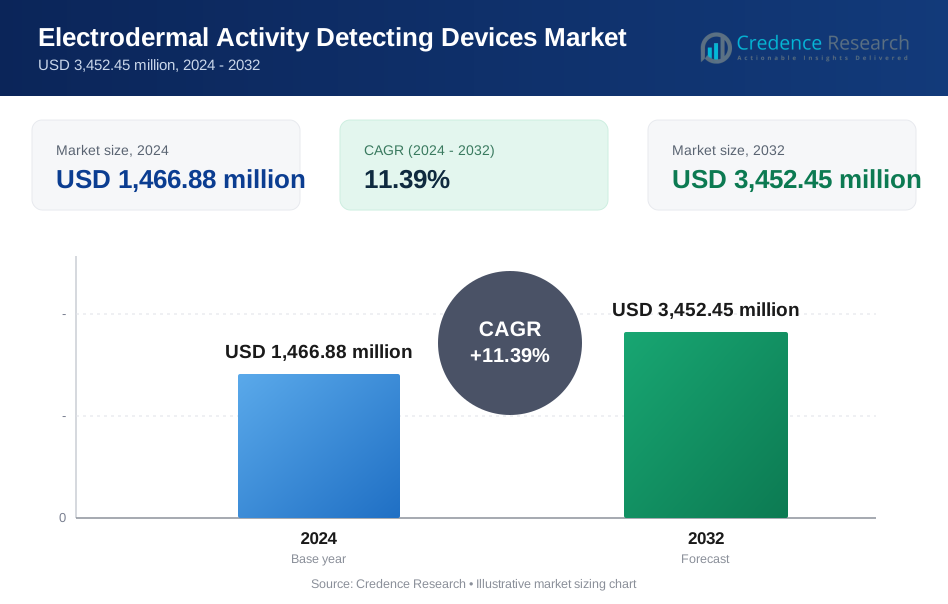
The Electrodermal Activity Detecting Devices Market size was valued at USD 1,020.00 million in 2018 to USD 1,466.88 million in 2024 and is anticipated to reach USD 3,452.45 million by 2032, at a CAGR of 11.39% during the forecast period.
| REPORT ATTRIBUTE | DETAILS |
|---|---|
| Historical Period | 2020-2023 |
| Base Year | 2024 |
| Forecast Period | 2025-2032 |
| Electrodermal Activity Detecting Devices Market Size 2024 | USD 1,466.88 million |
| Electrodermal Activity Detecting Devices Market, CAGR | 11.39% |
| Electrodermal Activity Detecting Devices Market Size 2032 | USD 3,452.45 million |
Growing need for real-time emotional and physiological assessment drives market expansion. Healthcare providers adopt EDA systems to support behavioral evaluations and mental health programs. Wearable technology companies enhance sensor precision to improve stress detection accuracy. Research institutions use EDA data to map cognitive load and human response behavior. Developers design compact devices to support round-the-clock monitoring. Sports professionals rely on EDA insights to evaluate performance and recovery patterns. Rising global interest in wellness and digital health accelerates the use of advanced EDA-based tools.
North America leads market adoption due to strong presence of digital health innovators and widespread use of wearables. Europe follows with structured healthcare systems that integrate physiological monitoring into clinical workflows. Asia Pacific emerges as a fast-growing region driven by expanding consumer electronics manufacturing and growing wellness awareness. Countries across this region invest in smart health devices to support preventive care and remote monitoring. Latin America and the Middle East show steady progress with rising healthcare modernization and increasing acceptance of biometric wellness tools.
Market Insights:
- The Electrodermal Activity Detecting Devices Market grew from USD 1,020.00 million in 2018 to USD 1,466.88 million in 2024 and is projected to reach USD 3,452.45 million by 2032, reflecting a strong CAGR of 11.39% across the period.
- Asia Pacific, Africa, and the Middle East hold the top three regional growth positions, with CAGRs of 0%, 11.4%, and 10.5%, driven by rapid wearable adoption, rising wellness awareness, and expanding digital health ecosystems.
- Asia Pacific stands out as the fastest-growing region, supported by strong electronics manufacturing, large youth populations, and rising use of smart health devices across consumer and clinical settings.
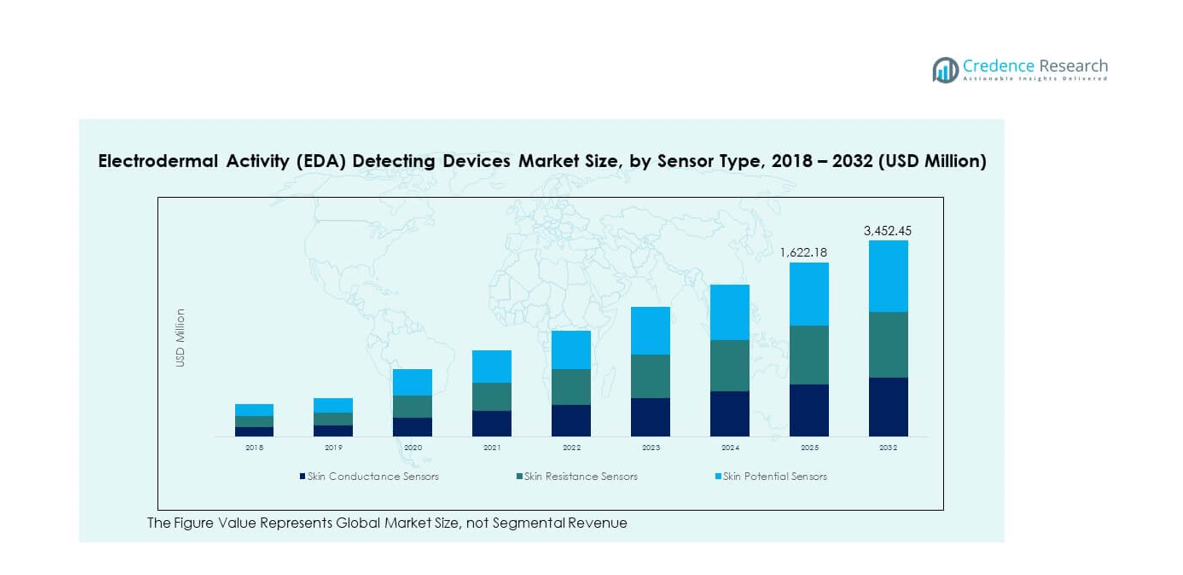
- Based on visual distribution, skin conductance sensors account for roughly 30% of the sensor-type segment, reflecting their dominant use in stress monitoring and clinical behavioral studies.
- Skin resistance and skin potential sensors together make up the remaining ~70%, split nearly evenly, indicating growing adoption in advanced research and multi-parameter physiological analysis.
Market Drivers
Growing Adoption of Stress and Emotional Monitoring Across Healthcare and Wellness Programs
Rising mental health concerns push strong interest in physiological tracking tools. Hospitals adopt EDA sensors to support therapy planning and patient assessment. The Electrodermal Activity Detecting Devices Market benefits from wider research use in stress profiling. Clinics value real-time skin conductance insights for behavioral evaluation. Wearable brands integrate the sensors to improve emotional wellness features. Corporates deploy these tools to monitor employee stress levels. Developers refine sensor accuracy to support clinical-grade outcomes. The technology gains steady momentum due to strong wellness awareness.
Expansion of Wearable Technology Ecosystems and Smart Sensor Integration
Growing shipments of consumer wearables drive deeper use of EDA sensors. Device makers deploy compact modules that capture micro-level physiological shifts. The integration supports sleep tracking, focus analysis, and stress scoring. The Electrodermal Activity Detecting Devices Market gains traction through broad wearable adoption. Developers improve battery design to support long-duration monitoring. Startups explore multi-sensor fusion with heart rate and temperature. Fitness brands use EDA feedback to refine coaching tools. The ecosystem expands with strong consumer demand for health insights.
Increasing Research Use in Cognitive Science, Behavior Mapping, and Human–Machine Studies
Universities and labs adopt EDA tools for deeper emotional pattern analysis. Cognitive researchers track arousal levels to understand human response behavior. The Electrodermal Activity Detecting Devices Market benefits from continuous academic use. Research teams evaluate attention, decision-making, and workload patterns. The technology supports neurobehavioral experiments with high data granularity. Software platforms enhance analytics for real-time interpretation. Funding bodies support digital behavior research initiatives. Human–machine interaction studies use EDA to refine adaptive systems.
- For instance, researchers at Florida International University used EA/Anti-Cortisol antibody/DTSP-SAM/Gold IDEs to build an electrochemical immunosensor that detected cortisol in human saliva across a range of 10 pg/mL to 100 ng/mL, with a detection limit of 10 pg/mL and a sensitivity of 6 µA/(pg mL⁻¹). The sensor output correlated closely with standard ELISA measurements.
Rising Demand for Continuous Monitoring in Digital Therapeutics and Remote Care Models
Healthcare providers adopt digital tools to extend behavioral monitoring. Remote platforms use EDA data to track patient stress trends. The Electrodermal Activity Detecting Devices Market grows with wider telehealth acceptance. Digital therapeutics integrate conductance metrics to support guided treatments. Real-time inputs help clinicians personalize support plans. Developers scale cloud analytics to manage high data loads. Behavioral apps rely on EDA feedback to strengthen therapy engagement. The model gains acceptance due to rising need for scalable care.
- For instance, Philips partnered with NOWATCH to integrate its Biosensing by EDA technology into wearables, enabling real-time tracking of skin conductance changes driven by sweat gland activity under sympathetic nervous system control. The system helps identify stress responses and emotional arousal linked to the body’s fight-or-flight mechanism.
Market Trends
Advancement of AI-Enabled Signal Interpretation and Predictive Behavioral Analytics
AI platforms refine interpretation of EDA signals for higher predictive accuracy. Developers train models to detect stress transitions with improved precision. The Electrodermal Activity Detecting Devices Market adopts smarter algorithms for better insights. Machine learning supports differentiation between emotional triggers. Cloud engines process large datasets for deeper behavior mapping. Predictive alerts support real-time decision support tools. Startups build platforms with automated pattern recognition. Product innovation aligns with demand for actionable emotional metrics.
Growth of Multi-Sensor Health Platforms and Integration with Broader Biometric Suites
Companies merge EDA with EEG, ECG, temperature, and motion data. The unified platform supports holistic physiological tracking. The Electrodermal Activity Detecting Devices Market shifts toward multi-modal assessment. Health brands build ecosystems that link devices, apps, and cloud dashboards. Clinicians value richer data profiles for better diagnosis support. Wellness companies use the broader data to improve user guidance. Integrators deploy hybrid devices for lifestyle and medical uses. Multi-sensor adoption aligns with demand for deeper personalization.
- For instance, Empatica E4 wearable integrates high-resolution EDA with other biometrics using advanced signal processing for robust continuous monitoring without frequent recalibrations.
Wider Use of EDA Tools in User Experience Testing and Immersive Technology Development
Product developers use EDA sensors to measure emotional responses during testing. Gaming studios study player engagement for design improvements. The Electrodermal Activity Detecting Devices Market expands into UX and media analytics. VR and AR creators use physiological data to adjust interactive elements. Advertising firms analyze emotional reactions to refine campaigns. Research groups test biometric cues to gauge content impact. Companies value the method for its non-invasive measurement. The approach improves realism in immersive design.
Rising Commercial Deployment Across Workplace Wellness, Safety Programs, and Predictive Fatigue Tools
Enterprises adopt EDA tools to monitor stress in high-demand roles. Fatigue detection platforms use conductance signals to track worker alertness. The Electrodermal Activity Detecting Devices Market gains interest from industrial and service sectors. Corporate wellness programs rely on EDA feedback to strengthen support models. Developers design rugged sensors for field environments. Safety teams use the insights to lower incident risk. Predictive fatigue tools receive traction across transport and logistics. Employers value data-driven insights for workforce health.
- For instance, BIOPAC Systems provides EDA acquisition hardware with 16-bit resolution (wired mode), enabling high-quality, research-grade skin conductance and SCR recording for psychophysiology and stress studies.
Market Challenges Analysis
High Calibration Needs, Signal Artefacts, and Data Interpretation Complexity in Clinical and Commercial Use
EDA readings require consistent calibration to maintain reliability. Daily variation, sweat levels, and motion noise disrupt data quality. The Electrodermal Activity Detecting Devices Market faces complexity in ensuring accuracy. Clinicians need training to interpret conductance signals correctly. Developers work to reduce noise through improved algorithms. Hardware adjustments aim to minimize environmental interference. End-users expect simple output, which raises integration pressure. These factors slow wider acceptance in regulated environments.
Privacy Concerns, Limited Standardization, and Uneven Regulatory Clarity Across Regions
Biometric data collection raises concerns about personal emotional profiling. Regulatory bodies vary in requirements for sensor-based wellness tools. The Electrodermal Activity Detecting Devices Market navigates inconsistent compliance demands. Companies need strong data protection frameworks to build trust. Industry groups push for common protocols to support interoperability. Limited standards create challenges in cross-platform performance. Privacy guidelines evolve slowly in several regions. These gaps hinder full-scale commercial deployment.
Market Opportunities
Expansion of EDA Use in Mental Health Platforms, Personalized Wellness, and AI-Driven Therapy Models
Mental health applications present a strong growth window for sensor makers. Behavioral platforms use EDA feedback to tailor user guidance. The Electrodermal Activity Detecting Devices Market gains new pathways through digital care. AI systems use long-term conductance trends to support therapy personalization. Consumer interest in emotional awareness pushes wider adoption. Startups build wellness devices with guided stress programs. Health systems explore integration into remote care models. These trends open strong demand for advanced sensors.
Growing Role in Human–Machine Collaboration, Autonomous Systems, and Adaptive Workplace Tools
Future workplaces adopt EDA inputs to support adaptive systems. Predictive engines adjust workflows based on stress indicators. The Electrodermal Activity Detecting Devices Market benefits from rising interest in responsive environments. Robotics teams use emotional cues to refine interaction models. Human–machine interfaces evolve with deeper physiological context. Developers build platforms that adjust training loads based on arousal signals. Enterprises explore these insights for performance improvement. These advancements create meaningful commercial opportunities.
Market Segmentation Analysis:
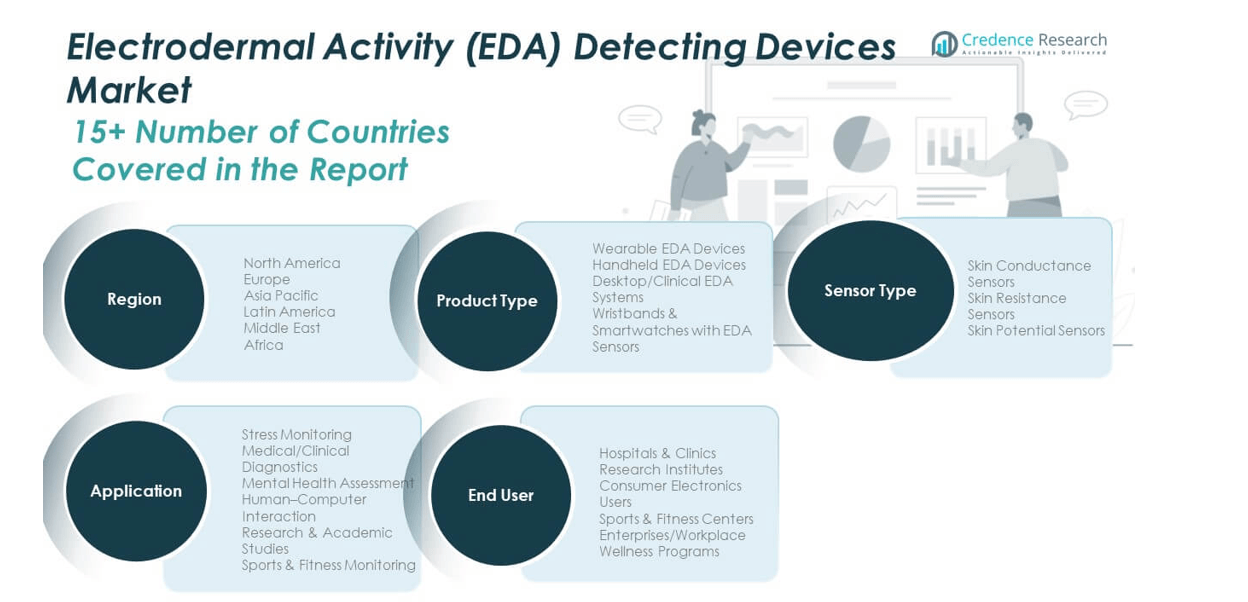
By Product, the Electrodermal Activity Detecting Devices Market shows strong diversity across product categories that address both clinical and consumer needs. Wearable EDA devices lead adoption due to rising interest in stress tracking and emotional wellness. Handheld devices support researchers that need portable measurement tools for field studies. Desktop and clinical systems remain vital for hospitals that require high-accuracy readings. Wristbands and smartwatches with EDA sensors expand rapidly through consumer electronics, offering continuous monitoring in daily routines. Each product type serves a distinct role and supports wider integration across health and lifestyle applications.
By Sensor type segmentation strengthens the technical structure of the market. Skin conductance sensors dominate because they provide stable and reliable measurements of physiological arousal. Skin resistance sensors support research groups that focus on detailed electrical changes during behavioral studies. Skin potential sensors gain traction among advanced academic teams that explore deeper neurophysiological responses. Each sensor type enhances the capability of EDA systems and supports specialized applications across multiple industries.
By Application-based segmentation highlights the broad functional landscape linked to emotional and physiological tracking. Stress monitoring leads due to strong demand from wellness programs and consumer-focused devices. Medical diagnostics rely on EDA to support patient evaluation workflows. Mental health assessments use conductance patterns to study emotional states. Human–computer interaction benefits from EDA data that improves adaptive system behavior. Research and academic groups use the signals for controlled experiments, while sports and fitness users track arousal and performance patterns.
- For example, BrainSigns Srl develops biosignal-processing platforms designed to detect changes in physiological signals (such as brain and autonomic indicators) for out-of-lab monitoring and research on mental states.
By End-user segmentation remains diverse in its adoption patterns. Hospitals and clinics rely on EDA tools for clinical assessments that support diagnostic decisions. Research institutes use the devices to conduct structured behavior studies. Consumer electronics users adopt smart wearables for daily wellness tracking. Sports and fitness centers deploy EDA insights to evaluate athlete stress levels. Enterprises and workplace wellness programs use EDA feedback to strengthen employee well-being strategies and performance models.
- For example, companies such as PLUX Wireless Biosignals S.A. provide rugged EDA monitoring systems suitable for clinical and sports environments, supporting diverse end-user requirements from healthcare to fitness and workplace wellness programs.
Segmentation:
By Product Type
- Wearable EDA Devices
- Handheld EDA Devices
- Desktop/Clinical EDA Systems
- Wristbands & Smartwatches with EDA Sensors
By Sensor Type
- Skin Conductance Sensors
- Skin Resistance Sensors
- Skin Potential Sensors
By Application
- Stress Monitoring
- Medical/Clinical Diagnostics
- Mental Health Assessment
- Human–Computer Interaction
- Research & Academic Studies
- Sports & Fitness Monitoring
By End User
- Hospitals & Clinics
- Research Institutes
- Consumer Electronics Users
- Sports & Fitness Centers
- Enterprises/Workplace Wellness Programs
By Region
- North America
- U.S.
- Canada
- Mexico
- Europe
- Germany
- France
- U.K.
- Italy
- Spain
- Rest of Europe
- Asia Pacific
- China
- Japan
- India
- South Korea
- South-east Asia
- Rest of Asia Pacific
- Latin America
- Brazil
- Argentina
- Rest of Latin America
- Middle East & Africa
- GCC Countries
- South Africa
- Rest of the Middle East and Africa
Regional Analysis:
North America
The North America Electrodermal Activity Detecting Devices Market size was valued at USD 466.14 million in 2018 to USD 663.90 million in 2024 and is anticipated to reach USD 1,560.86 million by 2032, at a CAGR of 11.4% during the forecast period. North America holds an estimated 45% market share, driven by early adoption of wearable health technologies and advanced stress monitoring systems. It benefits from high research funding and the presence of established players such as Empatica, Garmin, and Fitbit. Healthcare institutions integrate EDA-based tools for behavioral assessment and clinical trials. Growing corporate wellness programs enhance adoption among enterprises. Universities and research bodies deploy these devices for psychophysiological studies. Strong regulatory frameworks support product reliability and interoperability. The region continues to dominate with large-scale integration of biosensing technologies in medical and consumer segments.
Europe
The Europe Electrodermal Activity Detecting Devices Market size was valued at USD 239.70 million in 2018 to USD 329.71 million in 2024 and is anticipated to reach USD 727.61 million by 2032, at a CAGR of 10.5% during the forecast period. Europe contributes roughly 22% of the global share, supported by well-established healthcare infrastructure and R&D investments in wearable biosensors. It benefits from strong academic collaboration in stress analysis and neurobehavioral research. Companies across Germany, the UK, and France lead innovation in EDA-enabled diagnostics and wellness tracking. Regulatory bodies promote safe use of physiological sensors in healthcare and personal monitoring. European enterprises integrate EDA systems into workforce wellness initiatives. Expanding digital health frameworks enhance clinical adoption. The regional market advances with strong emphasis on patient safety and device accuracy.
Asia Pacific
The Asia Pacific Electrodermal Activity Detecting Devices Market size was valued at USD 215.22 million in 2018 to USD 325.42 million in 2024 and is anticipated to reach USD 857.25 million by 2032, at a CAGR of 13.0% during the forecast period. Asia Pacific holds about 21% market share, showing the fastest regional growth due to expanding consumer electronics manufacturing and digital wellness initiatives. Countries such as China, Japan, and South Korea lead in integrating biosensors into smart devices. Growing health awareness supports wider use of wearable stress monitoring tools. Research centers in India and Australia invest in psychophysiological studies using EDA data. Government-backed digital health missions improve access to biometric monitoring. Regional startups collaborate with global firms to produce affordable sensors. The region’s growing young population accelerates adoption across fitness and lifestyle applications.
Latin America
The Latin America Electrodermal Activity Detecting Devices Market size was valued at USD 55.90 million in 2018 to USD 79.49 million in 2024 and is anticipated to reach USD 171.48 million by 2032, at a CAGR of 10.2% during the forecast period. Latin America accounts for about 7% of the global market share, with expanding use of biosignal technologies in wellness and healthcare. Brazil leads regional adoption due to rising digital health investments. Hospitals integrate EDA-based tools for patient stress evaluation. Consumer interest in smart health wearables strengthens market penetration. Research institutes apply biosignal analytics for behavioral assessment. Local distributors expand partnerships with global sensor manufacturers. Growth in preventive care programs supports long-term device deployment. The region advances steadily toward broader sensor integration across healthcare and wellness applications.
Middle East
The Middle East Electrodermal Activity Detecting Devices Market size was valued at USD 24.99 million in 2018 to USD 32.41 million in 2024 and is anticipated to reach USD 64.23 million by 2032, at a CAGR of 9.0% during the forecast period. The region represents nearly 3% of the global market, supported by rising healthcare digitization and increasing wellness awareness. GCC countries lead adoption due to investments in smart healthcare and mental health programs. Hospitals in the UAE and Saudi Arabia introduce wearable-based stress monitoring systems. Technology partnerships enhance device availability in clinical settings. The market benefits from growing enterprise wellness initiatives. Manufacturers focus on durable and climate-adaptive EDA devices suitable for regional conditions. It continues to develop as governments prioritize preventive health monitoring.
Africa
The Africa Electrodermal Activity Detecting Devices Market size was valued at USD 18.05 million in 2018 to USD 35.94 million in 2024 and is anticipated to reach USD 71.01 million by 2032, at a CAGR of 8.5% during the forecast period. Africa accounts for about 2% of the global share, driven by gradual adoption of wearable and biosignal technologies. South Africa leads market activity with growing health-tech startups. EDA tools support stress management initiatives and clinical research in urban centers. Expanding mobile connectivity encourages adoption of low-cost monitoring solutions. International collaborations strengthen research capacity in behavioral health. Hospitals integrate digital monitoring in rehabilitation programs. The region experiences steady progress in healthcare innovation and localized sensor development. It shows strong potential for long-term adoption across telehealth and preventive wellness.
Key Player Analysis:
- Empatica
- Garmin
- Fitbit (Google)
- Shimmer Research
- Mindfield Biosystems
- BIOPAC Systems
- iMotions
- Affectiva
- EdaLog
- PLUX Wireless Biosignals
- NeuroSky
- ProComp
- Samsung
- Apple
- Nemaura Medical
Competitive Analysis:
The Electrodermal Activity Detecting Devices Market features strong competition among global and regional players focused on biosignal accuracy, sensor integration, and data analytics. Key companies such as Empatica, BIOPAC Systems, PLUX Wireless Biosignals, iMotions, and Nemaura Medical lead innovation through hardware precision and research-grade performance. It evolves with partnerships that merge hardware and AI platforms to deliver predictive insights from physiological data. Firms strengthen portfolios with multi-sensor wearables combining EDA, PPG, and temperature monitoring. Startups focus on compact, energy-efficient modules suitable for continuous data collection. Major brands emphasize validation studies to meet clinical research standards and consumer reliability benchmarks. Companies compete through improved real-time analytics, interoperability, and stress detection accuracy. It continues to advance through product differentiation, ecosystem collaborations, and expanding applications across healthcare, research, and workplace wellness sectors.
Recent Developments:
- In September 2025, Garmin partnered with Meta to integrate real-time biometric data from AI glasses and smartwatches, enhancing capabilities in the wearable health tech market that includes electrodermal activity monitoring.
- In July 2025, Garmin acquired Mylaps to bolster race timing and performance tracking, expanding data integration relevant to biometric wearables in fitness and health sectors.
Report Coverage:
The research report offers an in-depth analysis based on Product Type, Sensor Type, Application and End User. It details leading market players, providing an overview of their business, product offerings, investments, revenue streams, and key applications. Additionally, the report includes insights into the competitive environment, SWOT analysis, current market trends, as well as the primary drivers and constraints. Furthermore, it discusses various factors that have driven market expansion in recent years. The report also explores market dynamics, regulatory scenarios, and technological advancements that are shaping the industry. It assesses the impact of external factors and global economic changes on market growth. Lastly, it provides strategic recommendations for new entrants and established companies to navigate the complexities of the market.
Future Outlook:
- The Electrodermal Activity Detecting Devices Market is expected to advance rapidly with expanding adoption across healthcare, research, and wellness sectors supported by biosensing innovation.
- Integration of AI and machine learning will enhance interpretation accuracy of emotional and stress-related patterns for predictive behavioral analytics.
- Wearable technology manufacturers will continue embedding EDA sensors into consumer devices for real-time stress and wellness monitoring.
- Medical institutions will expand use of EDA-based systems for mental health diagnostics, behavioral research, and patient rehabilitation programs.
- The market will see higher demand for multi-sensor systems combining EDA with PPG, temperature, and motion sensors to provide richer physiological insights.
- Enterprise wellness platforms will increasingly adopt EDA devices to assess employee well-being and productivity across corporate environments.
- Advances in signal processing will improve data clarity, reducing motion artifacts and enhancing real-world usability.
- Startups and research collaborations will drive affordability through open biosignal platforms and modular sensor technologies.
- Regulatory approvals will strengthen credibility of EDA devices for clinical-grade monitoring and stress detection applications.
- Expanding awareness of emotional health and remote patient monitoring will position EDA technologies as key components in next-generation digital health ecosystems.
Request a Free Sample
Fill in your details and we'll send you a free sample report.
- Sample data tables & charts
- Research methodology
Need a Custom Version of This Report?
Tailor the scope, geography, or segments to your exact requirements.
- Custom geography or segment scope
- Direct access to our analyst team
Frequently Asked Questions
What is the current market size for Electrodermal Activity Detecting Devices Market, and what is its projected size in 2032?
At what Compound Annual Growth Rate is the Electrodermal Activity Detecting Devices Market projected to grow between 2025 and 2032?
Which Electrodermal Activity Detecting Devices Market segment held the largest share in 2024?
What are the primary factors fueling the growth of the Electrodermal Activity Detecting Devices Market?
Who are the leading companies in the Electrodermal Activity Detecting Devices Market?
Which region commanded the largest share of the Electrodermal Activity Detecting Devices Market in 2024?
Table of Content
Chapter 1. Report Introduction
- 1.1 Report Description & Purpose
- 1.1.1 Report Title & Market Definition
- 1.1.2 Unique Selling Propositions (USP) & Key Differentiators
- 1.1.3 Value Proposition for Stakeholders
- 1.2 Research Objectives
- 1.2.1 Market Sizing Objectives (Volume & Revenue)
- 1.2.2 Segmentation Objectives
- 1.2.3 Competitive Intelligence Objectives
- 1.2.4 Forecast & Scenario Objectives
- 1.3 Report Scope
- 1.3.1 Electrodermal Activity Detecting Devices Scope – Types & Subtypes Covered
- 1.3.2 Geographic Scope – Regions & Countries Covered
- 1.3.3 Historical Period, Base Year & Forecast Period (2024; forecast to 2032)
- 1.3.4 Inclusions & Exclusions
- 1.4 HS Code & Classification Framework
- 1.5 Currency, Units & Pricing Basis
- 1.6 Target Stakeholders
- 1.7 Limitations & Assumptions
Chapter 2. Executive Summary
- 2.1 Global Electrodermal Activity Detecting Devices Market Snapshot
- 2.1.1 Market Size – Historical (2024) & Forecast (2024-2032) (2024: USD 1,466.88 million → 2032: USD 3,452.45 million)
- 2.1.2 Volume & Revenue – Global Totals
- 2.1.3 Key Market Highlights – Top Five Facts
- 2.2 Electrodermal Activity Detecting Devices Market Segmentation Snapshot
- 2.2.1 Market Split by Region – 2024 vs. 2032
- 2.3 Competitive Snapshot
- 2.3.1 Top 10 Players by Revenue Share – 2024
- 2.3.2 Top 10 Players by Volume Share – 2024
- 2.3.3 Recent Strategic Developments (18-Month Summary)
- 2.4 Key Investment Highlights & Strategic Conclusions
Chapter 3. Electrodermal Activity Detecting Devices Market Dynamics & Industry Analysis
- 3.1 Market Overview & Context
- 3.1.1 Electrodermal Activity Detecting Devices Market Position in the Broader Automotive Value Chain
- 3.1.2 OEM vs. Replacement Market Dynamics
- 3.1.3 Market Maturity & Development Stage by Region
- 3.2 Electrodermal Activity Detecting Devices Market Drivers
- 3.3 Electrodermal Activity Detecting Devices Market Restraints & Challenges
- 3.4 Electrodermal Activity Detecting Devices Market Opportunities
- 3.5 Porter's Five Forces Analysis
- 3.5.1 Threat of New Entrants
- 3.5.2 Bargaining Power of Suppliers
- 3.5.3 Bargaining Power of Buyers
- 3.5.4 Threat of Substitutes
- 3.5.5 Competitive Rivalry – Intensity Assessment
- 3.6 Electrodermal Activity Detecting Devices Value Chain Analysis
- 3.6.1 Upstream – Raw Material/Input Suppliers
- 3.6.1.1 Raw Material/Input 1
- 3.6.1.2 Raw Material/Input 2
- 3.6.1.3 Raw Material/Input 3
- 3.6.2 Midstream – Production/Manufacturing/Service Delivery
- 3.6.2.1 Production/Process Overview
- 3.6.2.2 Key Facility Locations & Capacity by Manufacturer
- 3.6.3 Downstream – Distribution & End Consumer
- 3.6.3.1 Primary Channel – B2B/OEM
- 3.6.3.2 Secondary Channels – Dealer, Retail, Online, Direct
- 3.6.4 Value Chain Profitability Analysis
- 3.6.1 Upstream – Raw Material/Input Suppliers
- 3.7 PESTEL Analysis
- 3.7.1 Political Factors
- 3.7.2 Economic Factors
- 3.7.3 Social Factors
- 3.7.4 Technological Factors
- 3.7.5 Environmental Factors
- 3.7.6 Legal Factors
- 3.8 Electrodermal Activity Detecting Devices Supply Chain Analysis
- 3.8.1 Raw Material/Input Supply Risk Assessment
- 3.8.2 Manufacturing Concentration Risk (Geographic Exposure)
- 3.8.3 Trade Disruption Impact Analysis
- 3.9 Regulatory & Policy Landscape
Note: The regulatory and policy landscape section covers regulations based on their applicability to the market, Electrodermal Activity Detecting Devices category, geography, and scope of the study. Only regulatory frameworks with a material impact on operations, compliance, trade, sustainability, or market access are analyzed in detail.
Chapter 4. Key Investment Pockets & Opportunity Analysis
- 4.1 Electrodermal Activity Detecting Devices Market Attractiveness Analysis
- 4.1.1 By Region – Investment Attractiveness Matrix (Volume × CAGR)
- 4.2 Absolute Revenue Growth Opportunity
- 4.2.1 By Region – Absolute USD Growth Through 2032
- 4.3 Incremental Volume Opportunity
- 4.3.1 By Region – Incremental Volume Through 2032
- 4.3.2 Segment – Incremental Volume
- 4.4 Emerging Submarket Opportunity Deep Dive (Subject to Applicability)
- 4.5 Emerging Market Opportunity Scorecards
- 4.5.1 United States
- 4.5.2 Europe
- 4.5.3 Asia
- 4.5.4 Middle East & Africa
Note: Emerging Market Opportunity Scorecards will be included based on relevance and strategic importance. Regions listed are indicative and may vary depending on data availability and market dynamics.
Chapter 5. Electrodermal Activity Detecting Devices Import-Export Analysis & Trade Flows
- 5.1 Global Trade Overview
- 5.1.1 Global Export Value by Country (2024)
- 5.1.2 Global Export Volume by Country (2024)
- 5.1.3 Global Import Value by Country (2024)
- 5.1.4 Global Import Volume by Country (2024)
- 5.1.5 Net Trade Balance by Country (2024)
- 5.2 Export Analysis – Segment
- 5.2.1 Type 1 (HS Code)
- 5.2.2 Type 2 (HS Code)
- 5.2.3 Type 3 (HS Code)
- 5.2.4 Type 4 (HS Code)
- 5.2.5 Type 5 (HS Code)
- 5.3 Import Analysis – Segment
- 5.3.1 Type 1 (HS Code)
- 5.3.2 Type 2 (HS Code)
- 5.3.3 Type 3 (HS Code)
- 5.3.4 Type 4 (HS Code)
- 5.3.5 Type 5 (HS Code)
- 5.4 Average Unit Trade Prices
- 5.4.1 Average Export Price – Segment & Country
- 5.4.2 Average Import Price – Segment & Source Country
- 5.4.3 Price Trends (2024)
- 5.5 Key Trade Route Analysis
- 5.5.1 Trade Route 1
- 5.5.2 Trade Route 2
- 5.5.3 Trade Route 3
- 5.5.4 Trade Route 4
- 5.5.5 Trade Route 5
- 5.6 Trade Policy Impact Assessment
- 5.6.1 US Anti-Dumping & Section 301 Tariffs
- 5.6.2 EU Customs Union Impact
- 5.6.3 Major Free Trade Agreements
- 5.6.4 USMCA Rules of Origin
Note: Trade policy analysis will be included only where relevant to the Electrodermal Activity Detecting Devices market.
Chapter 6. Competitive Landscape & Company Benchmarking
- 6.1 Electrodermal Activity Detecting Devices Market Concentration & Structure
- 6.1.1 Herfindahl-Hirschman Index (HHI) – vs. 2024
- 6.1.2 Tier 1, Tier 2 & Tier 3 Market Structure
- 6.1.3 Global, Regional & Local Player Dynamics
- 6.2 Electrodermal Activity Detecting Devices Market Share Analysis – 2024
- 6.2.1 Global Revenue Share by Company
- 6.2.2 Global Volume Share by Company
- 6.2.3 Regional Revenue Share
- 6.2.4 Market Share Evolution ( vs. 2024)
- 6.2.5 OEM Segment Share by Company
- 6.2.6 Replacement Segment Share by Company
- 6.3 Production/Delivery Capacity & Facility Analysis
- 6.3.1 Global Installed Capacity
- 6.3.2 Capacity Utilization Rates
- 6.3.3 Production/Output Volume
- 6.3.4 Facility Locations & Capacity Map
- 6.3.5 Planned Capacity Additions
- 6.4 Electrodermal Activity Detecting Devices Competitive Benchmarking Matrix
- 6.4.1 Revenue, Volume, CAGR & Profitability Comparison
- 6.4.2 Channel Revenue Mix
- 6.4.3 Geographic Revenue Exposure
- 6.4.4 R&D Intensity
- 6.4.5 Sustainability Maturity
- 6.5 Strategic Developments in Electrodermal Activity Detecting Devices (Last 24 Months)
- 6.5.1 Mergers, Acquisitions & Divestments
- 6.5.2 New Electrodermal Activity Detecting Devices Launches
- 6.5.3 Facility Expansions
- 6.5.4 Strategic Alliances, Joint Ventures & Partnerships
- 6.5.5 Distribution Expansion & Market Entry
- 6.5.6 Sustainability & ESG Initiatives
- 6.6 Competitive Strategy Mapping
- 6.6.1 Leader, Challenger, Follower & Niche Classification
- 6.6.2 Pricing Strategy Comparison
- 6.6.3 Channel Strategy Matrix
Note: Strategic developments are included based on their materiality and the availability of reliable information.
Chapter 7. Global Electrodermal Activity Detecting Devices Market – By Distribution Channel
- 7.1 Segment Overview
- 7.1.1 Volume & Revenue Split by Channel (2024 & 2032)
- 7.1.2 Channel Mix Evolution (2024-2032)
Chapter 8. Regional Market Analysis – Global Overview
- 8.1 Global Regional Overview
- 8.1.1 Regional Volume Share
- 8.1.2 Regional Revenue Share
- 8.1.3 Regional Volume by Region
- 8.1.4 Regional Revenue by Region
- 8.1.5 Regional Forecast Through 2032
- 8.2 Cross-Regional Segment Analysis
- 8.2.1 By Distribution Channel
- 8.2.2 By Brand/Price Tier
Chapter 9. North America Electrodermal Activity Detecting Devices Market
- 9.1 United States
- 9.2 Canada
- 9.3 Mexico
Chapter 10. Europe Electrodermal Activity Detecting Devices Market
- 10.1 Germany
- 10.2 France
- 10.3 Italy
- 10.4 United Kingdom
- 10.5 Spain
- 10.6 Poland
- 10.7 Russia
- 10.8 Netherlands
- 10.9 Belgium
- 10.10 Sweden
- 10.11 Denmark
- 10.12 Norway
- 10.13 Rest of Europe
Chapter 11. Asia Pacific Electrodermal Activity Detecting Devices Market
- 11.1 China
- 11.2 India
- 11.3 Japan
- 11.4 South Korea
- 11.5 Thailand
- 11.6 Indonesia
- 11.7 Vietnam
- 11.8 Malaysia
- 11.9 Australia
- 11.10 Rest of Asia Pacific
Chapter 12. Latin America Electrodermal Activity Detecting Devices Market
- 12.1 Brazil
- 12.2 Argentina
- 12.3 Colombia
- 12.4 Chile
- 12.5 Rest of Latin America
Chapter 13. Middle East Electrodermal Activity Detecting Devices Market
- 13.1 Saudi Arabia
- 13.2 United Arab Emirates
- 13.3 Turkey
- 13.4 Israel
- 13.5 Iran
- 13.6 Rest of the Middle East
Chapter 14. Africa Electrodermal Activity Detecting Devices Market
- 14.1 South Africa
- 14.2 Egypt
- 14.3 Nigeria
- 14.4 Morocco
- 14.5 Rest of Africa
Chapter 15. Electrodermal Activity Detecting Devices Company Profiles
- 15.1 [Company 01]
- 15.1.1 Company Overview
- 15.1.2 Key Management Personnel
- 15.1.3 Products & Services Portfolio
- 15.1.4 Financial Performance
- 15.1.5 Key Market Focus & Geographic Presence
- 15.1.6 Recent Developments & Strategic Initiatives
Note: The company profile list is preliminary and may change based on research findings, market developments, data availability, and client requirements.
Chapter 16. Appendices
- Appendix A – List of Abbreviations & Acronyms
- Appendix B – Industry Classification Code Reference – Full Series
- Appendix C – Production & Capacity Data Tables
- Appendix D – End-Use & Demand Base Tables
- Appendix E – Consumption & Replacement Rate Assumptions
- Appendix F – ASP Reference Tables
- Appendix G – Manufacturing & Facility Database
- Appendix H – Import-Export Data Tables
- Appendix I – Regulatory Summary Tables
- Appendix J – Primary Research Participant List (Anonymized)
- Appendix K – Primary Research Questionnaire Framework
- Appendix L – Data Sources & Bibliography
- Appendix M – Market Size Divergence & Source Comparison
Chapter 17. Research Methodology
- 17.1 Research Framework & Philosophy
- 17.2 Secondary Research – Sources, Hierarchy & Data Extraction
- 17.3 Data Modeling – Bottom-Up & Top-Down Market Sizing
- 17.4 Primary Research – Stakeholder Framework, LOI & Sample Sizes
- 17.5 Forecast Methodology – Regression, Scenario & Sensitivity Analysis
- 17.6 Quality Control – Four-Layer Validation Framework
- 17.7 Limitations & Standard Assumptions
- 17.8 Disclaimer
