| REPORT ATTRIBUTE |
DETAILS |
| Historical Period |
2020-2023 |
| Base Year |
2024 |
| Forecast Period |
2025-2032 |
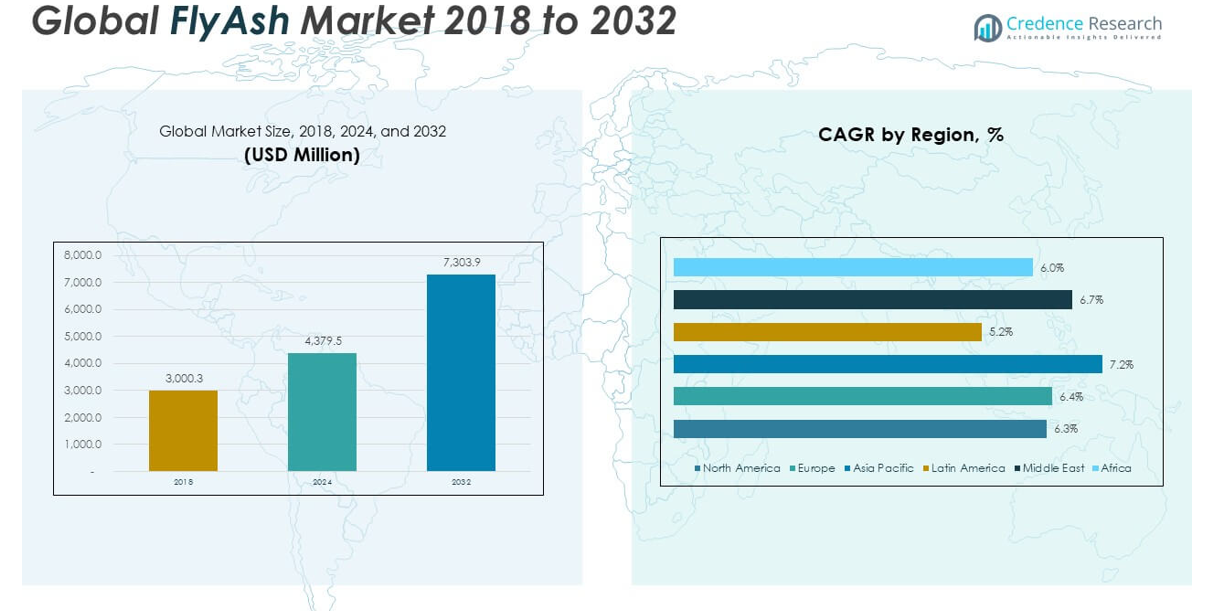
| Fly Ash Market Size 2024 |
USD 4,379.5 million |
| Fly Ash Market, CAGR |
6.63% |
| Fly Ash Market Size 2032 |
USD 7,303.9 million |
Market Overview:
The Fly Ash Market size was valued at USD 3,000.3 million in 2018 to USD 4,379.5 million in 2024 and is anticipated to reach USD 7,303.9 million by 2032, at a CAGR of 6.63% during the forecast period.
The fly ash market is primarily driven by the growing emphasis on sustainable construction practices and the increasing demand for eco-friendly building materials. Fly ash, being a by-product of coal combustion, is widely recognized as a sustainable substitute for Portland cement in concrete production. Its ability to enhance the strength, durability, and workability of concrete has led to its adoption across large-scale infrastructure projects. Moreover, rising environmental concerns have prompted governments and regulatory bodies to promote the use of industrial by-products to reduce landfill waste and carbon emissions. The construction industry’s shift toward low-carbon materials and circular economy models has further boosted fly ash utilization. In addition, advancements in beneficiation technologies that improve the quality and usability of fly ash are expanding its applications beyond construction, including agriculture, waste treatment, and road stabilization.
Regionally, the fly ash market exhibits strong performance in Asia Pacific, where infrastructure development and urban expansion are occurring at a rapid pace. The widespread construction of roads, bridges, housing, and industrial facilities across countries like China and India has created substantial demand for supplementary cementitious materials, including fly ash. Supportive government policies encouraging the reuse of industrial waste have further strengthened its regional market. In North America, regulatory measures aimed at reducing coal ash disposal and promoting sustainable construction are driving fly ash adoption, particularly in infrastructure renewal initiatives. Europe is also experiencing growth, supported by strict environmental regulations and the region’s commitment to circular economy principles. Meanwhile, markets in Latin America, the Middle East, and Africa are gradually recognizing the value of fly ash in reducing construction costs and enhancing material efficiency.
Market Insights:
- The Fly Ash Market is projected to grow from USD 4,379.5 million in 2024 to USD 7,303.9 million by 2032, driven by a strong CAGR of 6.63% and rising global demand for sustainable construction materials.
- Increased focus on green building and infrastructure standards is accelerating the replacement of traditional cement with fly ash to reduce environmental impact and improve material performance.
- Regulatory frameworks in key markets are supporting fly ash utilization by promoting industrial by-product reuse and reducing landfill dependency, especially in cement and concrete production.
- Infrastructure investments across emerging economies are creating stable demand, with fly ash being widely used in roads, bridges, and affordable housing projects due to its cost efficiency and strength-enhancing properties.
- Technological advancements in beneficiation processes are expanding fly ash applications beyond construction, including road base stabilization, agriculture, and waste remediation.
- Market growth faces challenges due to reduced coal-fired power generation, impacting fly ash availability and forcing producers to adopt landfill harvesting and alternative sourcing strategies.
- Asia Pacific leads the global market, supported by urbanization and government mandates, while North America and Europe continue to adopt fly ash for infrastructure renewal and circular economy goals.
Access crucial information at unmatched prices!
Request your sample report today & start making informed decisions powered by Credence Research Inc.!
Download Sample
Market Drivers:
Rising Adoption of Sustainable Construction Materials Enhances Market Demand
The construction industry continues to prioritize sustainable materials to reduce environmental impact and improve long-term structural performance. Fly ash, a by-product of coal combustion, is gaining traction due to its ability to partially replace Portland cement in concrete. It contributes to reduced greenhouse gas emissions and enhances durability, compressive strength, and resistance to chemical attack. Many infrastructure projects in both public and private sectors now mandate or prefer the use of supplementary cementitious materials. The Fly Ash Market benefits directly from these mandates, particularly in large-scale civil engineering projects. It meets the performance standards of green building certifications, further driving demand across global construction sectors.
- For instance, Eco Material Technologies (formerly Boral Resources) commissioned a $40 million STAR® beneficiation facility at the Plant McDonough-Atkinson site in Georgia, USA. According to the company’s press release, the plant processes up to 400,000 tons of ponded ash annually, removing carbon and other impurities to produce premium-grade fly ash.
Regulatory Support for Industrial Waste Reuse Reinforces Market Growth
Government regulations and environmental policies play a central role in promoting the reuse of industrial by-products. Regulatory frameworks across regions encourage thermal power plants and construction firms to divert fly ash from landfills and incorporate it into commercial products. This shift reduces environmental hazards while promoting resource efficiency in infrastructure development. Policy incentives, such as tax benefits and usage mandates, are creating structured demand for fly ash in cement, concrete, and bricks. The Fly Ash Market is responding to these regulatory pressures with increased utilization rates, particularly in countries focusing on zero-waste goals. It supports national and international climate objectives by aligning industrial practices with circular economy models.
- For instance, in India, the Ministry of Environment, Forest and Climate Change (MoEFCC) mandated in 2021 that all coal- and lignite-based thermal power plants must achieve 100% fly ash utilization. NTPC Limited, India’s largest power utility, reported in its 2023 annual report that it achieved 103% fly ash utilization(i.e., more fly ash was used than generated) by supplying 45 million tonnes of fly ash to cement, bricks, and infrastructure sectors.
Increasing Infrastructure Development in Emerging Economies Fuels Consumption
Emerging economies continue to invest heavily in transportation, housing, and energy infrastructure, creating consistent demand for construction-grade materials. Fly ash serves as a cost-effective alternative in such projects due to its availability and performance-enhancing characteristics. Governments and private developers are incorporating it into concrete mixes to improve sustainability and lower overall material costs. In regions where coal-fired power plants are still operational, local sourcing of fly ash ensures supply chain efficiency and pricing advantages. The Fly Ash Market benefits from this synergy between industrial output and infrastructure demand. It continues to grow in tandem with national infrastructure plans and economic development initiatives.
Technological Advancements Expand Application Scope and Quality Standards
Technological improvements in fly ash processing are transforming its usability across various industrial applications. Innovations in beneficiation techniques are helping eliminate contaminants and improve consistency, making fly ash suitable for high-performance concrete and specialty products. Equipment upgrades allow producers to recover and classify ash from landfills and ash ponds, increasing overall supply. The Fly Ash Market is leveraging these advancements to diversify its end-use segments, including road base stabilization, waste remediation, and agriculture. Enhanced product quality enables its use in markets where only premium-grade materials meet regulatory standards. It helps manufacturers meet evolving construction specifications without compromising structural integrity.
Market Trends:
Growing Emphasis on Low-Carbon Cement and Concrete Solutions
Construction sectors worldwide are shifting focus toward low-carbon alternatives to traditional cement. Fly ash has emerged as a preferred material due to its ability to lower carbon dioxide emissions in concrete production. It provides enhanced workability, long-term strength, and resistance to thermal cracking, aligning with sustainability goals. Builders and developers are integrating it into green building practices to meet evolving regulatory and consumer expectations. Governments are encouraging the use of blended cements that incorporate fly ash to meet climate action targets. The Fly Ash Market reflects this shift in priorities, supporting the demand for environmentally responsible building materials.
- For instance, Bharat Aluminium Company Limited (BALCO) and UltraTech Cement initiated a supply agreement for 75,000 metric tonnes of fly ash, directly supporting the production of low-carbon cement and advancing circular economy goals.
Expansion of Beneficiation and Ash Harvesting Technologies
Technological progress is redefining how fly ash is collected, processed, and repurposed. Advanced beneficiation systems improve the consistency and quality of fly ash by removing contaminants such as unburned carbon and heavy metals. Companies are deploying ash harvesting technologies to recover material from storage ponds and landfills, which expands the usable supply base. These technologies support sustainability by repurposing legacy waste and minimizing environmental liability. The Fly Ash Market is experiencing transformation as producers adopt automated systems to enhance output and meet strict quality standards. It benefits from a broader range of applications made possible through refined processing.
- For instance, Heidelberg Materials North America’s Winyah STAR® Plant, the world’s first commercial-scale facility to process harvested ash, has processed 2.4 million tons of reclaimed material since 2015, supplying 4.5 million tons of high-quality fly ash to the concrete industry.
Rising Utilization Across Non-Construction Applications
Demand for fly ash is growing in industries beyond construction due to its chemical and structural properties. It is used in soil stabilization, waste treatment, road embankments, and mine reclamation projects. Engineers value its pozzolanic and binding characteristics, which contribute to cost efficiency and performance improvements in diverse environments. Research institutions and industry players are working together to test and validate new uses for fly ash across sectors. The Fly Ash Market is expanding as awareness grows about its versatility and industrial potential. It supports environmental goals while offering performance benefits across multiple applications.
Industry Collaboration and Circular Economy Alignment
Collaboration among cement producers, utility companies, and technology firms is driving integrated supply chains for fly ash. Joint ventures and strategic partnerships are addressing logistical challenges and standardization issues across regions. These alliances are also improving the traceability and reliability of fly ash sources, supporting large-scale adoption. The Fly Ash Market aligns well with circular economy principles by promoting resource reuse and reducing reliance on virgin raw materials. It strengthens its position in global markets through collaborative innovation and sustainability-driven strategies. Stakeholders recognize fly ash as both a resource and a solution within broader environmental frameworks.
Market Challenges Analysis:
Supply Constraints Due to Shift Away from Coal-Based Power Generation
The global transition toward renewable energy is reducing coal-fired power generation, which directly impacts the availability of fly ash. Thermal power plants are the primary source of fly ash, and their declining numbers are causing fluctuations in supply. In regions where coal use is diminishing rapidly, construction and infrastructure sectors face uncertainty in securing consistent fly ash volumes. This poses a risk to long-term planning and project timelines. The Fly Ash Market must adapt to these structural shifts by exploring alternative sourcing methods such as landfill harvesting and importing from coal-reliant regions. It depends on innovation and cross-industry collaboration to ensure stability in raw material availability.
Quality Variability and Lack of Standardization Hinder Broader Adoption
Fly ash quality often varies based on the type of coal burned and the combustion process used, leading to inconsistency in product performance. Manufacturers and end-users frequently encounter challenges related to variable chemical composition, fineness, and loss on ignition. This lack of uniformity makes it difficult to meet the stringent requirements of high-performance construction applications. Standards for fly ash usage differ across countries and regions, adding complexity to international trade and usage in global infrastructure projects. The Fly Ash Market faces obstacles in expanding its footprint without harmonized quality protocols and robust certification frameworks. It requires tighter quality controls and improved beneficiation techniques to gain wider acceptance across critical industries.
Market Opportunities:
Emerging Applications in Agriculture and Waste Management Open New Avenues
Fly ash holds untapped potential in sectors beyond construction, particularly in agriculture and waste management. Its mineral composition supports soil conditioning and pH regulation, offering value in land reclamation and crop productivity. Researchers and environmental agencies are exploring its role in heavy metal immobilization and leachate control in landfills. These applications create new revenue streams while contributing to environmental sustainability goals. The Fly Ash Market can leverage these uses to diversify its end-user base and reduce dependency on the construction sector. It positions itself as a multifunctional material with broad industrial relevance.
Infrastructure Expansion in Developing Regions Drives Future Demand
Many developing countries are investing heavily in roads, railways, housing, and industrial zones, which increases demand for high-performance and cost-effective building materials. Fly ash offers a scalable and sustainable solution for such infrastructure growth, especially in regions with existing coal power generation. Government initiatives promoting sustainable urbanization and low-carbon construction further support its adoption. The Fly Ash Market stands to benefit from this momentum by strengthening supply chains and engaging with local stakeholders. It holds strong potential to meet the performance and sustainability requirements of fast-growing economies.
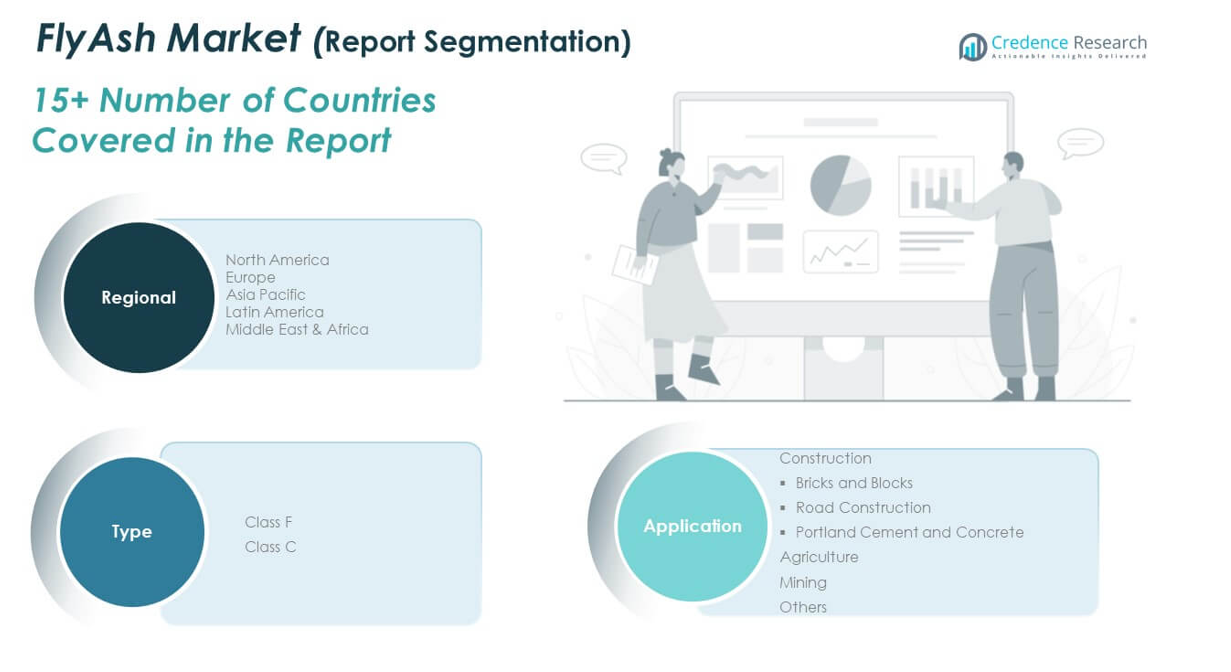
Market Segmentation Analysis:
The Fly Ash Market is segmented
By type into Class F and Class C, each offering distinct chemical and physical properties suitable for different applications. Class F fly ash, derived from burning anthracite or bituminous coal, contains high silica content and is preferred for its pozzolanic properties in structural concrete. Class C fly ash, sourced from lignite or sub-bituminous coal, has both pozzolanic and self-cementing characteristics, making it ideal for stabilizing soils and enhancing early strength in concrete mixes. This segmentation allows end-users to select materials tailored to specific engineering requirements.
- For example, Headwaters Resources, now part of Eco Material Technologies, produces Class C fly ash from sub-bituminous coal at the Jeffrey Energy Center in Kansas.
By application, the market is led by the construction segment, which includes bricks and blocks, road construction, and Portland cement and concrete. Fly ash enhances the strength, workability, and durability of construction materials, reducing reliance on traditional cement. Agriculture represents a growing application area where fly ash is used to improve soil texture and nutrient availability. In mining, it supports land reclamation and waste stabilization. Other applications include waste treatment and embankment fill, reflecting the material’s expanding utility across industries. The Fly Ash Market benefits from this diversified application scope, reinforcing its position as a versatile industrial material.
- For instance, NTPC Limitedin India operates fly ash brick plants at its Dadri and Rihand sites, producing over 30 million bricks annually. These bricks meet IS 12894 standards and are used in government and private construction projects.
Segmentation:
By Type:
By Application:
- Construction
- Bricks and Blocks
- Road Construction
- Portland Cement and Concrete
- Agriculture
- Mining
- Others
By Region :
- North America
- Europe
- Germany
- France
- U.K.
- Italy
- Spain
- Rest of Europe
- Asia Pacific
- China
- Japan
- India
- South Korea
- South-east Asia
- Rest of Asia Pacific
- Latin America
- Brazil
- Argentina
- Rest of Latin America
- Middle East & Africa
- GCC Countries
- South Africa
- Rest of the Middle East and Africa
Regional Analysis:
North America
The North America Fly Ash Market size was valued at USD 621.66 million in 2018 to USD 889.80 million in 2024 and is anticipated to reach USD 1,444.72 million by 2032, at a CAGR of 6.3% during the forecast period. North America accounts for a market share of approximately 12% and benefits from infrastructure renovation projects and growing regulatory support for sustainable building practices. The U.S. leads regional demand, driven by ongoing investments in highway and bridge repairs, where fly ash-based concrete improves durability and performance. Federal environmental regulations encourage the beneficial reuse of coal combustion by-products, supporting market growth. Industry players are also adopting ash harvesting from landfills to maintain supply as coal-fired power generation declines. The Fly Ash Market in North America continues to evolve with innovations in processing technologies and increased demand for low-carbon materials. It remains strategically important for both environmental compliance and construction quality improvement.
Europe
The Europe Fly Ash Market size was valued at USD 686.76 million in 2018 to USD 987.65 million in 2024 and is anticipated to reach USD 1,614.17 million by 2032, at a CAGR of 6.4% during the forecast period. Europe holds around 13% share of the global fly ash market, supported by stringent environmental regulations and active promotion of circular economy practices. The construction industry is increasingly adopting blended cement and concrete mixtures that incorporate fly ash to meet carbon reduction targets. Countries like Germany, the UK, and France are at the forefront of integrating industrial waste into mainstream infrastructure. The EU’s waste directives incentivize fly ash utilization, helping minimize landfill volumes and enhance resource efficiency. The Fly Ash Market in Europe is also supported by research and development initiatives aimed at expanding application scope. It continues to build momentum as the region accelerates its transition toward sustainable infrastructure.
Asia Pacific
The Asia Pacific Fly Ash Market size was valued at USD 1,110.10 million in 2018 to USD 1,676.74 million in 2024 and is anticipated to reach USD 2,921.57 million by 2032, at a CAGR of 7.2% during the forecast period. Asia Pacific dominates the global fly ash market with a share exceeding 45%, driven by massive infrastructure development and coal-based energy production. China and India are the largest contributors, accounting for a significant portion of regional consumption in cement, roads, and urban housing projects. Government mandates requiring fly ash utilization in construction support strong market expansion. Abundant availability of raw material from thermal power plants ensures supply stability. The Fly Ash Market in Asia Pacific continues to gain traction as developers prioritize cost-effective and eco-friendly alternatives to traditional cement. It remains a key region for long-term market growth, bolstered by public and private investment in infrastructure.
Latin America
The Latin America Fly Ash Market size was valued at USD 180.02 million in 2018 to USD 244.00 million in 2024 and is anticipated to reach USD 365.20 million by 2032, at a CAGR of 5.2% during the forecast period. Latin America accounts for roughly 3% of the global fly ash market, with steady growth observed in countries such as Brazil, Mexico, and Argentina. Infrastructure development plans and increased demand for affordable housing create opportunities for fly ash adoption in concrete production. Regional governments are slowly integrating sustainability guidelines that promote the use of industrial by-products in construction. However, supply limitations and inconsistent quality remain challenges. The Fly Ash Market in Latin America can expand through improved processing capabilities and public awareness initiatives. It holds moderate potential as urbanization and construction needs continue to rise.
Middle East
The Middle East Fly Ash Market size was valued at USD 256.82 million in 2018 to USD 376.39 million in 2024 and is anticipated to reach USD 631.06 million by 2032, at a CAGR of 6.7% during the forecast period. The Middle East represents nearly 5% of the global fly ash market, supported by ongoing infrastructure investments and sustainability initiatives. Major construction projects in the UAE, Saudi Arabia, and Qatar utilize fly ash to meet durability and performance benchmarks in hot climates. Government policies encouraging the circular use of materials are fostering a gradual increase in fly ash adoption. Supply chains depend heavily on imports or captive coal plants, limiting widespread usage. The Fly Ash Market in the Middle East is growing steadily as regional stakeholders align with global green building trends. It stands to benefit from enhanced supply chain integration and local processing capabilities.
Africa
The Africa Fly Ash Market size was valued at USD 144.91 million in 2018 to USD 204.96 million in 2024 and is anticipated to reach USD 327.22 million by 2032, at a CAGR of 6.0% during the forecast period. Africa holds a modest 2% share of the global fly ash market but presents untapped potential in construction and infrastructure sectors. South Africa leads regional adoption, supported by coal-fired power generation and increasing demand for cement substitutes. Other countries are gradually recognizing fly ash as a cost-effective material for road, bridge, and housing projects. Limited awareness and regulatory frameworks pose barriers to rapid adoption. The Fly Ash Market in Africa requires investment in processing technologies and capacity building to scale usage. It offers long-term opportunities as governments focus on sustainable urban development and industrial growth.
Shape Your Report to Specific Countries or Regions & Enjoy 30% Off!
Key Player Analysis:
- Boral Limited
- Charah Solutions
- CEMEX S.A.B. de C.V.
- Lafarge North America Inc.
- FlyAshDirect
- Separation Technologies LLC
- Ashtech (India) Pvt. Ltd.
- Cement Australia
- Milbank Ltd., UK
- Salt River Materials Group
Competitive Analysis:
The Fly Ash Market features a competitive landscape shaped by both global players and regional suppliers focused on quality enhancement, supply chain efficiency, and strategic expansion. Major companies such as Boral Limited, CEMEX S.A.B. de C.V., LafargeHolcim, and Charah Solutions lead the market through technological innovation and large-scale distribution networks. These firms invest in beneficiation technologies to improve product consistency and meet evolving regulatory standards. Regional producers maintain strong market positions by capitalizing on proximity to coal-fired power plants and meeting localized demand. The Fly Ash Market is witnessing increased consolidation through acquisitions and joint ventures, aimed at securing raw material access and expanding geographic presence. It continues to evolve with growing emphasis on sustainability, diversified end-use applications, and cross-sector collaboration. Competitive advantage hinges on operational flexibility, environmental compliance, and the ability to meet the material specifications of infrastructure and construction sectors worldwide.
Recent Developments:
- In January 2025, Heidelberg Materials North America completed the rebranding of its subsidiary SEFA, a leader in coal ash beneficiation technologies. SEFA, which Heidelberg acquired in May 2023, will now operate under the Heidelberg Materials name. The move strengthens the company’s ability to process ponded coal ash into recycled fly ash for concrete, reinforcing its position in the circular economy.
- In March 2025, Boral Limited secured a $24.5 million Federal grant to advance its kiln feed optimization project aimed at reducing carbon emissions in cement production. This project will increase the use of alternative raw materials, including fly ash, in kiln feed from 9% to 23%, thereby lowering CO2 emissions and energy intensity. Boral plans to utilize fly ash derived from industrial by-products such as steel manufacturing waste and recycled concrete aggregates.
- In March 2024, Holcim North America introduced its ECOAsh, a low-carbon beneficiated fly ash product, within its western Canadian Lafarge operations. ECOAsh is reclaimed from landfills and processed to deliver consistent, high-quality Type F fly ash for cement and concrete applications.
Market Concentration & Characteristics:
The Fly Ash Market exhibits moderate concentration, with a mix of multinational corporations and regional producers operating across key geographies. It is characterized by fragmented supply chains influenced by proximity to coal-fired power plants, regulatory frameworks, and regional infrastructure needs. The market relies heavily on consistent quality and logistical efficiency, which vary by source and processing capability. Leading players focus on technological advancements in ash beneficiation and landfill harvesting to ensure supply continuity and product standardization. The Fly Ash Market is also defined by its responsiveness to environmental policies and construction trends, making adaptability a critical factor for sustained growth. It maintains diverse applications across construction, agriculture, and waste management, supported by growing demand for sustainable materials.
Report Coverage:
The research report offers an in-depth analysis based on type and application. It details leading market players, providing an overview of their business, product offerings, investments, revenue streams, and key applications. Additionally, the report includes insights into the competitive environment, SWOT analysis, current market trends, as well as the primary drivers and constraints. Furthermore, it discusses various factors that have driven market expansion in recent years. The report also explores market dynamics, regulatory scenarios, and technological advancements that are shaping the industry. It assesses the impact of external factors and global economic changes on market growth. Lastly, it provides strategic recommendations for new entrants and established companies to navigate the complexities of the market.
Future Outlook:
- Expansion of green building initiatives will increase demand for fly ash-based concrete solutions.
- Governments are expected to strengthen regulations promoting industrial waste reuse.
- Advancements in beneficiation technologies will improve fly ash quality and broaden application scope.
- Declining coal power generation may shift supply strategies toward ash harvesting and imports.
- Infrastructure growth in emerging economies will remain a key market driver.
- Partnerships between utilities and construction firms will enhance supply chain integration.
- Growth in alternative applications such as agriculture and mine reclamation will diversify revenue streams.
- Circular economy models will continue to support sustainable material adoption.
- Investment in R&D will lead to the development of high-performance fly ash composites.
- Market players will pursue mergers and acquisitions to secure raw material access and expand regional presence.


