Market Overvier
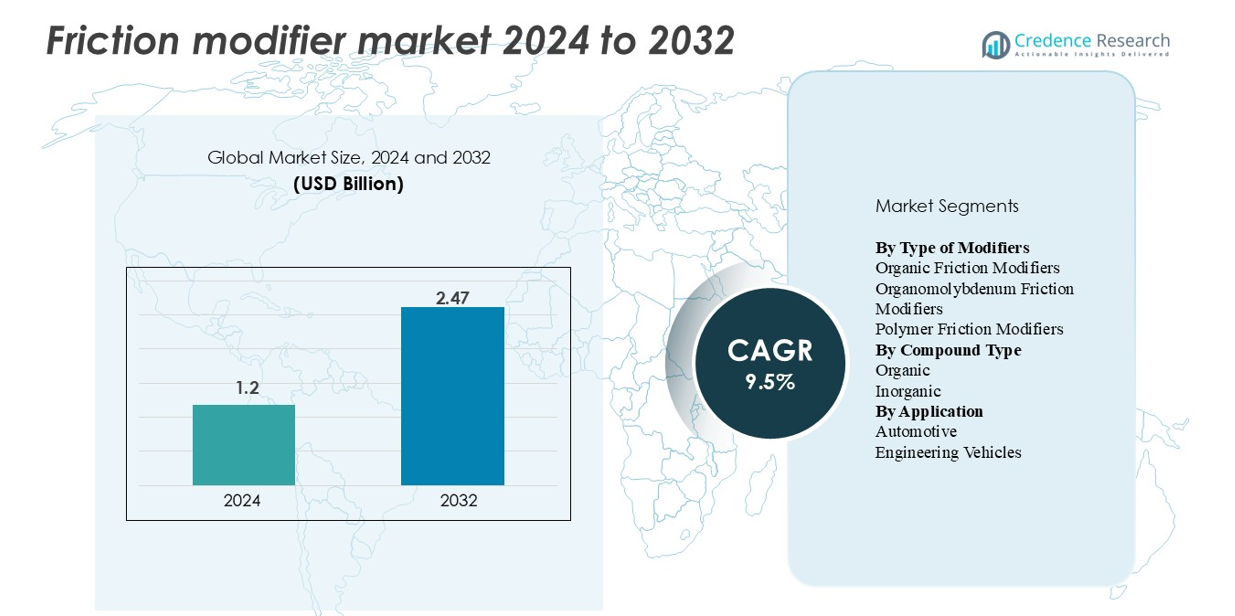
“The global friction modifier market was valued at USD 1.2 billion in 2024 and is projected to reach USD 2.47 billion by 2032, expanding at a CAGR of 9.5% during the forecast period.”
| REPORT ATTRIBUTE |
DETAILS |
| Historical Period |
2020-2023 |
| Base Year |
2024 |
| Forecast Period |
2025-2032 |
| Friction Modifier Market Size 2024 |
USD 1.2 billion |
| Friction Modifier Market, CAGR |
9.5% |
| Friction Modifier Market Size 2032 |
USD 2.47 billion |
The friction modifier market is shaped by leading additive manufacturers such as Afton Chemical, Lubrizol Corporation, Infineum, Chevron Oronite, BASF, and LANXESS, each leveraging advanced organic, polymeric, and molybdenum-based technologies to support high-performance lubricant formulations. These companies maintain strong OEM partnerships and continuous R&D investments, enabling them to supply friction modifiers tailored for automotive, industrial, and EV-specific applications. Asia–Pacific leads the global market with 34% share, supported by large-scale automotive production and rapid industrialization, followed by North America at 32%, driven by stringent efficiency regulations and strong demand for synthetic lubricants.
Market Insights
- The global friction modifier market was valued at USD 1.2 billion in 2024 and is projected to reach USD 2.47 billion by 2032, registering a CAGR of 9.5% over the forecast period.
- Strong market growth is driven by rising demand for high-performance lubricants in automotive, industrial, and EV applications, with organic friction modifiers holding the largest segment share due to broad compatibility and regulatory acceptance.
- Key trends include increasing adoption of EV-specific additive chemistries, expansion of bio-based friction modifiers, and growing use of polymer-based modifiers for ultra-low-viscosity lubricants.
- The competitive landscape is led by Afton Chemical, Lubrizol, Infineum, Chevron Oronite, BASF, and LANXESS, all focusing on advanced additive packages and OEM-approved formulations.
- Asia–Pacific leads the global market with 34% share, followed by North America at 32% and Europe at 27%, driven by automotive output, industrial activity, and evolving emission regulationTop of Form
Access crucial information at unmatched prices!
Request your sample report today & start making informed decisions powered by Credence Research Inc.!
Download Sample
Market Segmentation Analysis:
By Type of Modifiers
Organic friction modifiers dominate this segment, accounting for approximately 45% of the market due to their strong compatibility with diverse base oils and their ability to deliver stable lubricity at varying temperatures. Their widespread use in passenger cars and commercial vehicles strengthens their lead, supported by expanding OEM specifications favoring bio-based and ash-free formulations. Organomolybdenum modifiers continue gaining traction in high-performance engines, while polymer friction modifiers see increased adoption in EV transmission fluids as demand grows for thermally resilient and low-conductivity formulations.
- For instance, Afton Chemical Corporation developed a polymer-based friction modifier package which reduced gear train micro-pitting incidents from 12 per 10⁶ cycles to 3 per 10⁶ cycles in e-axle testing at 150 °C in a lab simulation.
By Compound Type
The organic compound category leads with nearly 60% market share, driven by its versatility, biodegradability, and ability to enhance boundary lubrication across a wide range of engine oils and industrial lubricants. Organic compounds benefit from stronger regulatory acceptance as industries reduce reliance on metallic or sulfur-containing additives. Inorganic compounds remain essential in heavy-duty and high-load applications, yet their growth is comparatively slower due to shifting OEM preferences toward cleaner formulations and evolving environmental regulations, which continue to favor advanced organic chemistries.
- For instance, Croda International’s Priolube™ 3970 ester-based organic friction modifier demonstrated a friction coefficient drop from 0.14 to 0.09 in MTM (Mini-Traction Machine) testing at 100 °C using a Group III base oil, while also achieving a wear scar diameter of 0.42 mm in a standard ASTM D4172 four-ball wear test.
By Application
The automotive segment accounts for roughly 70% of total demand, making it the dominant application area for friction modifiers. Growth is propelled by rising production of passenger cars, increasing penetration of synthetic lubricants, and stringent fuel-efficiency standards that require optimized boundary lubrication. Electric and hybrid vehicles further reinforce this dominance as OEMs incorporate specialized friction modifiers to improve e-axle efficiency and thermal performance. Engineering vehicles maintain steady adoption, particularly in construction and mining equipment, where high-load conditions necessitate robust friction-reducing additives.
Key Growth Drivers
Rising Demand for High-Performance Lubricants in Automotive and EV Powertrains
The growing complexity of modern powertrains significantly increases the need for high-performance friction modifiers. Automakers continue to optimize engines for higher fuel efficiency, lower emissions, and extended drain intervals, all of which demand additives capable of maintaining strong boundary lubrication under high stress. The rapid expansion of hybrid and electric vehicles further accelerates this demand, as e-axles, reduction gears, and high-speed bearings require friction modifiers that withstand elevated rotational speeds and thermal gradients. These systems operate under unique lubrication challenges—including electrical conductivity concerns, copper compatibility, and long-duration thermal loads—creating opportunities for advanced organic and polymer-based modifiers. OEMs increasingly integrate additive-specific formulations in factory-fill oils, strengthening long-term usage across global vehicle fleets. Additionally, stricter global fuel economy regulations encourage lubricant manufacturers to adopt friction-reducing agents that directly improve mechanical efficiency. Together, these factors strongly reinforce the long-term expansion of friction modifiers across automotive applications.
- For instance, Afton Chemical Corporation’s HiTEC® 343 gear-oil additive package has a kinematic viscosity at 100 °C of 9.0 mm²/s (density at 15 °C of 1.080 g/ml) according to its product datasheet. The final gear oil, once blended with a base oil, is formulated to specific viscosity grades that ensure robust thick-film (hydrodynamic) lubrication under typical operating conditions.
Growth of Industrial Machinery and Heavy-Duty Equipment Requiring Enhanced Wear Protection
Industrial sectors—including mining, construction, manufacturing, and agriculture—are intensifying their adoption of friction modifiers as machinery is pushed to operate under higher loads, harsher environments, and extended duty cycles. Heavy-duty equipment such as excavators, loaders, and hydraulic systems demand lubricants capable of minimizing metal-to-metal contact in extreme pressure zones. As downtime becomes increasingly costly for industrial operators, lubricant suppliers integrate friction modifiers into oils and greases to improve operational reliability and extend component life. The rise of automated and high-speed production machinery also amplifies the need for additives that reduce coefficient of friction while maintaining oxidative and thermal stability. In parallel, the global shift toward energy-efficient industrial operations drives factories to adopt low-friction formulations that reduce power consumption in rotating equipment. These combined operational, economic, and regulatory pressures make friction modifiers essential for maintaining efficiency and minimizing wear in modern industrial systems.
- For instance, ExxonMobil’s Mobilgrease XHP 222, formulated with proprietary friction-reducing compounds, achieved a weld load of 315 kgf and a load wear index of 50 kgf during ASTM D2596 EP testing, demonstrating suitability for extreme-pressure mining and construction applications.
Regulatory Push Toward Low-Emission and Fuel-Efficient Formulations
Environmental regulations play a decisive role in accelerating demand for friction modifiers. Global policies such as Euro 6/7, CAFE norms, and Asia’s tightening fuel efficiency regulations require OEMs and lubricant blenders to maximize engine efficiency without compromising durability. Friction modifiers reduce parasitic losses in engines and drivetrains, translating directly into lower fuel consumption and CO₂ emissions. Regulatory restrictions on sulfur, phosphorus, and metallic additives further benefit organic friction modifiers, which provide effective lubrication with lower environmental impact. Markets in North America, Europe, and parts of Asia increasingly mandate cleaner lubricant chemistries, prompting manufacturers to redesign additive packages with eco-friendly friction-reducing agents. This shift aligns with OEM initiatives to improve lubricant compatibility with modern after-treatment systems such as particulate filters and catalytic converters. As sustainability targets intensify across industries, friction modifiers become a critical tool for meeting regulatory and corporate environmental benchmarks.
Key Trends & Opportunities
Increasing Adoption of EV-Specific Friction Modifier Chemistries
The transition toward electrified mobility presents a major opportunity for friction modifier suppliers. Electric drivetrains generate unique lubrication challenges—including higher motor speeds, copper solubility issues, and thermal stress from integrated e-motor systems—requiring specially engineered friction modifiers. Unlike combustion engines, EV gearboxes experience continuous operation without combustion cycles, increasing the importance of low-viscosity fluids with optimized friction characteristics. Lubricant companies are developing polymeric and ash-free organic modifiers that maintain friction stability across wide temperature ranges while protecting electrical components. Growth in hybrid vehicles further expands this opportunity, as these powertrains require fluids optimized for frequent switching between electric and mechanical operation. With global EV production rising, suppliers who commercialize EV-compatible friction modifiers stand to gain early competitive advantage.
- For instance, Lubrizol offers the EVOGEN™ e-drivetrain fluid platform, which includes technologies like EVOGEN 4006 that are specifically designed for electrified vehicles. These fluids are engineered to meet the unique challenges of EV systems, including providing excellent copper corrosion protection, enhancing electrical properties, ensuring thermal management (heat transfer), and maintaining gear durability.
Shift Toward Bio-Based and Environment-Friendly Additive Formulations
Sustainability initiatives across the lubricant industry are driving strong interest in bio-based and low-toxicity friction modifiers. Organic ester-based, fatty amine-based, and plant-derived friction modifiers are gaining acceptance due to their biodegradability and reduced environmental impact during disposal. Government procurement standards, industrial ESG commitments, and green manufacturing programs support this shift. Bio-based modifiers also enhance boundary lubrication and oxidation resistance, making them viable alternatives to older metallic or sulfur-containing additives. As large industrial users aim to reduce carbon footprints, demand for renewable-source friction modifiers continues to rise. Additive manufacturers investing in green chemistry platforms are positioned to benefit significantly from emerging regulatory and customer preferences.
- For instance, Croda International’s polymeric organic friction modifier product Perfad 3000 showed a friction coefficient reduction to ~0.02 under MTM test conditions at 135 °C and 1 GPa contact pressure, when used at a 0.5 % treat rate in a Group III + 8 % ester oil matrix.
Growing Use of Advanced Surface-Active Polymers for High-Efficiency Lubrication
Polymer-based friction modifiers are emerging as a key technology trend, particularly for applications requiring enhanced shear stability and extended drain intervals. These high molecular weight polymers form durable boundary layers that maintain low friction even under extreme mechanical loads. Industries such as automotive, aerospace, and heavy equipment adopt these additives to improve durability while supporting next-generation low-viscosity lubricants. The push toward ultra-low viscosity engine oils (e.g., 0W-8, 0W-12) further reinforces demand for polymer friction modifiers capable of delivering consistent lubrication in thinner oil films. This trend opens significant innovation opportunities for additive suppliers.
Key Challenges
Formulation Complexity and Compatibility Issues with Modern Lubricants
Developing friction modifiers that balance performance, oxidation stability, and compatibility with modern lubricant chemistries remains a significant challenge. Additives must harmonize with detergents, anti-wear agents, viscosity modifiers, and anti-oxidants without causing deposit formation, foam issues, or catalyst poisoning. This complexity intensifies in low-viscosity and high-temperature formulations used in advanced engines and EV drivetrains. Ensuring consistent performance across diverse base oils—mineral, synthetic, PAO, and esters—adds another layer of difficulty. OEM lubricant specifications continue to tighten, requiring extensive testing, validation cycles, and certification costs, which can slow product deployment and increase development risks.
Regulatory Restrictions on Metallic and Environmentally Sensitive Additives
Increasing global scrutiny on metallic and environmentally persistent compounds presents a notable challenge for friction modifier manufacturers, particularly those producing molybdenum- or phosphorus-based additives. Environmental regulations targeting reduced emissions, toxicity, and chemical persistence limit the use of many traditional friction modifier chemistries. Lubricant suppliers must redesign additive packages to avoid adverse interactions with emission-control systems, including catalytic converters and particulate filters. Compliance with REACH, GHS, and regional chemical safety regulations further increases production costs and constrains material choices. Transitioning to safer alternatives requires substantial R&D investment, making regulatory compliance a long-term challenge for the industry.
Regional Analysis
North America
North America holds approximately 32% of the global friction modifier market, driven by strong adoption of synthetic lubricants, advanced automotive manufacturing, and stringent fuel-efficiency regulations. The U.S. leads demand as OEMs integrate low-viscosity engine oils and EV-specific driveline fluids that require high-performance organic and polymer friction modifiers. Growth is further supported by the region’s large industrial machinery base, where manufacturers increasingly adopt energy-efficient lubricants to reduce operational costs. Rising EV production, coupled with expanding R&D in ash-free additive chemistries, reinforces the region’s position as an innovation hub.
Europe
Europe accounts for around 27% of global market share, supported by its aggressive regulatory environment and well-established automotive and industrial sectors. Strict emission standards, including Euro 6 and the upcoming Euro 7 framework, drive lubricant formulators to adopt advanced organic friction modifiers that align with low-SAPs and long-drain oil requirements. Germany, France, and the U.K. lead usage across passenger vehicles, commercial fleets, and heavy-duty equipment. The region’s rising EV penetration boosts demand for thermal-resilient friction modifiers optimized for e-axles and reduction gears. Sustainability initiatives also accelerate adoption of bio-based additive technologies.
Asia–Pacific
Asia–Pacific dominates the market with approximately 34% share, making it the largest regional contributor. Growth is fueled by massive automotive production in China, Japan, India, and South Korea, where OEMs increasingly adopt friction-modifier-enhanced lubricants to meet efficiency and durability standards. Rapid industrialization, especially in construction, mining, and manufacturing, further supports demand for high-performance industrial oils. Expanding hybrid and electric vehicle manufacturing in China and Japan accelerates the need for EV-compatible additive packages. The region’s diverse industrial base and rising focus on fuel economy collectively sustain strong long-term consumption.
Latin America
Latin America holds around 4% of market share, with demand concentrated in Brazil, Mexico, and Argentina. Growth is primarily driven by the region’s expanding automotive service sector and heavy reliance on commercial vehicles used in agriculture, logistics, and mining. Industrial machinery, especially in mining operations across Chile and Peru, contributes significantly to the adoption of friction-reducing additives in heavy-duty lubricants. Although regulatory standards are less stringent compared to North America and Europe, rising emphasis on operational efficiency and engine durability is increasing the use of high-quality organic and inorganic friction modifiers.
Middle East & Africa
The Middle East & Africa region accounts for approximately 3% of the global market, shaped by strong demand from industrial, mining, and oil & gas sectors. Countries such as the UAE, Saudi Arabia, and South Africa rely heavily on high-performance lubricants for construction machinery, drilling equipment, and power generation systems, driving steady adoption of friction modifiers. Automotive growth remains moderate but improving, particularly as regional fleets expand and maintenance standards rise. The shift toward efficient machinery operation and reduced downtime continues to support gradual market expansion for advanced lubricant additives.
Market Segmentations:
By Type of Modifiers
- Organic Friction Modifiers
- Organomolybdenum Friction Modifiers
- Polymer Friction Modifiers
By Compound Type
By Application
- Automotive
- Engineering Vehicles
By Geography
- North America
- Europe
- Germany
- France
- U.K.
- Italy
- Spain
- Rest of Europe
- Asia Pacific
- China
- Japan
- India
- South Korea
- South-east Asia
- Rest of Asia Pacific
- Latin America
- Brazil
- Argentina
- Rest of Latin America
- Middle East & Africa
- GCC Countries
- South Africa
- Rest of the Middle East and Africa
Competitive Landscape
The competitive landscape of the friction modifier market is defined by the presence of global additive leaders that continuously innovate to meet evolving lubricant performance requirements across automotive, industrial, and EV applications. Companies such as Afton Chemical, Lubrizol Corporation, Infineum, Chevron Oronite, BASF, and LANXESS dominate the market through extensive product portfolios, strong OEM collaborations, and advanced R&D capabilities. These players focus on developing organic, polymeric, and molybdenum-based friction modifiers engineered for low-viscosity oils, extended drain intervals, and enhanced thermal stability. Competition is further shaped by the accelerating shift toward EV driveline fluids and environmentally compliant formulations, prompting suppliers to invest in ash-free and bio-based chemistries. Regional players in Asia–Pacific and Europe increasingly expand their footprint by offering cost-effective and application-specific additive packages. Overall, the market remains moderately consolidated, with innovation speed, OEM approvals, and regulatory compliance serving as key competitive differentiators.
Shape Your Report to Specific Countries or Regions & Enjoy 30% Off!
Key Player Analysis
Recent Developments
- In 2025, BASF SE Marketing of its friction modifier product line, including the product IRGALUBE® FE1 (ashless friction modifier) and others (e.g., IRGALUBE® F10A, SYNATIVE® ester range) with fuel economy/CO₂ savings claims.
- In March 2024, Chevron Corporation Release of a product stewardship summary for friction modifiers by its subsidiary Chevron Oronite Company LLC.
Report Coverage
The research report offers an in-depth analysis based on Type of modifiers, compound type, Application and Geography. It details leading market players, providing an overview of their business, product offerings, investments, revenue streams, and key applications. Additionally, the report includes insights into the competitive environment, SWOT analysis, current market trends, as well as the primary drivers and constraints. Furthermore, it discusses various factors that have driven market expansion in recent years. The report also explores market dynamics, regulatory scenarios, and technological advancements that are shaping the industry. It assesses the impact of external factors and global economic changes on market growth. Lastly, it provides strategic recommendations for new entrants and established companies to navigate the complexities of the market.
Future Outlook
- The market will expand as OEMs adopt advanced friction modifiers to support low-viscosity and high-efficiency lubricants.
- EV growth will drive strong demand for specialized friction modifiers designed for e-axles and high-speed electric drivetrains.
- Organic and bio-based chemistries will gain prominence as sustainability regulations tighten globally.
- Polymer-based friction modifiers will see wider adoption due to their stability in ultra-low-viscosity oils.
- Industrial sectors will increasingly use friction modifiers to improve equipment efficiency and reduce operational downtime.
- Fuel economy standards will continue pushing lubricant formulators toward high-performance additive packages.
- Regional manufacturers in Asia will strengthen their position through cost-effective and application-specific solutions.
- R&D investments will rise for ash-free and environmentally compliant additive technologies.
- OEM-approved formulations will become a critical competitive advantage for global suppliers.
- Digital monitoring of lubricant performance will encourage development of smarter, condition-responsive additive systems.


