
Market Overview:
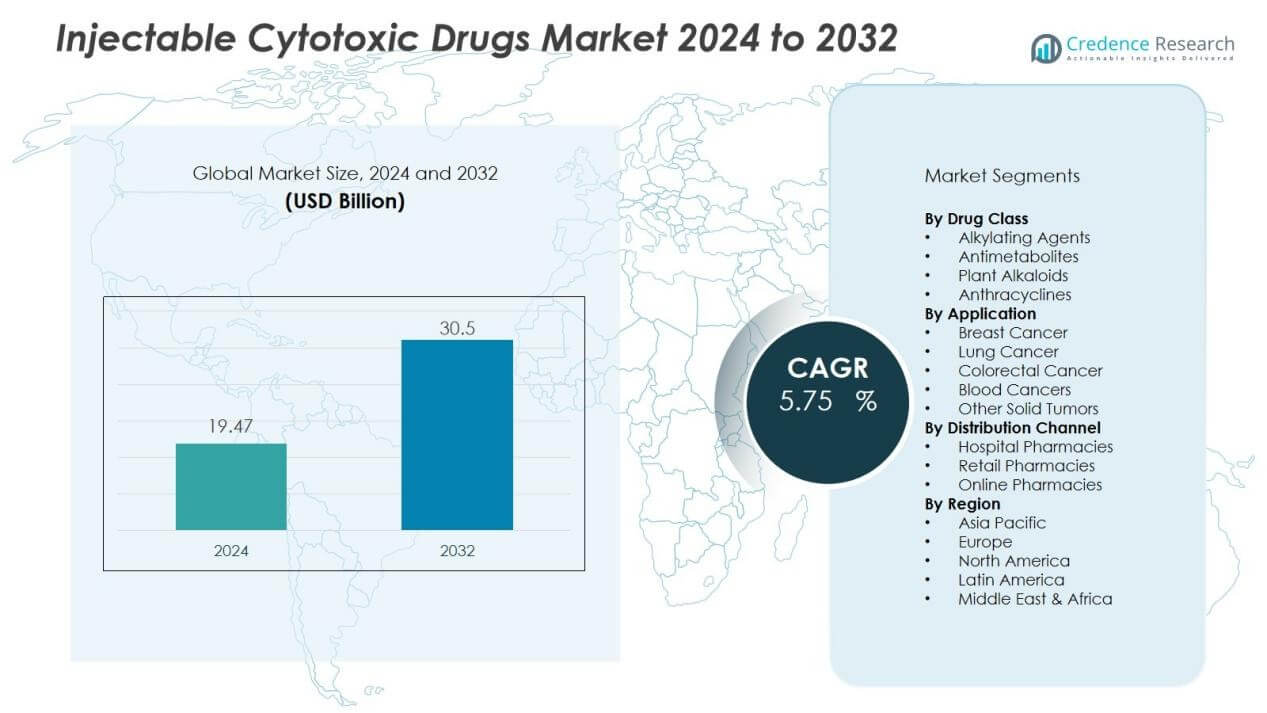
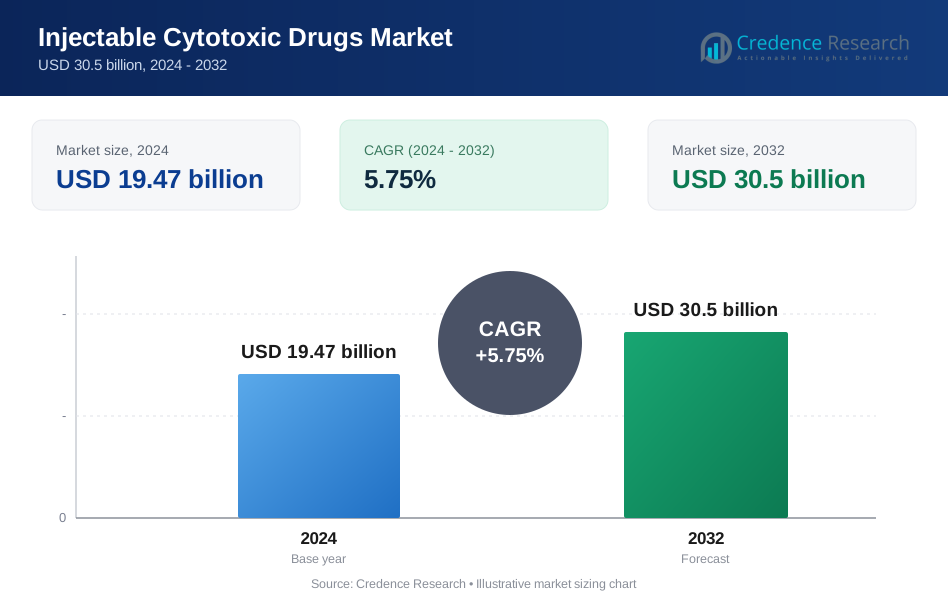
The injectable cytotoxic drugs market size was valued at USD 19.47 billion in 2024 and is anticipated to reach USD 30.5 billion by 2032, at a CAGR of 5.75 % during the forecast period (2024-2032).
| REPORT ATTRIBUTE | DETAILS |
|---|---|
| Historical Period | 2020-2023 |
| Base Year | 2024 |
| Forecast Period | 2025-2032 |
| Injectable Cytotoxic Drugs Market Size 2024 | USD 19.47 Billion |
| Injectable Cytotoxic Drugs Market, CAGR | 5.75% |
| Injectable Cytotoxic Drugs Market Size 2032 | USD 30.5 Million |
Key drivers include the rising prevalence of cancer worldwide, which sustains a strong need for chemotherapy drugs. Growing geriatric populations and lifestyle-related cancer incidence add to the demand. In addition, the increasing adoption of combination therapies where cytotoxic drugs are paired with newer treatments helps maintain relevance. The market also benefits from expanding healthcare access in low- and middle-income countries, where generic injectable cytotoxic drugs are widely used due to affordability.
Regionally, North America dominates the market, supported by advanced oncology infrastructure, high healthcare spending, and widespread access to branded therapies. Europe follows with strong pharmaceutical pipelines and government-led cancer care initiatives. Asia-Pacific is expected to record the fastest growth, driven by large patient populations, rising cancer screening rates, and the rapid expansion of healthcare infrastructure in countries such as China and India. Latin America and the Middle East & Africa provide emerging opportunities through improved cancer diagnosis and increasing government healthcare investments.
Market Insights:
- The injectable cytotoxic drugs market was valued at USD 19.47 billion in 2024 and will reach USD 30.5 billion by 2032.
- Rising cancer prevalence across breast, lung, colorectal, and blood cancers drives consistent chemotherapy demand.
- Growing geriatric populations and lifestyle-linked risk factors fuel the need for cytotoxic treatments.
- Combination therapies pairing cytotoxic drugs with targeted or immune-based treatments strengthen market relevance.
- Expanding healthcare infrastructure in Asia-Pacific, Latin America, and Africa supports higher adoption of affordable generics.
- North America held 38% share in 2024, followed by Europe with 29%, backed by advanced oncology systems.
- Asia-Pacific recorded 22% share and remains the fastest-growing region, while Latin America and the Middle East & Africa together accounted for 11% share.
Market Drivers:
Rising Global Cancer Burden:
The injectable cytotoxic drugs market is driven by the growing global cancer burden. Increasing incidence of breast, lung, colorectal, and blood cancers sustains high demand for chemotherapy treatments. It remains a core part of oncology care despite advances in targeted and immuno-oncology therapies. Growing patient pools across both developed and developing regions reinforce the need for these injectable drugs.
- For instance, Novartis replaced two 10 000 L batch reactors with a single 16 L plug flow reactor for continuous manufacturing of imatinib API, boosting overall yield by 50%.
Continued Relevance in Combination Therapies:
The use of cytotoxic drugs in combination with targeted therapies and immunotherapies supports market growth. Oncologists continue to prescribe them to enhance treatment efficacy and reduce resistance. It ensures their relevance in modern cancer care protocols despite new therapeutic options. The injectable cytotoxic drugs market benefits from their adaptability in multi-drug regimens.
- For instance, Roche’s IMpower130 trial showed that adding atezolizumab to carboplatin and nab-paclitaxel extended median overall survival by 4.7 months.
Expanding Healthcare Access in Developing Regions:
Expanding healthcare infrastructure in Asia-Pacific, Latin America, and Africa is a key growth driver. Governments and private players are improving cancer screening and treatment access in these regions. It drives strong uptake of generic injectable cytotoxic drugs due to their affordability and availability. Rising healthcare expenditure and insurance coverage further support market penetration.
Aging Population and Lifestyle Factors:
The rising geriatric population significantly contributes to higher cancer prevalence, fueling drug demand. Older adults are more vulnerable to cancer, making cytotoxic therapies vital in treatment protocols. It also reflects lifestyle-related factors such as smoking, obesity, and sedentary habits that elevate cancer risk. The injectable cytotoxic drugs market continues to expand with these demographic and lifestyle trends.
Market Trends:
Growing Focus on Combination and Multimodal Therapies:
The injectable cytotoxic drugs market is experiencing a shift toward combination and multimodal therapies. Oncologists are increasingly pairing cytotoxic drugs with targeted agents and immunotherapies to maximize treatment outcomes. It helps improve patient survival rates while reducing the chances of drug resistance. Pharmaceutical companies are investing in clinical trials that evaluate cytotoxic agents as part of broader oncology regimens. Hospitals and cancer centers continue to rely on these drugs due to their proven effectiveness in both adjuvant and neoadjuvant settings. The trend highlights the sustained relevance of cytotoxic drugs within modern oncology practices despite the introduction of advanced alternatives.
- For example, in a study of malignant pleural mesothelioma patients, median survival improved to 22.6 months for those receiving surgery, immunotherapy, and chemotherapy combined, compared to 11.7 months with chemotherapy alone.
Rising Demand for Generics and Biosimilars in Emerging Markets:
Demand for generic injectable cytotoxic drugs is expanding rapidly in cost-sensitive regions. Healthcare providers in Asia-Pacific, Latin America, and Africa prioritize affordable generics to increase access to cancer treatments. It creates opportunities for local and regional manufacturers to strengthen their supply chains. Governments are supporting this trend through price regulation and reimbursement programs that encourage widespread adoption. The market is also seeing interest in biosimilars that complement cytotoxic therapies in certain treatment plans. Growing competition among generic producers is shaping a more accessible oncology drug landscape. The injectable cytotoxic drugs market benefits from this transition, reinforcing its role in global cancer care.
- For instance, Sandoz launched the first FDA-approved generic paclitaxel protein-bound injectable suspension containing 100 mg in a single-dose vial in October 2024
Market Challenges Analysis:
High Toxicity and Adverse Effects:
The injectable cytotoxic drugs market faces significant challenges due to toxicity and severe side effects. Patients often experience nausea, immune suppression, hair loss, and fatigue, leading to reduced compliance. Oncologists sometimes limit or delay treatment cycles to protect patient safety, which affects outcomes. It raises concerns about long-term tolerability and quality of life for cancer patients. Pharmaceutical companies continue to explore formulations that may reduce toxicity without compromising efficacy. Despite these efforts, safety concerns remain a major barrier to broader acceptance.
Competition from Targeted and Immuno-Oncology Therapies:
The rise of targeted therapies and immuno-oncology treatments is reshaping the competitive landscape. These advanced options often provide higher precision with fewer side effects compared to cytotoxic drugs. It challenges the positioning of cytotoxic treatments in oncology protocols, especially in developed markets. Healthcare providers prefer modern therapies when affordability and access are not constraints. The injectable cytotoxic drugs market still retains demand in emerging economies, but long-term dominance faces uncertainty. Sustaining relevance will require strategic use in combination regimens and expanded access through affordable generics.
Market Opportunities:
Expansion of Generics and Affordable Therapies:
The injectable cytotoxic drugs market holds strong opportunities through the expansion of generics. Demand for affordable cancer treatments in emerging regions is rising as healthcare systems expand access. It creates space for regional manufacturers to scale production and meet patient needs. Governments support this trend with price control policies, insurance coverage, and procurement programs. Companies focusing on cost-effective supply chains and EN-certified products can secure long-term contracts. Wider adoption of generics ensures sustained relevance of cytotoxic drugs across global oncology care.
Integration in Combination and Adjunct Therapies:
Opportunities also exist in integrating cytotoxic drugs with targeted and immune-based treatments. Oncologists use these drugs to improve outcomes in combination protocols, supporting demand despite competition. It allows pharmaceutical firms to invest in trials that reposition older drugs within modern regimens. Hospitals value these therapies for their proven efficacy in both adjuvant and advanced stages. Expanding clinical applications ensure that injectable cytotoxic drugs remain essential in oncology practice. The injectable cytotoxic drugs market benefits from this adaptability, creating growth avenues in both developed and emerging economies.
Market Segmentation Analysis:
By Drug Class:
The injectable cytotoxic drugs market is segmented into alkylating agents, antimetabolites, plant alkaloids, and anthracyclines. Alkylating agents hold a significant share due to their broad use in multiple cancer types. Antimetabolites remain essential in treating blood cancers and solid tumors, supported by their proven efficacy. Plant alkaloids and anthracyclines continue to see demand, especially in combination regimens. It benefits from the established role of these drug classes in both first-line and second-line treatments.
By Application:
Applications include breast cancer, lung cancer, colorectal cancer, blood cancers, and other solid tumors. Breast and lung cancer dominate due to their high global prevalence and reliance on cytotoxic therapies. Colorectal cancer treatments also represent a strong application segment supported by global screening programs. Blood cancers such as leukemia and lymphoma sustain consistent demand for injectable cytotoxic drugs. It remains vital in oncology care, where newer therapies often serve as adjuncts rather than replacements.
- For instance, the introduction of the FOLFOX regimen (combined oxaliplatin and 5-FU/LV) in metastatic colorectal cancer increased overall survival times to approximately 21.5 months in trials, showcasing substantial improvement in patient outcomes through cytotoxic combinations
By Distribution Channel:
Distribution channels include hospital pharmacies, retail pharmacies, and online pharmacies. Hospital pharmacies account for the largest share, reflecting the hospital-based administration of injectable drugs. Retail pharmacies support outpatient access, particularly for maintenance treatments and follow-up cycles. Online pharmacies are emerging in developed and urban markets, offering convenience in procurement. It highlights the growing diversification of distribution methods to improve patient accessibility.
- For instance, Becton, Dickinson and Company’s BD Rowa™ Vmax automated dispensing systems have been installed at over 200 UK&I hospital sites and more than 13,000 sites across Europe, Middle East, and Africa, with a sample of ten new hospital installations achieving actual storage capacities ranging from 17,474 to 41,669 medication packs annually.
Segmentations:
By Drug Class:
- Alkylating Agents
- Antimetabolites
- Plant Alkaloids
- Anthracyclines
By Application:
- Breast Cancer
- Lung Cancer
- Colorectal Cancer
- Blood Cancers
- Other Solid Tumors
By Distribution Channel:
- Hospital Pharmacies
- Retail Pharmacies
- Online Pharmacies
By Region:
- North America
- U.S.
- Canada
- Mexico
- Europe
- UK
- France
- Germany
- Italy
- Spain
- Russia
- Belgium
- Netherlands
- Austria
- Sweden
- Poland
- Denmark
- Switzerland
- Rest of Europe
- Asia Pacific
- China
- Japan
- South Korea
- India
- Australia
- Thailand
- Indonesia
- Vietnam
- Malaysia
- Philippines
- Taiwan
- Rest of Asia Pacific
- Latin America
- Brazil
- Argentina
- Peru
- Chile
- Colombia
- Rest of Latin America
- Middle East
- UAE
- KSA
- Israel
- Turkey
- Iran
- Rest of Middle East
- Africa
- Egypt
- Nigeria
- Algeria
- Morocco
- Rest of Africa
Regional Analysis:
North America and Europe:
North America held 38% market share in 2024, making it the largest regional market. Europe followed with 29% market share during the same year. Advanced oncology infrastructure, high healthcare spending, and access to innovative therapies strengthen adoption in these regions. It benefits from widespread use of both branded and generic injectable cytotoxic drugs across hospital and specialty clinics. Favorable reimbursement systems in the United States, Germany, and France continue to support sustained demand. Regulatory focus on safety and clinical standards further reinforces market strength across these two regions.
Asia-Pacific:
Asia-Pacific accounted for 22% market share in 2024, positioning it as the fastest-growing region. Expanding healthcare infrastructure in China, India, and Japan is driving large-scale adoption of injectable cytotoxic drugs. It is supported by increasing cancer incidence, higher screening rates, and rising government investments in oncology care. Affordable generics dominate usage, enabling broader patient access in low- and middle-income countries. Pharmaceutical firms are expanding production and clinical trials within this region to meet local demand. Rapid urbanization and lifestyle-related cancer cases further strengthen long-term market potential.
Latin America and Middle East & Africa:
Latin America captured 6% market share in 2024, while the Middle East & Africa held 5% market share. Both regions are witnessing improved access to cancer treatment through government funding and private investment. It is supported by infrastructure upgrades, hospital expansions, and better diagnostic facilities. Brazil, Mexico, Saudi Arabia, and South Africa are key countries fueling regional demand. Generic injectable cytotoxic drugs remain central due to affordability and supply availability. Expanding insurance coverage and international partnerships create growth opportunities for manufacturers in these developing markets.
Key Player Analysis:
- Bristol-Myers Squibb
- Novartis AG
- F. Hoffmann-La Roche Ltd
- Pfizer
- Viatris
- Teva Pharmaceuticals
- Baxter
- Sun Pharmaceutical Industries
- Hikma Pharmaceuticals
- Cipla
Competitive Analysis:
The injectable cytotoxic drugs market is highly competitive with global pharmaceutical leaders driving innovation and supply. Key companies include Bristol-Myers Squibb, Novartis AG, F. Hoffmann-La Roche Ltd, Pfizer, Viatris, Teva Pharmaceuticals, and Baxter. These firms maintain strong portfolios across multiple cancer types, supported by extensive distribution networks and established clinical credibility. It benefits from their focus on combination therapies, reformulations, and generics to address patient needs. Competition is shaped by patent expirations, the rise of cost-effective generics, and ongoing clinical research targeting improved safety profiles. Companies are also strengthening positions through partnerships, regional expansions, and oncology-focused pipelines. It reflects a balanced landscape where multinational firms dominate developed markets while generics producers expand in emerging economies.
Recent Developments:
- In July 2025, Bristol-Myers Squibb's Supplemental New Drug Application for Sotyktu (deucravacitinib) for the treatment of adults with active psoriatic arthritis was accepted for review across four regions globally (July 20, 2025).
- In October 2024, F. Hoffmann-La Roche Ltd received FDA approval for the first companion diagnostic VENTANA CLDN18 (43-14A) RxDx Assay, to support treatment of gastric and gastroesophageal junction cancers (October 20, 2024).
Report Coverage:
The research report offers an in-depth analysis based on Drug Class, Application, Distribution Channel and Region. It details leading Market players, providing an overview of their business, product offerings, investments, revenue streams, and key applications. Additionally, the report includes insights into the competitive environment, SWOT analysis, current Market trends, as well as the primary drivers and constraints. Furthermore, it discusses various factors that have driven Market expansion in recent years. The report also explores Market dynamics, regulatory scenarios, and technological advancements that are shaping the industry. It assesses the impact of external factors and global economic changes on Market growth. Lastly, it provides strategic recommendations for new entrants and established companies to navigate the complexities of the Market.
Future Outlook:
- The injectable cytotoxic drugs market will maintain relevance despite competition from advanced oncology therapies.
- Demand will rise in developing regions due to affordability and access to generics.
- Pharmaceutical firms will invest in reformulations aimed at reducing toxicity and side effects.
- Integration with targeted and immune-based treatments will strengthen the role of cytotoxic drugs.
- Expanding geriatric populations will drive consistent demand across global healthcare systems.
- Hospitals and cancer centers will continue to rely on injectable formats for reliable delivery.
- Regional manufacturers will expand production capacity to meet growing demand in Asia-Pacific and Africa.
- Governments will support adoption through procurement programs, reimbursement policies, and cancer care initiatives.
- Research pipelines will focus on enhancing cytotoxic efficacy in combination protocols.
- Long-term opportunities will emerge in personalized oncology where cytotoxic drugs form part of multi-drug regimens.
Request a Free Sample
Fill in your details and we'll send you a free sample report.
- Sample data tables & charts
- Research methodology
Need a Custom Version of This Report?
Tailor the scope, geography, or segments to your exact requirements.
- Custom geography or segment scope
- Direct access to our analyst team
Frequently Asked Questions
What is the current market size for the Injectable Cytotoxic Drugs Market, and what is its projected size in 2032?
At what Compound Annual Growth Rate is the Injectable Cytotoxic Drugs Market projected to grow between 2024 and 2032?
Which Injectable Cytotoxic Drugs Market segment held the largest share in 2024?
What are the primary factors fueling the growth of the Injectable Cytotoxic Drugs Market?
Who are the leading companies in the Injectable Cytotoxic Drugs Market?
Which region commanded the largest share of the Injectable Cytotoxic Drugs Market in 2024?
Table of Content
Chapter 1. Report Introduction
- 1.1 Report Description & Purpose
- 1.1.1 Report Title & Market Definition
- 1.1.2 Unique Selling Propositions (USP) & Key Differentiators
- 1.1.3 Value Proposition for Stakeholders
- 1.2 Research Objectives
- 1.2.1 Market Sizing Objectives (Volume & Revenue)
- 1.2.2 Segmentation Objectives
- 1.2.3 Competitive Intelligence Objectives
- 1.2.4 Forecast & Scenario Objectives
- 1.3 Report Scope
- 1.3.1 Injectable Cytotoxic Drugs Scope – Types & Subtypes Covered
- 1.3.2 Geographic Scope – Regions & Countries Covered
- 1.3.3 Historical Period, Base Year & Forecast Period (2024; forecast to 2032)
- 1.3.4 Inclusions & Exclusions
- 1.4 HS Code & Classification Framework
- 1.5 Currency, Units & Pricing Basis
- 1.6 Target Stakeholders
- 1.7 Limitations & Assumptions
Chapter 2. Executive Summary
- 2.1 Global Injectable Cytotoxic Drugs Market Snapshot
- 2.1.1 Market Size – Historical (2024) & Forecast (2024-2032) (2024: USD 19.47 billion → 2032: USD 30.5 billion)
- 2.1.2 Volume & Revenue – Global Totals
- 2.1.3 Key Market Highlights – Top Five Facts
- 2.2 Injectable Cytotoxic Drugs Market Segmentation Snapshot
- 2.2.1 Market Split by Region – 2024 vs. 2032
- 2.3 Competitive Snapshot
- 2.3.1 Top 10 Players by Revenue Share – 2024
- 2.3.2 Top 10 Players by Volume Share – 2024
- 2.3.3 Recent Strategic Developments (18-Month Summary)
- 2.4 Key Investment Highlights & Strategic Conclusions
Chapter 3. Injectable Cytotoxic Drugs Market Dynamics & Industry Analysis
- 3.1 Market Overview & Context
- 3.1.1 Injectable Cytotoxic Drugs Market Position in the Broader Automotive Value Chain
- 3.1.2 OEM vs. Replacement Market Dynamics
- 3.1.3 Market Maturity & Development Stage by Region
- 3.2 Injectable Cytotoxic Drugs Market Drivers
- 3.3 Injectable Cytotoxic Drugs Market Restraints & Challenges
- 3.4 Injectable Cytotoxic Drugs Market Opportunities
- 3.5 Porter's Five Forces Analysis
- 3.5.1 Threat of New Entrants
- 3.5.2 Bargaining Power of Suppliers
- 3.5.3 Bargaining Power of Buyers
- 3.5.4 Threat of Substitutes
- 3.5.5 Competitive Rivalry – Intensity Assessment
- 3.6 Injectable Cytotoxic Drugs Value Chain Analysis
- 3.6.1 Upstream – Raw Material/Input Suppliers
- 3.6.1.1 Raw Material/Input 1
- 3.6.1.2 Raw Material/Input 2
- 3.6.1.3 Raw Material/Input 3
- 3.6.2 Midstream – Production/Manufacturing/Service Delivery
- 3.6.2.1 Production/Process Overview
- 3.6.2.2 Key Facility Locations & Capacity by Manufacturer
- 3.6.3 Downstream – Distribution & End Consumer
- 3.6.3.1 Primary Channel – B2B/OEM
- 3.6.3.2 Secondary Channels – Dealer, Retail, Online, Direct
- 3.6.4 Value Chain Profitability Analysis
- 3.6.1 Upstream – Raw Material/Input Suppliers
- 3.7 PESTEL Analysis
- 3.7.1 Political Factors
- 3.7.2 Economic Factors
- 3.7.3 Social Factors
- 3.7.4 Technological Factors
- 3.7.5 Environmental Factors
- 3.7.6 Legal Factors
- 3.8 Injectable Cytotoxic Drugs Supply Chain Analysis
- 3.8.1 Raw Material/Input Supply Risk Assessment
- 3.8.2 Manufacturing Concentration Risk (Geographic Exposure)
- 3.8.3 Trade Disruption Impact Analysis
- 3.9 Regulatory & Policy Landscape
Note: The regulatory and policy landscape section covers regulations based on their applicability to the market, Injectable Cytotoxic Drugs category, geography, and scope of the study. Only regulatory frameworks with a material impact on operations, compliance, trade, sustainability, or market access are analyzed in detail.
Chapter 4. Key Investment Pockets & Opportunity Analysis
- 4.1 Injectable Cytotoxic Drugs Market Attractiveness Analysis
- 4.1.1 By Region – Investment Attractiveness Matrix (Volume × CAGR)
- 4.2 Absolute Revenue Growth Opportunity
- 4.2.1 By Region – Absolute USD Growth Through 2032
- 4.3 Incremental Volume Opportunity
- 4.3.1 By Region – Incremental Volume Through 2032
- 4.3.2 Segment – Incremental Volume
- 4.4 Emerging Submarket Opportunity Deep Dive (Subject to Applicability)
- 4.5 Emerging Market Opportunity Scorecards
- 4.5.1 United States
- 4.5.2 Europe
- 4.5.3 Asia
- 4.5.4 Middle East & Africa
Note: Emerging Market Opportunity Scorecards will be included based on relevance and strategic importance. Regions listed are indicative and may vary depending on data availability and market dynamics.
Chapter 5. Injectable Cytotoxic Drugs Import-Export Analysis & Trade Flows
- 5.1 Global Trade Overview
- 5.1.1 Global Export Value by Country (2024)
- 5.1.2 Global Export Volume by Country (2024)
- 5.1.3 Global Import Value by Country (2024)
- 5.1.4 Global Import Volume by Country (2024)
- 5.1.5 Net Trade Balance by Country (2024)
- 5.2 Export Analysis – Segment
- 5.2.1 Type 1 (HS Code)
- 5.2.2 Type 2 (HS Code)
- 5.2.3 Type 3 (HS Code)
- 5.2.4 Type 4 (HS Code)
- 5.2.5 Type 5 (HS Code)
- 5.3 Import Analysis – Segment
- 5.3.1 Type 1 (HS Code)
- 5.3.2 Type 2 (HS Code)
- 5.3.3 Type 3 (HS Code)
- 5.3.4 Type 4 (HS Code)
- 5.3.5 Type 5 (HS Code)
- 5.4 Average Unit Trade Prices
- 5.4.1 Average Export Price – Segment & Country
- 5.4.2 Average Import Price – Segment & Source Country
- 5.4.3 Price Trends (2024)
- 5.5 Key Trade Route Analysis
- 5.5.1 Trade Route 1
- 5.5.2 Trade Route 2
- 5.5.3 Trade Route 3
- 5.5.4 Trade Route 4
- 5.5.5 Trade Route 5
- 5.6 Trade Policy Impact Assessment
- 5.6.1 US Anti-Dumping & Section 301 Tariffs
- 5.6.2 EU Customs Union Impact
- 5.6.3 Major Free Trade Agreements
- 5.6.4 USMCA Rules of Origin
Note: Trade policy analysis will be included only where relevant to the Injectable Cytotoxic Drugs market.
Chapter 6. Competitive Landscape & Company Benchmarking
- 6.1 Injectable Cytotoxic Drugs Market Concentration & Structure
- 6.1.1 Herfindahl-Hirschman Index (HHI) – vs. 2024
- 6.1.2 Tier 1, Tier 2 & Tier 3 Market Structure
- 6.1.3 Global, Regional & Local Player Dynamics
- 6.2 Injectable Cytotoxic Drugs Market Share Analysis – 2024
- 6.2.1 Global Revenue Share by Company
- 6.2.2 Global Volume Share by Company
- 6.2.3 Regional Revenue Share
- 6.2.4 Market Share Evolution ( vs. 2024)
- 6.2.5 OEM Segment Share by Company
- 6.2.6 Replacement Segment Share by Company
- 6.3 Production/Delivery Capacity & Facility Analysis
- 6.3.1 Global Installed Capacity
- 6.3.2 Capacity Utilization Rates
- 6.3.3 Production/Output Volume
- 6.3.4 Facility Locations & Capacity Map
- 6.3.5 Planned Capacity Additions
- 6.4 Injectable Cytotoxic Drugs Competitive Benchmarking Matrix
- 6.4.1 Revenue, Volume, CAGR & Profitability Comparison
- 6.4.2 Channel Revenue Mix
- 6.4.3 Geographic Revenue Exposure
- 6.4.4 R&D Intensity
- 6.4.5 Sustainability Maturity
- 6.5 Strategic Developments in Injectable Cytotoxic Drugs (Last 24 Months)
- 6.5.1 Mergers, Acquisitions & Divestments
- 6.5.2 New Injectable Cytotoxic Drugs Launches
- 6.5.3 Facility Expansions
- 6.5.4 Strategic Alliances, Joint Ventures & Partnerships
- 6.5.5 Distribution Expansion & Market Entry
- 6.5.6 Sustainability & ESG Initiatives
- 6.6 Competitive Strategy Mapping
- 6.6.1 Leader, Challenger, Follower & Niche Classification
- 6.6.2 Pricing Strategy Comparison
- 6.6.3 Channel Strategy Matrix
Note: Strategic developments are included based on their materiality and the availability of reliable information.
Chapter 7. Global Injectable Cytotoxic Drugs Market – By Distribution Channel
- 7.1 Segment Overview
- 7.1.1 Volume & Revenue Split by Channel (2024 & 2032)
- 7.1.2 Channel Mix Evolution (2024-2032)
Chapter 8. Regional Market Analysis – Global Overview
- 8.1 Global Regional Overview
- 8.1.1 Regional Volume Share
- 8.1.2 Regional Revenue Share
- 8.1.3 Regional Volume by Region
- 8.1.4 Regional Revenue by Region
- 8.1.5 Regional Forecast Through 2032
- 8.2 Cross-Regional Segment Analysis
- 8.2.1 By Distribution Channel
- 8.2.2 By Brand/Price Tier
Chapter 9. North America Injectable Cytotoxic Drugs Market
- 9.1 United States
- 9.2 Canada
- 9.3 Mexico
Chapter 10. Europe Injectable Cytotoxic Drugs Market
- 10.1 Germany
- 10.2 France
- 10.3 Italy
- 10.4 United Kingdom
- 10.5 Spain
- 10.6 Poland
- 10.7 Russia
- 10.8 Netherlands
- 10.9 Belgium
- 10.10 Sweden
- 10.11 Denmark
- 10.12 Norway
- 10.13 Rest of Europe
Chapter 11. Asia Pacific Injectable Cytotoxic Drugs Market
- 11.1 China
- 11.2 India
- 11.3 Japan
- 11.4 South Korea
- 11.5 Thailand
- 11.6 Indonesia
- 11.7 Vietnam
- 11.8 Malaysia
- 11.9 Australia
- 11.10 Rest of Asia Pacific
Chapter 12. Latin America Injectable Cytotoxic Drugs Market
- 12.1 Brazil
- 12.2 Argentina
- 12.3 Colombia
- 12.4 Chile
- 12.5 Rest of Latin America
Chapter 13. Middle East Injectable Cytotoxic Drugs Market
- 13.1 Saudi Arabia
- 13.2 United Arab Emirates
- 13.3 Turkey
- 13.4 Israel
- 13.5 Iran
- 13.6 Rest of the Middle East
Chapter 14. Africa Injectable Cytotoxic Drugs Market
- 14.1 South Africa
- 14.2 Egypt
- 14.3 Nigeria
- 14.4 Morocco
- 14.5 Rest of Africa
Chapter 15. Injectable Cytotoxic Drugs Company Profiles
- 15.1 [Company 01]
- 15.1.1 Company Overview
- 15.1.2 Key Management Personnel
- 15.1.3 Products & Services Portfolio
- 15.1.4 Financial Performance
- 15.1.5 Key Market Focus & Geographic Presence
- 15.1.6 Recent Developments & Strategic Initiatives
Note: The company profile list is preliminary and may change based on research findings, market developments, data availability, and client requirements.
Chapter 16. Appendices
- Appendix A – List of Abbreviations & Acronyms
- Appendix B – Industry Classification Code Reference – Full Series
- Appendix C – Production & Capacity Data Tables
- Appendix D – End-Use & Demand Base Tables
- Appendix E – Consumption & Replacement Rate Assumptions
- Appendix F – ASP Reference Tables
- Appendix G – Manufacturing & Facility Database
- Appendix H – Import-Export Data Tables
- Appendix I – Regulatory Summary Tables
- Appendix J – Primary Research Participant List (Anonymized)
- Appendix K – Primary Research Questionnaire Framework
- Appendix L – Data Sources & Bibliography
- Appendix M – Market Size Divergence & Source Comparison
Chapter 17. Research Methodology
- 17.1 Research Framework & Philosophy
- 17.2 Secondary Research – Sources, Hierarchy & Data Extraction
- 17.3 Data Modeling – Bottom-Up & Top-Down Market Sizing
- 17.4 Primary Research – Stakeholder Framework, LOI & Sample Sizes
- 17.5 Forecast Methodology – Regression, Scenario & Sensitivity Analysis
- 17.6 Quality Control – Four-Layer Validation Framework
- 17.7 Limitations & Standard Assumptions
- 17.8 Disclaimer
