Home » Consumer Goods » Mackerel Market

Mackerel Market By Product Form (Fresh, Frozen, Canned, Processed [Value-added Forms]); By Species (Atlantic Mackerel, Spanish Mackerel, King Mackerel, Others); By Distribution Channel (Supermarkets & Hypermarkets, Convenience Stores, Online Retail, Specialty Stores, Others) – Growth, Share, Opportunities & Competitive Analysis, 2024 – 2032

Report ID: 26016 | Report Format : Excel, PDF

Market Overview:

The Global Mackerel Market size was valued at USD 1,150.00 million in 2018 to USD 1,328.67 million in 2024 and is anticipated to reach USD 1,987.36 million by 2032, at a CAGR of 5.21% during the forecast period.

REPORT ATTRIBUTE DETAILS
Historical Period 2020-2023
Base Year 2024
Forecast Period 2025-2032
Mackerel Market Size 2024 USD 1,328.67 million
Mackerel Market, CAGR 5.21%
Mackerel Market Size 2032 USD 1,987.36 million


The market is driven by increasing consumer demand for affordable protein-rich seafood. Rising health awareness has boosted consumption, as mackerel offers omega-3 fatty acids and essential nutrients. Expanding aquaculture and improved cold-chain logistics are supporting higher supply levels. Growing demand in processed and frozen seafood categories, coupled with changing dietary preferences toward healthier options, also sustains market growth. Governments promoting sustainable fishing practices are further shaping the industry outlook.

Regionally, Europe leads the market due to strong seafood consumption and established fishing industries. Asia-Pacific is emerging as a high-growth region, supported by rising disposable incomes and shifting diets in countries such as China, Japan, and India. North America holds a stable share, driven by steady seafood imports and consumer interest in nutrient-rich diets. Africa and Latin America are also gaining traction, as local fishing and export activities expand.

Mackerel Market size

Market Insights:

  • The Global Mackerel Market size was valued at USD 1,150.0 million in 2018, reached USD 1,328.7 million in 2024, and is projected to hit USD 1,987.4 million by 2032, growing at a CAGR of 5.21%.
  • Asia Pacific leads with a 42.3% share in 2024, driven by high seafood consumption, aquaculture growth, and strong export hubs. Europe follows with 22.8% supported by established fishing industries, while North America accounts for 21.2% with steady demand for frozen and canned products.
  • Asia Pacific is the fastest-growing region, supported by rising disposable incomes, evolving dietary habits, and rapid expansion of retail and e-commerce channels.
  • Among product forms, frozen mackerel holds the largest share at around 32% in 2024, favored for longer shelf life and international trade.
  • Canned mackerel accounts for nearly 28% of the 2024 market, with demand fueled by convenience, affordability, and preference in both developed and emerging economies.

Access crucial information at unmatched prices!

Request your sample report today & start making informed decisions powered by Credence Research Inc.!

Download Sample

Market Drivers:

Rising Health Awareness and Nutritional Benefits Driving Global Consumption

The Global Mackerel Market benefits from increasing consumer awareness of seafood’s nutritional value. Mackerel provides omega-3 fatty acids, essential vitamins, and minerals that improve cardiovascular and brain health. Consumers searching for natural protein sources are steadily rising demand. Urban populations continue shifting toward healthier diets, making seafood a regular choice. Governments and health agencies promote fish consumption as part of preventive healthcare campaigns. Retailers emphasize nutritional labeling to attract health-focused buyers. The rise of fitness and wellness culture also supports demand growth. It is becoming a staple in both developed and emerging markets.

  • For instance, John West Foods, a leading UK canned fish brand, launched fortified mackerel and tuna products explicitly labeled for high omega-3 content, with “Heart” packs indicating elevated levels designed to support heart health, and brand campaigns focusing on nutrient transparency for health-conscious consumers across the UK

Expanding Aquaculture and Cold-Chain Infrastructure Strengthening Supply Availability

Aquaculture advancements play a vital role in meeting global mackerel demand. Fish farming methods ensure steady supply despite seasonal fluctuations in wild catches. Investments in modern cold-chain logistics help preserve product quality during distribution. Export markets benefit from efficient freezing and packaging technologies. Processors can meet consumer expectations for safety and freshness across borders. Developing nations are increasing infrastructure to support seafood exports. This improved distribution network expands consumer access worldwide. It supports market stability and strengthens growth momentum.

  • For instance, Pelagia AS applies Individual Quick Freezing (IQF) technology to mackerel, cooling fillets to -20°C immediately after processing and packing into cartons as large as 12kg, delivering 304,648 tonnes of frozen mackerel in 2021 to maintain year-round supply consistency even in fluctuating catch seasons.

Growing Popularity of Processed and Ready-To-Eat Seafood Products

The Global Mackerel Market gains traction through rising consumption of processed and frozen fish. Consumers value convenience, especially in urban settings with busy lifestyles. Ready-to-eat meals, canned seafood, and frozen portions are growing in demand. Modern processing technologies improve product shelf life without compromising nutrition. Supermarkets expand seafood product lines to capture household buyers. Foodservice outlets add mackerel to menus, targeting health-conscious diners. Packaging innovations highlight sustainability and freshness to attract consumers. It ensures the category remains competitive against other protein sources.

Supportive Government Policies and Sustainable Fishing Initiatives

Government regulations encourage sustainable fishing to protect marine ecosystems. Fishing quotas and certifications guide companies toward responsible practices. Policies ensure that resources remain available for long-term supply. International bodies work with local governments to set sustainable harvesting standards. Retailers and restaurants highlight certified seafood to gain consumer trust. Awareness of environmental responsibility influences purchase decisions across markets. These measures strengthen the reputation of mackerel as an ethical choice. It builds consumer confidence and supports consistent market expansion.

Market Trends:

Growing Shift Toward Premium and Value-Added Seafood Products Globally

The Global Mackerel Market shows strong demand for premium and value-added offerings. Consumers are choosing fillets, marinated options, and ready-to-cook packs. Value addition improves convenience while enhancing taste appeal. Retailers promote gourmet and specialty seafood sections to target higher-income buyers. Rising disposable incomes encourage spending on premium proteins. Urban lifestyles reinforce the trend toward ready-prepared meals. Processors introduce innovative product formats to remain competitive. It drives a higher margin segment and expands consumer appeal worldwide.

  • For instance, Nissui (Nippon Suisan Kaisha) achieved its first commercial harvest of RAS-grown chub mackerel in November 2021, with fish weighing between 250 and 350 grams sold to retailers and wholesalers in Japan, introducing parasite-free, consistently sized premium fillets to the market.

Expansion of Online Retail and E-Commerce Distribution Channels

Digital platforms are becoming vital sales channels for seafood products. The Global Mackerel Market benefits from rapid growth in online food delivery and e-commerce. Consumers prefer ordering seafood online due to convenience and variety. Platforms integrate temperature-controlled delivery systems to maintain quality. Retailers promote discounts and subscription models to build customer loyalty. E-commerce ensures direct-to-home access for frozen and packaged mackerel. Online platforms expand brand reach in both developed and developing regions. It increases consumer accessibility and strengthens sales volumes.

  • For instance, in 2022, China’s seafood imports surged 22% year-on-year to 4.1 million metric tons, with companies such as JD Fresh and major e-commerce platforms expanding frozen and processed mackerel access for urban consumers, leveraging temperature-controlled logistics to ensure quality in home deliveries.

Innovation in Packaging and Processing for Longer Shelf Life

Packaging innovation is shaping the seafood market landscape. The Global Mackerel Market benefits from vacuum-sealed packs, smart labeling, and eco-friendly materials. Extended shelf life reduces food waste and supports export growth. Packaging ensures quality retention from processing to retail delivery. Eco-conscious buyers are drawn to recyclable and sustainable materials. Advanced freezing and preservation methods protect freshness across long distances. Processors use technology to improve traceability and food safety. It drives consumer trust and sustains international demand.

Rising Consumer Preference for Sustainable and Ethical Sourcing

Sustainability is a defining trend in global seafood markets. The Global Mackerel Market responds to demand for responsibly sourced fish. Consumers want transparency on fishing methods and supply chains. Certifications such as MSC influence buyer confidence in seafood products. Retailers and restaurants showcase sustainable options to align with consumer values. Growing environmental awareness drives ethical purchasing decisions. Governments strengthen sustainability policies to regulate overfishing. It ensures long-term supply while meeting global consumer expectations.

Mackerel Market share

Market Challenges Analysis:

Volatility in Raw Material Supply and Impact of Climate Change

The Global Mackerel Market faces challenges due to supply volatility. Climate change affects fish migration and breeding patterns, creating uncertainty in catch levels. Overfishing continues to strain marine resources and disrupt stability. Seasonal fluctuations cause unpredictable supply chains, impacting pricing. Rising ocean temperatures affect stock distribution across fishing zones. Processors face higher costs in sourcing raw fish sustainably. Import-dependent nations experience further risks from trade restrictions. It struggles to balance growing demand with ecological constraints.

Regulatory Restrictions and Rising Competition from Alternative Proteins

Regulatory requirements challenge market participants across multiple regions. Strict fishing quotas and international trade rules restrict flexibility. Compliance costs increase operational burdens for companies. Alternative protein sources, including plant-based and lab-grown seafood, create competitive pressure. Consumers experimenting with substitutes can reduce traditional seafood demand. Price volatility in fuel and logistics further strains profitability. Trade disputes or tariff barriers may limit export opportunities. It must adapt to regulatory compliance while addressing rising substitutes.

Market Opportunities:

Expansion in Emerging Markets and Rising Seafood Consumption Globally

The Global Mackerel Market has strong growth opportunities in emerging economies. Rising incomes and dietary diversification boost seafood consumption in Asia, Africa, and Latin America. Urbanization drives demand for affordable protein sources in these regions. Governments promote fish consumption as part of food security initiatives. Retail expansion provides new access points for consumers. Exporters target these high-potential regions with frozen and processed products. Cultural acceptance of fish-based diets further enhances growth scope. It positions mackerel as a staple in expanding markets.

Innovation in Value-Added Products and Development of Sustainable Practices

Opportunities grow through innovative value-added seafood options. Processors focus on convenience-driven formats such as marinated packs and ready meals. Investments in eco-friendly fishing and processing align with sustainability trends. Retailers highlight responsibly sourced products to strengthen brand reputation. Eco-conscious consumers reward companies with transparent practices. Exporters leverage sustainable certifications to expand international reach. New product lines also meet evolving taste preferences across regions. It supports long-term growth and strengthens industry resilience.

Market Segmentation Analysis:

By Product Form

The Global Mackerel Market is segmented into fresh, frozen, canned, and processed value-added forms. Fresh mackerel continues to dominate coastal and local markets where daily catch supports direct consumption. Frozen products remain highly demanded due to longer shelf life and suitability for exports. Canned mackerel caters to convenience-driven households and regions with limited access to fresh supply. Processed value-added forms, such as marinated and ready-to-cook products, are gaining popularity in urban markets where consumers seek convenience and premium seafood options. It benefits from innovation in packaging and preservation technologies that maintain quality.

  • For instance, Princes Group, a key European seafood supplier, distributes canned mackerel fillets high in omega-3, supplied throughout the UK and continental Europe, with sourcing processes focused on traceability, sustainable certifications, and operational efficiency (2023).

By Species

Species segmentation includes Atlantic, Spanish, King, and others. Atlantic mackerel leads global trade due to abundant stock and consumer preference in Europe and North America. Spanish mackerel enjoys strong demand in Asian countries, where it is widely used in traditional cuisines. King mackerel maintains a niche presence, favored for its larger size and rich flavor. Other species contribute to regional consumption, often serving local markets or specialized product lines. It ensures diverse supply and supports market resilience against stock fluctuations.

  • For instance, Norway exported a record 300,000 tonnes of Atlantic mackerel in 2020, marking a 26% increase in volume over the previous year; this species ranks as the second largest catch and is a major contributor to regional export stability.

By Distribution Channel

The market is classified into supermarkets and hypermarkets, convenience stores, online retail, specialty stores, and others. Supermarkets and hypermarkets dominate due to wide product variety and strong consumer reach. Convenience stores capture impulse buyers seeking ready-to-eat formats. Online retail is expanding rapidly, driven by urban consumers preferring doorstep delivery of frozen and canned seafood. Specialty stores build consumer trust with premium and sustainably sourced mackerel. Other channels include local wet markets that continue to thrive in developing nations. It ensures comprehensive availability across both traditional and modern trade networks.

Mackerel Market segmentation

Segmentation:

  • By Product Form
    • Fresh
    • Frozen
    • Canned
    • Processed (value-added forms)
  • By Species
    • Atlantic Mackerel
    • Spanish Mackerel
    • King Mackerel
    • Others
  • By Distribution Channel
    • Supermarkets & Hypermarkets
    • Convenience Stores
    • Online Retail
    • Specialty Stores
    • Others
  • By Region
    • North America
      • U.S.
      • Canada
      • Mexico
    • Europe
      • Germany
      • France
      • U.K.
      • Italy
      • Spain
      • Rest of Europe
    • Asia Pacific
      • China
      • Japan
      • India
      • South Korea
      • South-east Asia
      • Rest of Asia Pacific
    • Latin America
      • Brazil
      • Argentina
      • Rest of Latin America
    • Middle East & Africa
      • GCC Countries
      • South Africa
      • Rest of the Middle East and Africa

Regional Analysis:

North America

The North America Global Mackerel Market size was valued at USD 271.40 million in 2018 to USD 281.15 million in 2024 and is anticipated to reach USD 419.55 million by 2032, at a CAGR of 5.2% during the forecast period. North America accounts for around 21.2% of the market share in 2024. The region benefits from a stable demand for frozen and canned mackerel due to well-established seafood consumption patterns. The U.S. remains the key consumer, supported by imports from Europe and Asia. Health awareness and preference for omega-3 rich diets drive growth across retail and foodservice channels. Strong distribution through supermarkets and online platforms ensures accessibility. It experiences growth in premium and sustainably sourced seafood products. Rising consumer preference for convenience continues to influence canned and processed formats. North America sustains steady expansion by leveraging dietary trends and established seafood import networks.

Europe

The Europe Global Mackerel Market size was valued at USD 273.70 million in 2018 to USD 302.64 million in 2024 and is anticipated to reach USD 424.80 million by 2032, at a CAGR of 4.4% during the forecast period. Europe holds around 22.8% of the market share in 2024. The region dominates due to strong domestic fishing industries in countries like Norway, Spain, and the UK. High seafood consumption and cultural reliance on mackerel strengthen its position. Demand for fresh and frozen mackerel remains robust in retail and foodservice segments. Sustainability certifications influence purchase decisions, aligning with environmental policies. It benefits from advanced processing facilities and export networks. Europe continues to lead in promoting traceable and responsibly sourced seafood. Technological adoption in packaging and processing improves export competitiveness. The market remains a key global hub for production and consumption.

Asia Pacific

The Asia Pacific Global Mackerel Market size was valued at USD 473.80 million in 2018 to USD 561.82 million in 2024 and is anticipated to reach USD 892.92 million by 2032, at a CAGR of 6.0% during the forecast period. Asia Pacific accounts for the largest share, around 42.3% in 2024. The region leads due to high seafood consumption across China, Japan, and Southeast Asia. Rising incomes and dietary diversification fuel growth in both fresh and processed categories. Urban consumers prefer frozen and canned formats for convenience. Traditional cuisines support demand for multiple mackerel species. Aquaculture expansion strengthens supply, while export hubs like China expand reach. It benefits from government initiatives promoting seafood for nutrition security. E-commerce channels play an increasing role in seafood distribution. Asia Pacific stands as the fastest-growing region, driven by scale, cultural demand, and modern retail expansion.

Latin America

The Latin America Global Mackerel Market size was valued at USD 85.10 million in 2018 to USD 97.51 million in 2024 and is anticipated to reach USD 136.87 million by 2032, at a CAGR of 4.4% during the forecast period. Latin America contributes about 7.3% of the market share in 2024. The region experiences steady growth supported by local fishing activity and rising demand for affordable protein. Countries like Brazil and Mexico drive consumption through both fresh and canned products. Retail channels, including supermarkets, expand seafood availability. Export activities to Europe and Asia strengthen the region’s position. It shows growing interest in value-added and processed seafood products. Rising urbanization drives higher demand for packaged formats. Latin America strengthens its growth potential by balancing local consumption with export opportunities.

Middle East

The Middle East Global Mackerel Market size was valued at USD 32.20 million in 2018 to USD 34.01 million in 2024 and is anticipated to reach USD 43.93 million by 2032, at a CAGR of 3.3% during the forecast period. The Middle East holds a 2.6% market share in 2024. Seafood demand is supported by growing awareness of health benefits and the presence of large expatriate populations. Imports play a major role, with supply coming from Europe and Asia. Retail channels emphasize frozen and canned seafood formats due to storage advantages. The market benefits from increasing investment in cold-chain infrastructure. It continues to face challenges of limited local catch and reliance on imports. Processed formats gain traction in urban centers. Foodservice channels highlight seafood in premium menus, supporting steady demand.

Africa

The Africa Global Mackerel Market size was valued at USD 13.80 million in 2018 to USD 51.54 million in 2024 and is anticipated to reach USD 69.28 million by 2032, at a CAGR of 3.5% during the forecast period. Africa represents around 3.9% of the market share in 2024. The region experiences growth due to reliance on seafood as a low-cost protein source. Countries in West Africa remain major consumers, with imports driving availability. Frozen mackerel dominates consumption due to longer shelf life and affordability. Governments encourage seafood imports to improve food security. It benefits from growing urban populations with rising demand for packaged formats. Informal wet markets continue to serve a large part of the population. Africa presents opportunities for expansion through improved distribution and cold storage facilities. The region’s importance grows steadily, driven by affordability and nutritional needs.

Shape Your Report to Specific Countries or Regions & Enjoy 30% Off!

Key Player Analysis:

Competitive Analysis:

The Global Mackerel Market is highly competitive, driven by established fishing companies and global seafood processors. Key players focus on strengthening their supply chains, improving cold storage, and expanding product offerings across fresh, frozen, canned, and processed categories. Regional companies target local demand, while global players concentrate on exports and branded products. Sustainable fishing practices and eco-certifications play a central role in shaping competitive advantage. Innovation in value-added products and packaging continues to differentiate leading firms. The market features both consolidated multinational groups and numerous regional suppliers, making competition diverse. It remains defined by strategic alliances, export activities, and rising e-commerce penetration.

Recent Developments:

  • In May 2025, Maruha Nichiro Corporation completed the acquisition of a 70% controlling stake in the Dutch processing firm Van der Lee Seafish (VDLEE), signaling a strategic push to expand in the European market and strengthen its value chain integration for seafood and mackerel products. The move aligns with the company’s midterm plans for 2025–2027, which emphasize overseas growth and vertical integration for long-term competitiveness.
  • On May 26, 2025, Maruha Nichiro Corporation also established a comprehensive business partnership with SENKO Group Holdings Co., Ltd., focusing on enhancing logistics functions and supply chain resilience for its seafood business, including mackerel. This alliance underscores Maruha Nichiro’s continued commitment to operational excellence and sustainability in the global seafood market.
  • As of August 2025, Nippon Suisan Kaisha, Ltd. (Nissui) has been pursuing a facility expansion, with its subsidiary Cite Marine acquiring a new processing facility to boost capacity. The aim is to increase sales by 50% by 2030, supporting further growth in core seafood categories, such as mackerel.

Report Coverage:

The research report offers an in-depth analysis based on product form, species, and distribution channel. It details leading market players, providing an overview of their business, product offerings, investments, revenue streams, and key applications. Additionally, the report includes insights into the competitive environment, SWOT analysis, current market trends, as well as the primary drivers and constraints. Furthermore, it discusses various factors that have driven market expansion in recent years. The report also explores market dynamics, regulatory scenarios, and technological advancements that are shaping the industry. It assesses the impact of external factors and global economic changes on market growth. Lastly, it provides strategic recommendations for new entrants and established companies to navigate the complexities of the market.

Future Outlook:

  • Rising demand for frozen and canned seafood products will expand retail penetration.
  • Sustainable fishing practices will become critical for brand reputation and long-term growth.
  • E-commerce channels will strengthen seafood distribution and consumer access globally.
  • Emerging markets in Asia, Africa, and Latin America will drive new consumption patterns.
  • Product innovations in marinated, ready-to-eat, and premium formats will attract urban buyers.
  • Investments in cold storage and logistics will enhance trade efficiency.
  • Strategic partnerships between processors and retailers will improve market reach.
  • Certifications and traceability will influence consumer trust and purchasing decisions.
  • Regional fishing policies and quotas will shape supply availability.
  • Technological advancements in preservation and packaging will support export growth.

CHAPTER NO. 1 : INTRODUCTION 26

1.1. Report Description 26

Purpose of the Report 26

USP & Key Offerings 26

1.2. Key Benefits for Stakeholders 27

1.3. Target Audience 27

CHAPTER NO. 2 : EXECUTIVE SUMMARY 28

CHAPTER NO. 3 : MACKEREL MARKET FORCES & INDUSTRY PULSE 30

3.1. Foundations of Change – Market Overview 30

3.2. Catalysts of Expansion – Key Market Drivers 32

3.3. Momentum Boosters – Growth Triggers 33

3.4. Innovation Fuel – Disruptive Technologies 33

3.5. Headwinds & Crosswinds – Market Restraints 34

3.6. Regulatory Tides – Compliance Challenges 35

3.7. Economic Frictions – Inflationary Pressures 35

3.8. Untapped Horizons – Growth Potential & Opportunities and Strategic Navigation – Industry Frameworks 36

3.9. Market Equilibrium – Porter’s Five Forces 37

3.10. Ecosystem Dynamics – Value Chain Analysis 39

3.11. Macro Forces – PESTEL Breakdown 41

3.12. Price Trend Analysis 43

3.12.1. Regional Price Trend 44

3.12.2. Price Trend by Product Type 44

3.13. Buying Criteria 45

CHAPTER NO. 4 : COMPETITION ANALYSIS 46

4.1. Company Market Share Analysis 46

4.1.1. Global Mackerel Market Company Revenue Market Share 46

4.2. Strategic Developments 48

4.2.1. Acquisitions & Mergers 48

4.2.2. New Product Type Launch 49

4.2.3. Agreements & Collaborations 50

4.3. Competitive Dashboard 51

4.4. Company Assessment Metrics, 2024 52

CHAPTER NO. 5 : GLOBAL MARKET ANALYSIS, INSIGHTS & FORECAST, BY PRODUCT FORM 53

CHAPTER NO. 6 : GLOBAL MARKET ANALYSIS, INSIGHTS & FORECAST, BY SPECIES 57

CHAPTER NO. 7 : GLOBAL MARKET ANALYSIS, INSIGHTS & FORECAST, BY DISTRIBUTION CHANNEL 61

CHAPTER NO. 8 : GLOBAL MARKET ANALYSIS, INSIGHTS & FORECAST, BY REGION 65

CHAPTER NO. 9 : NORTH AMERICA MARKET ANALYSIS, INSIGHTS & FORECAST, BY COUNTRY 70

9.1. North America Market Analysis, Insights & Forecast, by Product Form 72

9.2. North America Market Analysis, Insights & Forecast, by Species 73

9.3. North America Market Analysis, Insights & Forecast, by Distribution Channel 74

CHAPTER NO. 10 : EUROPE MARKET ANALYSIS, INSIGHTS & FORECAST, BY COUNTRY 75

10.1. Europe Market Analysis, Insights & Forecast, by Product Form 78

10.2. Europe Market Analysis, Insights & Forecast, by Species 79

10.3. Europe Market Analysis, Insights & Forecast, by Distribution Channel 80

CHAPTER NO. 11 : ASIA PACIFIC MARKET ANALYSIS, INSIGHTS & FORECAST, BY COUNTRY 81

11.1. Asia Pacific Market Analysis, Insights & Forecast, by Product Form 84

11.2. Asia Pacific Market Analysis, Insights & Forecast, by Species 85

11.3. Asia Pacific Market Analysis, Insights & Forecast, by Distribution Channel 86

CHAPTER NO. 12 : LATIN AMERICA MARKET ANALYSIS, INSIGHTS & FORECAST, BY COUNTRY 87

12.1. Latin America Market Analysis, Insights & Forecast, by Product Form 90

12.2. Latin America Market Analysis, Insights & Forecast, by Species 91

12.3. Latin America Market Analysis, Insights & Forecast, by Distribution Channel 92

CHAPTER NO. 13 : MIDDLE EAST MARKET ANALYSIS, INSIGHTS & FORECAST, BY COUNTRY 93

13.1. Middle East Market Analysis, Insights & Forecast, by Product Form 96

13.2. Middle East Market Analysis, Insights & Forecast, by Species 97

13.3. Middle East Market Analysis, Insights & Forecast, by Distribution Channel 98

CHAPTER NO. 14 : AFRICA MARKET ANALYSIS, INSIGHTS & FORECAST, BY COUNTRY 99

14.1. Africa Market Analysis, Insights & Forecast, by Product Form 102

14.2. Africa Market Analysis, Insights & Forecast, by Species 103

14.3. Africa Market Analysis, Insights & Forecast, by Distribution Channel 104

CHAPTER NO. 15 : COMPANY PROFILE 105

15.1. Thai Union Group Public Company Limited 105

15.2. John West Foods (part of Thai Union) 108

15.3. Pacific Andes International Holdings Limited 108

15.4. Maruha Nichiro Corporation 108

15.5. Nippon Suisan Kaisha, Ltd. 108

15.6. Company 6 108

15.7. Company 7 108

15.8. Company 8 108

15.9. Company 9 108

15.10. Company 10 108

15.11. Company 11 108

15.12. Company 12 108

15.13. Company 13 108

15.14. Company 14 108

List of Figures


FIG NO. 1. Mackerel Market Revenue Share, By Product Form, 2024 & 2032 53

FIG NO. 2. Market Attractiveness Analysis, By Product Form 54

FIG NO. 3. Incremental Revenue Growth Opportunity by Product Form, 2024 – 2032 55

FIG NO. 4. Mackerel Market Revenue Share, By Application, 2024 & 2032 57

FIG NO. 5. Incremental Revenue Growth Opportunity by Application, 2024 – 2032 58

FIG NO. 6. Incremental Revenue Growth Opportunity by Application, 2024 – 2032 59

FIG NO. 7. Mackerel Market Revenue Share, By Distribution Channel, 2024 & 2032 61

FIG NO. 8. Market Attractiveness Analysis, By Distribution Channel 62

FIG NO. 9. Incremental Revenue Growth Opportunity by Distribution Channel, 2024 – 2032 63

FIG NO. 10. Mackerel Market Revenue Share, By Region, 2024 & 2032 65

FIG NO. 11. Market Attractiveness Analysis, By Region 66

FIG NO. 12. Incremental Revenue Growth Opportunity by Region, 2024 – 2032 67

FIG NO. 13. Mackerel Market Revenue Share, By Country, 2024 & 2032 70

FIG NO. 14. Mackerel Market Revenue Share, By Country, 2024 & 2032 75

FIG NO. 15. Mackerel Market Revenue Share, By Country, 2024 & 2032 81

FIG NO. 16. Mackerel Market Revenue Share, By Country, 2024 & 2032 87

FIG NO. 17. Mackerel Market Revenue Share, By Country, 2024 & 2032 93

FIG NO. 18. Mackerel Market Revenue Share, By Country, 2024 & 2032 99

List of Tables


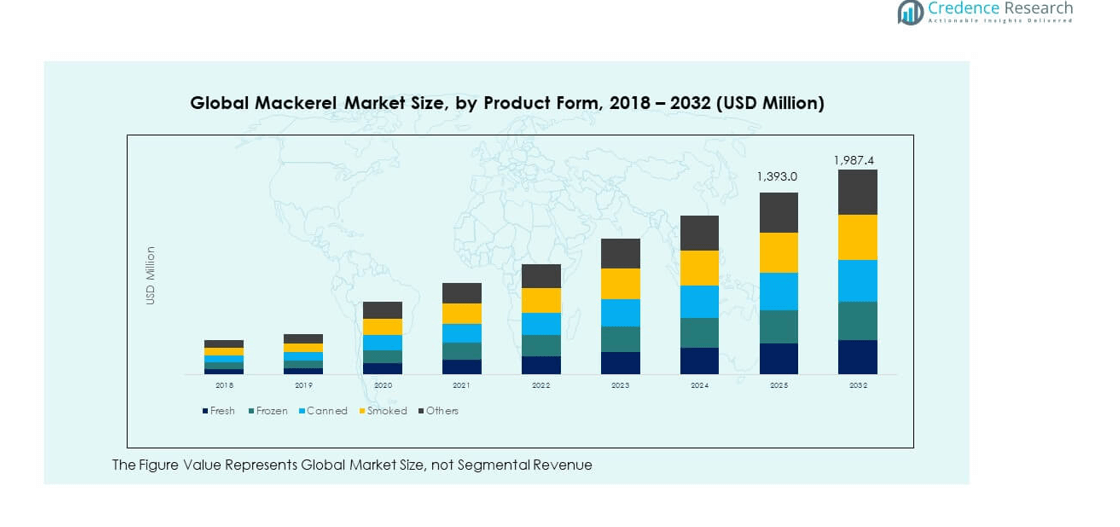
TABLE NO. 1. : Global Mackerel Market Revenue, By Product Form, 2018 – 2024 (USD Million) 56

TABLE NO. 2. : Global Mackerel Market Revenue, By Product Form, 2025 – 2032 (USD Million) 56

TABLE NO. 3. : Global Mackerel Market Revenue, By Species, 2018 – 2024 (USD Million) 60

TABLE NO. 4. : Global Mackerel Market Revenue, By Species, 2025 – 2032 (USD Million) 60

TABLE NO. 5. : Global Mackerel Market Revenue, By Distribution Channel, 2018 – 2024 (USD Million) 64

TABLE NO. 6. : Global Mackerel Market Revenue, By Distribution Channel, 2025 – 2032 (USD Million) 64

TABLE NO. 7. : Global Mackerel Market Revenue, By Region, 2018 – 2024 (USD Million) 68

TABLE NO. 8. : Global Mackerel Market Revenue, By Region, 2025– 2032 (USD Million) 69

TABLE NO. 9. : North America Mackerel Market Revenue, By Country, 2018 – 2024 (USD Million) 71

TABLE NO. 10. : North America Mackerel Market Revenue, By Country, 2025– 2032 (USD Million) 71

TABLE NO. 11. : North America Mackerel Market Revenue, By Product Form, 2018 – 2024 (USD Million) 72

TABLE NO. 12. : North America Mackerel Market Revenue, By Product Form, 2025 – 2032 (USD Million) 72

TABLE NO. 13. : North America Mackerel Market Revenue, By Species, 2018 – 2024 (USD Million) 73

TABLE NO. 14. : North America Mackerel Market Revenue, By Species, 2025 – 2032 (USD Million) 73

TABLE NO. 15. : North America Mackerel Market Revenue, By Distribution Channel, 2018 – 2024 (USD Million) 74

TABLE NO. 16. : North America Mackerel Market Revenue, By Distribution Channel, 2025 – 2032 (USD Million) 74

TABLE NO. 17. : Europe Mackerel Market Revenue, By Country, 2018 – 2024 (USD Million) 76

TABLE NO. 18. : Europe Mackerel Market Revenue, By Country, 2025– 2032 (USD Million) 77

TABLE NO. 19. : Europe Mackerel Market Revenue, By Product Form, 2018 – 2024 (USD Million) 78

TABLE NO. 20. : Europe Mackerel Market Revenue, By Product Form, 2025 – 2032 (USD Million) 78

TABLE NO. 21. : Europe Mackerel Market Revenue, By Species, 2018 – 2024 (USD Million) 79

TABLE NO. 22. : Europe Mackerel Market Revenue, By Species, 2025 – 2032 (USD Million) 79

TABLE NO. 23. : Europe Mackerel Market Revenue, By Distribution Channel, 2018 – 2024 (USD Million) 80

TABLE NO. 24. : Europe Mackerel Market Revenue, By Distribution Channel, 2025 – 2032 (USD Million) 80

TABLE NO. 25. : Asia Pacific Mackerel Market Revenue, By Country, 2018 – 2024 (USD Million) 82

TABLE NO. 26. : Asia Pacific Mackerel Market Revenue, By Country, 2025– 2032 (USD Million) 83

TABLE NO. 27. : Asia Pacific Mackerel Market Revenue, By Product Form, 2018 – 2024 (USD Million) 84

TABLE NO. 28. : Asia Pacific Mackerel Market Revenue, By Product Form, 2025 – 2032 (USD Million) 84

TABLE NO. 29. : Asia Pacific Mackerel Market Revenue, By Species, 2018 – 2024 (USD Million) 85

TABLE NO. 30. : Asia Pacific Mackerel Market Revenue, By Species, 2025 – 2032 (USD Million) 85

TABLE NO. 31. : Asia Pacific Mackerel Market Revenue, By Distribution Channel, 2018 – 2024 (USD Million) 86

TABLE NO. 32. : Asia Pacific Mackerel Market Revenue, By Distribution Channel, 2025 – 2032 (USD Million) 86

TABLE NO. 33. : Latin America Mackerel Market Revenue, By Country, 2018 – 2024 (USD Million) 88

TABLE NO. 34. : Latin America Mackerel Market Revenue, By Country, 2025– 2032 (USD Million) 89

TABLE NO. 35. : Latin America Mackerel Market Revenue, By Product Form, 2018 – 2024 (USD Million) 90

TABLE NO. 36. : Latin America Mackerel Market Revenue, By Product Form, 2025 – 2032 (USD Million) 90

TABLE NO. 37. : Latin America Mackerel Market Revenue, By Species, 2018 – 2024 (USD Million) 91

TABLE NO. 38. : Latin America Mackerel Market Revenue, By Species, 2025 – 2032 (USD Million) 91

TABLE NO. 39. : Latin America Mackerel Market Revenue, By Distribution Channel, 2018 – 2024 (USD Million) 92

TABLE NO. 40. : Latin America Mackerel Market Revenue, By Distribution Channel, 2025 – 2032 (USD Million) 92

TABLE NO. 41. : Middle East Mackerel Market Revenue, By Country, 2018 – 2024 (USD Million) 94

TABLE NO. 42. : Middle East Mackerel Market Revenue, By Country, 2025– 2032 (USD Million) 95

TABLE NO. 43. : Middle East Mackerel Market Revenue, By Product Form, 2018 – 2024 (USD Million) 96

TABLE NO. 44. : Middle East Mackerel Market Revenue, By Product Form, 2025 – 2032 (USD Million) 96

TABLE NO. 45. : Middle East Mackerel Market Revenue, By Species, 2018 – 2024 (USD Million) 97

TABLE NO. 46. : Middle East Mackerel Market Revenue, By Species, 2025 – 2032 (USD Million) 97

TABLE NO. 47. : Middle East Mackerel Market Revenue, By Distribution Channel, 2018 – 2024 (USD Million) 98

TABLE NO. 48. : Middle East Mackerel Market Revenue, By Distribution Channel, 2025 – 2032 (USD Million) 98

TABLE NO. 49. : Africa Mackerel Market Revenue, By Country, 2018 – 2024 (USD Million) 100

TABLE NO. 50. : Africa Mackerel Market Revenue, By Country, 2025– 2032 (USD Million) 101

TABLE NO. 51. : Africa Mackerel Market Revenue, By Product Form, 2018 – 2024 (USD Million) 102

TABLE NO. 52. : Africa Mackerel Market Revenue, By Product Form, 2025 – 2032 (USD Million) 102

TABLE NO. 53. : Africa Mackerel Market Revenue, By Species, 2018 – 2024 (USD Million) 103

TABLE NO. 54. : Africa Mackerel Market Revenue, By Species, 2025 – 2032 (USD Million) 103

TABLE NO. 55. : Africa Mackerel Market Revenue, By Distribution Channel, 2018 – 2024 (USD Million) 104


TABLE NO. 56. : Africa Mackerel Market Revenue, By Distribution Channel, 2025 – 2032 (USD Million) 104

Request Free Sample

We prioritize the confidentiality and security of your data. Our promise: your information remains private.

Ready to Transform Data into Decisions?

Request Your Sample Report and Start Your Journey of Informed Choices


Providing the strategic compass for industry titans.

cr-clients-logos
What is the market size of the global mackerel market in 2023 and 2032?

The Global Mackerel Market size was valued at USD 1,150.00 million in 2018 and USD 1,328.67 million in 2024. It is projected to reach USD 1,987.36 million by 2032, showing steady expansion across all regions and segments..

What are the key drivers of growth in the mackerel market?

The main drivers include increasing consumer demand for nutritious and sustainable seafood, growing awareness of mackerel’s health benefits, and innovations in aquaculture and fishing technologies.

Which regions are leading in mackerel consumption?

Asia-Pacific, particularly Japan, China, and South Korea, leads mackerel consumption, followed by significant markets in Europe, such as Spain, France, and Norway.

What types of mackerel products are most in demand?

Canned mackerel holds the largest market share, followed by frozen, fresh, and smoked mackerel, driven by convenience, shelf life, and versatility in meal preparation.

Who are the key players in the global mackerel market?

Key players in the market include Thai Union Group, Maruha Nichiro, Dongwon Industries, and ICCT, all of whom are focusing on product innovations, sustainable practices, and strategic partnerships.

About Author

Rajdeep Kumar Deb

Rajdeep Kumar Deb

Lead Analyst – Consumer & Finance

Rajdeep brings a decade of consumer goods and financial services insight to strategic market analysis.

View Profile

Related Reports

Cookware Market

Cookware Market size was valued at USD 32.75 billion in 2024 and is anticipated to reach USD 56.7 billion by 2032, at a CAGR of 7.1% during the forecast period.

Electric Rice Cooker Market

Electric Rice Cooker Market size was valued USD 1406.4 million in 2024 and is anticipated to reach USD 6004.12 million by 2032, at a CAGR of 17.5% during the forecast period.

Food Thermometer Market

The Food Thermometer Market size was valued at USD 154.95 million in 2024 and is anticipated to reach USD 250.72 million by 2032, at a CAGR of 6.2% during the forecast period (2024-2032).

Electric Toothbrush Market

The Electric Toothbrush Market was valued at USD 4,334.5 million in 2024 and is projected to reach USD 7,673.14 million  by 2032, growing at a CAGR of 7.4 % during the forecast period.

Cosmetic Packaging Machinery Market

The Cosmetic Packaging Machinery market size was valued at USD 4,955 million in 2024 and is anticipated to reach USD 8,096.3 million by 2032, growing at a CAGR of 6.33% during the forecast period.

Reusable Water Bottles Market

The Global Reusable Water Bottles Market is projected to grow from USD 8,314.96 million in 2023 to USD 12,625.44 million by 2032, at a compound annual growth rate (CAGR) of 4.75%.

UK Quartz Ceramic Roller Market

The UK Quartz Ceramic Roller Market size was valued at USD 32.72 million in 2018, increased to USD 43.72 million in 2024, and is anticipated to reach USD 73.30 million by 2032, at a CAGR of 6.67% during the forecast period.

Electric Lunch Box Market

The Electric Lunch Box Market was valued at USD 754.5 million in 2024 and is projected to reach USD 1,157.16 million by 2032, registering a CAGR of 6.3 % during the forecast period.

Egg White Powder Market

Egg White Powder Market size was valued at USD 2,074.5 million in 2024 and is anticipated to reach USD 3,407.58 million by 2032, at a CAGR of 6.4% during the forecast period.

Egg Separator Market

Egg Separator Market size was valued at USD 455.8 million in 2024 and is anticipated to reach USD 653.17 million by 2032, at a CAGR of 4.6% during the forecast period.

Egg Protein Powder Market

The global egg protein powder market size was valued at USD 9,104.5 million in 2024 and is anticipated to reach USD 13,349.35 million by 2032, growing at a CAGR of 4.9% during the forecast period.

U.S. Quartz Ceramic Roller Market

The U.S. Quartz Ceramic Roller Market size was valued at USD 261.63 million in 2018, increased to USD 352.67 million in 2024, and is anticipated to reach USD 616.74 million by 2032, at a CAGR of 7.24% during the forecast period.

Licence Option

The report comes as a view-only PDF document, optimized for individual clients. This version is recommended for personal digital use and does not allow printing. Use restricted to one purchaser only.
$4999

To meet the needs of modern corporate teams, our report comes in two formats: a printable PDF and a data-rich Excel sheet. This package is optimized for internal analysis. Unlimited users allowed within one corporate location (e.g., regional office).
$6999

The report will be delivered in printable PDF format along with the report’s data Excel sheet. This license offers 100 Free Analyst hours where the client can utilize Credence Research Inc. research team. Permitted for unlimited global use by all users within the purchasing corporation, such as all employees of a single company.
$12999

Report delivery within 24 to 48 hours

Credence Staff 3

WILLIAM, North America

Support Staff at Credence Research

KEITH PHILLIPS, Europe

Lee - CR Sales Staff

LEE VALLANCE, Asia Pacific

Kieran Jameson

KIERAN JAMESON, Australia

Smallform of Sample request
User Review

Thank you for the data! The numbers are exactly what we asked for and what we need to build our business case.

Materials Scientist
(privacy requested)

User Review

The report was an excellent overview of the Industrial Burners market. This report does a great job of breaking everything down into manageable chunks.

Imre Hof
Management Assistant, Bekaert

cr-clients-logos

Request Sample