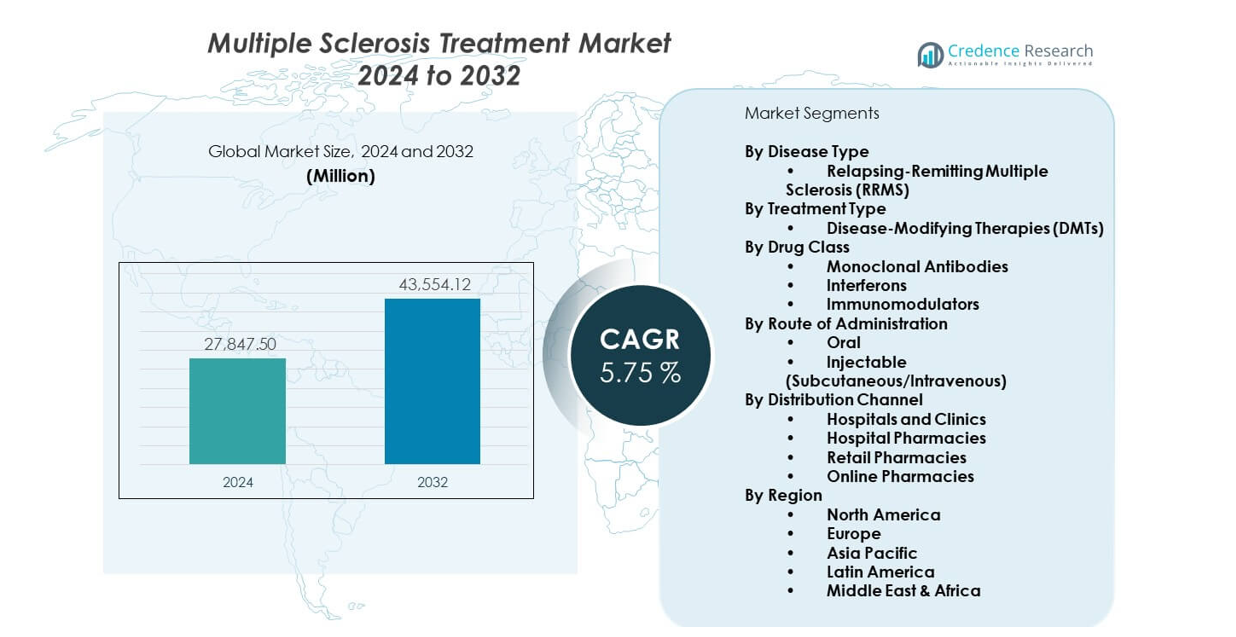
Home » Healthcare » Pharmaceuticals » Multiple Sclerosis Treatment Market

Multiple Sclerosis Treatment Market By Drug Class (Immunomodulators, Immunosuppressants, Interferons, Others) By Route of administration (Oral, Injectables, Infusions) -Growth, Future Prospects & Competitive Analysis, 2016 – 2030

Price: $4999

Published: | Report ID: 20250 | Report Format : PDF

Actionable Insights Delivered – Multiple Sclerosis Treatment Market Size

Positioned with a USD 24.9 Billion valuation in 2022, the Multiple Sclerosis Treatment Market’ asserted its global eminence. Set to scale to USD 32.9 Billion by 2030, the market’s remarkable Compound Annual Growth Rate (CAGR) of 4.1% (2022-2030) underscores its strategic growth trajectory.

Key Highlights of the Report

The global multiple sclerosis treatment market is segmented by drug class, route of administration, distribution channel, and region. Interferons are widely used. In contrast, injectables are a widely utilized segment. North America is leading the market growth.

The market for Multiple Sclerosis (MS) treatments is driven by the rising incidence of MS worldwide, which increases demand for efficient treatment options, and the development of novel therapies for managing the disease due to advancements in medical research and technology. One barrier to the market for MS treatments is the hefty price tag attached to these cutting-edge medications, which may make them less accessible and affordable for some patients and result in possible inequities in access to care.

Nonetheless, the global multiple sclerosis treatment market is the growing pipeline of novel treatments and cutting-edge treatment alternatives, which could lead to breakthroughs in disease management and better patient outcomes, presenting two prospects for the Multiple Sclerosis (MS) treatment industry. Additionally, the increased attention paid to precision therapeutics and personalized medicine offers a chance for customized treatment plans based on unique patient features, perhaps improving treatment effectiveness, and minimizing adverse effects.

What Are The Main Drivers Of The Global Multiple Sclerosis Treatment Market?

A prominent market driver is the global increase in MS incidence and prevalence. There is an increasing need for efficient management alternatives for MS as more people are diagnosed with the condition.

What Are The Major Challenges Faced By The Global Multiple Sclerosis Treatment Market?

Long-term therapy with pricey drugs is sometimes required for MS treatment, placing a huge financial strain on patients and healthcare systems. Accessibility and price issues with MS medications may arise, particularly in areas with limited access to healthcare.

What Are The Growth Opportunities In The Global Multiple Sclerosis Treatment Market?

Innovative treatments that can successfully treat MS and enhance patient outcomes must continue to be developed. The market can increase by investing in R&D to find new treatments or enhance those already available.

Executive Summary

Overview of the Global Multiple Sclerosis Treatment Market

The prevalence of MS is rising, therapy options are improving, and public knowledge of the disease is all contributing to the continuous rise of the global market for MS treatments. New medicines being developed and a growing list of prospective remedies define the market. However, difficulties include exorbitant treatment costs, unfavourable side effects, and low efficacy in MS with progressive forms. Despite these obstacles, there is market expansion potential, such as the creation of precision medicines and personalized medicine, as well as the penetration of emerging markets. The industry is anticipated to grow more over the next few years.

Design Element 2

Access crucial information at unmatched prices!

Request your free sample report today & start making informed decisions powered by Credence Research!

Download Free Sample
CTA Design Element 3

Market Definition

Treatments for multiple sclerosis (MS) include a variety of measures designed to control symptoms and limit the disease’s progression. Disease-modifying treatments (DMTs) focus on the immune system to lower relapse rates and the buildup of disabilities. Symptomatic treatments target symptoms like weariness, cognitive decline, and muscle spasms. Through methods like physical and occupational therapy, rehabilitation therapies focus on regaining physical function and mobility. Supportive therapies give self-care strategies, psychotherapy, and psychological assistance to manage emotional difficulties. For the best management of MS and to raise the standard of living for those with the condition, a thorough individualized treatment plan is essential.

Multiple Sclerosis Treatment Market

Market Insights

  • The global demand for multiple sclerosis treatment was valued at USD 24.9 Billion in 2022 and is expected to reach USD 32.9 Billion in 2030, growing at a CAGR of 4.1% between 2023 and 2030.
  • Interferons are the market leader in material and will hold over 45% of the market’s value in 2022. Meanwhile, the immunosuppressants are anticipated to show the quickest CAGR over the forecast period.
  • The injectables segment governs the global demand for multiple sclerosis treatment, holding a massive share of over 30% in 2022, and is expected to grow at a rapid CAGR.
  • Hospital pharmacy is the most widely used material market leader, holding over 35% of the market’s value in 2022, while retail pharmacy is anticipated to show the quickest CAGR over the forecast period.
  • North America fueled the growth of the multiple sclerosis treatment industry with over one-third share in 2022. Asia Pacific and Europe collectively account for just under 40% share in 2022, with Europe holding over 22% share in the same year.
  • Due to variables like a high prevalence of MS, the availability of cutting-edge healthcare infrastructure, and large investments in research and development, North America currently dominates the global market for multiple sclerosis treatments.
  • The growing use of disease-modifying therapies (DMTs), which have successfully lowered relapse rates and disease progression, boosts the global market for multiple sclerosis treatments. However, a significant barrier to market growth is the high cost of these DMTs, which can restrict patient accessibility and affordability, particularly in areas with limited healthcare resources.

Segmentation by Drug Class

  • Interferons are the leading segment by drug class and held over 45% share in value in 2022.
  • The immunosuppressants segment will likely exhibit the fastest CAGR during the forecast period.

Segmentation by Route of Administration

  • The injectables segment governs the demand for multiple sclerosis treatment globally, holding a massive share of over 30% in 2022, and is also expected to grow at a rapid CAGR.
  • The oral segment contributes to the rest of the demand for multiple sclerosis treatments.

Segmentation by Distribution channel

  • Hospital pharmacy govern the demand for multiple sclerosis treatment globally, holding a massive share of over 30% in 2022, and are also expected to grow at a rapid CAGR.
  • The retail pharmacy segment contributes to the rest of the demand for multiple sclerosis treatment.

Segmentation by Region

  • North America fueled the growth of the multiple sclerosis treatment industry with over one-third share in 2022.
  • Asia Pacific and Europe collectively account for just under 40% share in 2022, with Europe holding over 22% share in the same year.
  • The rest of the World, including Latin America, The Middle East, and Africa, contributes the remainder to the demand for multiple sclerosis treatment.

The rising prevalence of multiple sclerosis globally, fueling an increase in demand for efficient treatment alternatives, is one of the factors driving the global market for multiple sclerosis treatments. As the number of people with multiple sclerosis increases, there is a corresponding demand for medicines that can aid in disease management, fuel research, and development initiatives, and spur market expansion.

Due to several circumstances, the multiple sclerosis therapy market is very active in the United States. The nation’s strong medical infrastructure and well-developed healthcare system enable prompt diagnosis and access to various treatment alternatives. The market is defined by the accessibility of different disease-modifying treatments (DMTs), such as oral medicines, injectables, and infusions, giving doctors and patients options depending on specific requirements and preferences. Additionally, there is a high focus on research and development, which results in the launch of novel therapeutics and clinical trials and furthers the market’s use and development.

Additionally, Germany exhibits strong market penetration for MS therapies. The nation has an extensive healthcare system that places a strong emphasis on access to services. German doctors have access to various disease-modifying treatments (DMTs) licensed for treating multiple sclerosis, strongly emphasizing evidence-based medicine. The market is tightly controlled, ensuring that pharmaceuticals are accessible and affordable. Additionally, Germany promotes patient education and self-management, encouraging active participation in medical decision-making. This holistic approach, along with an emphasis on research and improvements, helps Germany’s multiple sclerosis therapy industry to be used to its full potential.

Increasing Prevalence of Multiple Sclerosis

The disease’s rising prevalence significantly drives the global market for MS treatments. MS is a long-term autoimmune condition that damages the central nervous system and causes various cognitive and physical symptoms. In recent years, MS prevalence has been progressively increasing, with areas with moderate temperatures experiencing a higher frequency. Numerous causes, including improved diagnostic methods, increased public knowledge of the disease, and a rising worldwide population, are to blame for this prevalence.

The demand for efficient treatment alternatives closely correlates with the rising MS prevalence. The market for MS treatments is expanding as more people are diagnosed with MS, and healthcare systems and providers are forced to meet their requirements. Pharmaceutical companies are investing in research and development to find novel medications that can better manage the condition and enhance patient outcomes. To investigate novel therapeutic modalities and expand our understanding of MS, this driver also promotes collaborations across academic, commercial, and healthcare institutions.

Advancements in Therapeutic Options

The ongoing improvements in therapy choices are a global market driver for MS treatments. Understanding the fundamental causes of MS and creating tailored treatments have advanced significantly over time. This led to the creation of disease-modifying treatments (DMTs), which aim to alter the immune response, lower the rate of relapses, halt the progression of the disease, and enhance the quality of life for MS patients.

The development of numerous DMT forms, including oral medicines, injectables, and infusions, each with a unique mechanism of action and efficacy profile, is one example of how treatment alternatives have improved. These alternatives give doctors and patients options to customize treatment based on personal preferences, the severity of the condition, and probable side effects. Multiple therapy alternatives allow the development of individualized treatment plans and improve patient results.

Furthermore, ongoing research and technological improvements have made therapy choices more advanced. This covers the investigation of novel therapeutic targets, the use of precision medicine techniques, and the use of biomarkers to predict therapy response and disease progression. By presenting fresh opportunities for therapeutic intervention and enhancing the overall management of the condition, these developments fuel the expansion of the MS treatment industry.

High Cost Of MS Drugs

The high cost of MS drugs is one barrier to the worldwide multiple sclerosis treatment market. There is a huge financial burden on individuals and healthcare systems because many disease-modifying treatments (DMTs) are expensive and utilized to treat MS.

For individuals without adequate insurance coverage or those living in areas with scarce healthcare resources, the high cost of these medications may provide obstacles to access and affordability. As a result, certain patients can have trouble getting the required treatments, resulting in healthcare disparities and possibly impeding the best illness management. To guarantee that everyone has access to efficient MS treatments and to enhance patient outcomes, the issue of high treatment costs must be addressed.

Development of Novel Therapies

Creating cutting-edge therapeutics represents a sizable opportunity in the global multiple sclerosis (MS) treatment market. The ongoing improvements in medical research and understanding of the illness provide the opportunity for novel treatment approaches. To increase the effectiveness and safety of MS treatments, researchers are looking into new therapeutic targets, routes, and drug delivery techniques.

These cutting-edge treatments seek to address the underlying causes of MS, enhance disease management, and maybe bring further advantages, including increased quality of life and fewer side effects. The therapy options available to MS patients can be greatly improved by investing in research and development projects to find and create these breakthrough therapies, boosting the market and enhancing patient results.

Personalized Medicine and Precision Therapies

The increased emphasis on personalized and precision medicine presents another attractive prospect in the MS therapy sector. Since every MS patient has a different experience, it is understood that each patient will benefit from individualized treatment plans. To find the best treatment plans for each patient, personalized medicine considers elements including genetic profiles, biomarkers, and disease subtypes. To improve treatment outcomes and reduce side effects, precision medicines tailor treatments based on these unique individual traits.

Technologies including genetics, proteomics, and imaging methods have advanced, opening up new possibilities for individualized treatment of MS. Biomarkers can be used to forecast the course of a disease, the effectiveness of a treatment, and the subgroups of patients who may respond best to a certain therapy. These findings can be used to tailor treatments, improving efficacy and decreasing side occurrences.

Optimized patient care may be possible with the development and application of precision therapeutics and customized medicine in the MS treatment industry. Healthcare professionals can increase treatment efficacy, enhance patient outcomes, and potentially lessen the overall burden of disease by recognizing specific patient features and adapting treatment procedures accordingly. Patients gain from this chance, creating new opportunities for research, partnerships, and developments in the MS treatment industry.

Competitive Landscape

Key Players

The global multiple sclerosis treatment market is highly competitive, with several key players. Some of the major players in the market and their market share are as follows:

Several pharmaceutical companies, both well-established businesses and up-and-coming biotechnology companies, compete to develop and market disease-modifying treatments (DMTs) in the multiple sclerosis therapy market. To increase market share and offer patients cutting-edge treatment alternatives, these businesses concentrate on research and development projects, clinical trials, strategic partnerships, and marketing strategies.

Summary of Key Findings

  • Interferons are the material market leader and will account for over 45% of industry revenue in 2022. However, immunosuppressants are predicted to exhibit the fastest CAGR during the projection period.
  • With a significant market share of over 30% in 2022 and projections of high CAGR growth, the injectables sector will likely dominate the global demand for multiple sclerosis treatment.
  • Hospital pharmacies dominate the most frequently used materials market, accounting for almost 35% of its value in 2022. Retail pharmacies are expected to grow fastest during the projection period.
  • In 2022, North America accounted for nearly one-third of global market growth for treatments for multiple sclerosis. In 2022, Asia Pacific and Europe will account for slightly less than 40% of the market, with Europe owning more than 22%.

Shape Your Report to Specific Countries or Regions & Enjoy 30% Off!

Future Outlook

  • The market for treatments for multiple sclerosis has bright prospects in the future.
  • The development of more specialized and efficient treatments is anticipated to be fueled by developments in medical research, particularly in the knowledge of the underlying mechanisms of the disease. Precision therapies and biomarker-guided treatments are two personalized medicine strategies with considerable potential to improve patient outcomes.
  • Further development is also possible thanks to continuing studies into fresh therapeutic targets and the investigation of cutting-edge medication delivery strategies.
  • The industry is anticipated to have continued expansion and innovation in the coming years due to a growing emphasis on patient-centric treatment and the rising prevalence of multiple sclerosis.

Segmentation

  • By Drug Class
    • Immunomodulators
    • Immunosuppressants
    • Interferons
    • Others
  • By Route of administration
    • Oral
    • Injectables
    • Infusions
  • By Distribution channel
    • Hospital Pharmacy
    • Retail Pharmacy
    • Online Stores
  • By Region
  • North America
    • Canada
    • Mexico
  • Europe
    • Germany
    • France
    • K.
    • Italy
    • Spain
    • Rest of Europe
  • Asia Pacific
    • China
    • Japan
    • India
    • South Korea
    • South-east Asia
    • Rest of Asia Pacific
  • Latin America
    • Brazil
    • Argentina
    • Rest of Latin America
  • Middle East & Africa
    • GCC Countries
    • South Africa
    • Rest of Middle East and Africa

1. Preface
1.1. Report Description
1.1.1. Purpose of the Report
1.1.2. Target Audience
1.1.3. USP and Key Offerings
1.2. Research Scope
1.3. Research Methodology
1.3.1. Interferons – Secondary Research
1.3.2. Others – Data Modelling
1.3.2.1. Company Share Analysis Model
1.3.2.2. Revenue Based Modelling
1.3.3. Tires – Primary Research
1.3.4. Research Limitations
1.3.5. Assumptions
1.4. Market Introduction
1.5. Market Research Scope

2. Executive Summary
2.1. Market Snapshot: Global Multiple Sclerosis Treatment Market
2.2. Global Multiple Sclerosis Treatment Market, By Drug Class
2.3. Global Multiple Sclerosis Treatment Market, By Route of Administration
2.4. Global Multiple Sclerosis Treatment Market, By Distribution Channel
2.5. Global Multiple Sclerosis Treatment Market, By Region

3. Market Dynamics & Factors Analysis
3.1. Introduction
3.1.1. Global Multiple Sclerosis Treatment Market Value, 2017-2030, (US$ Bn)
3.1.2. Y-o-Y Growth Trend Analysis
3.2. Market Dynamics
3.2.1. Market Drivers
3.2.2. Market Restraints
3.2.3. Market Opportunities
3.2.4. Major Industry Challenges
3.3. Growth and Development Patterns
3.4. Investment Feasibility Analysis
3.5. Market Opportunity Analysis
3.5.1. Drug Class
3.5.2. Route of Administration
3.5.3. Distribution Channel
3.5.4. Geography

4. Premium Insights
4.1. STAR (Situation, Task, Action, Results) Analysis
4.2. Porter’s Five Forces Analysis
4.2.1. Threat of New Entrants
4.2.2. Bargaining Power of Buyers/Consumers
4.2.3. Bargaining Power of Suppliers
4.2.4. Threat of Substitute
4.2.5. Intensity of Competitive Rivalry
4.3. Key Market Trends
4.3.1. Demand Side Trends
4.3.2. Supply Side Trends
4.4. Value Chain Analysis
4.5. Drug Class Analysis
4.6. Analysis and Recommendations
4.7. Marketing Strategy Analysis
4.7.1. Direct Marketing
4.7.2. Indirect Marketing
4.7.3. Marketing Channel Development Trend

5. Market Positioning of Key Players, 2022
5.1. Company market share of key players, 2022
5.2. Competitive Benchmarking
5.3. Market Positioning of Key Vendors
5.4. Geographical Presence Analysis
5.5. Major Strategies Adopted by Key Players
5.5.1. Key Strategies Analysis
5.5.2. Mergers and Acquisitions
5.5.3. Partnerships
5.5.4. Product Launch
5.5.5. Geographical Expansion
5.5.6. Tires Shops

6. Economic Impact Analysis
6.1. Recession Impact
6.1.1. North America
6.1.2. Europe
6.1.3. Asia Pacific
6.1.4. Latin America
6.1.5. Middle East and Africa
6.2. Ukraine-Russia War Impact
6.2.1. North America
6.2.2. Europe
6.2.3. Asia Pacific
6.2.4. Latin America
6.2.5. Middle East and Africa
6.3. COVID-19 Impact Analysis
6.3.1. North America
6.3.2. Europe
6.3.3. Asia Pacific
6.3.4. Latin America
6.3.5. Middle East and Africa

7. Global Multiple Sclerosis Treatment Market, By Drug Class
7.1. Global Multiple Sclerosis Treatment Market Overview, by Drug Class
7.1.1. Global Multiple Sclerosis Treatment Market Revenue Share, By Drug Class, 2022 Vs 2030 (in %)
7.2. Immunomodulators
7.2.1. Global Multiple Sclerosis Treatment Market, By Region, 2017-2030 (US$ Bn)
7.3. Immunosuppressants
7.3.1. Global Multiple Sclerosis Treatment Market, By Region, 2017-2030 (US$ Bn)
7.4. Interferons
7.4.1. Global Multiple Sclerosis Treatment Market, By Region, 2017-2030 (US$ Bn)
7.5. Others
7.5.1. Global Multiple Sclerosis Treatment Market, By Region, 2017-2030 (US$ Bn)

8. Global Multiple Sclerosis Treatment Market, By Route of Administration
8.1. Global Multiple Sclerosis Treatment Market Overview, by Route of Administration
8.1.1. Global Multiple Sclerosis Treatment Market, By Route of Administration, 2022 vs 2030 (in %)
8.2. Oral
8.2.1. Global Multiple Sclerosis Treatment Market, By Region, 2017-2030 (US$ Bn)
8.3. Injectables
8.3.1. Global Multiple Sclerosis Treatment Market, By Region, 2017-2030 (US$ Bn)
8.4. Infusions
8.4.1. Global Multiple Sclerosis Treatment Market, By Region, 2017-2030 (US$ Bn)

9. Global Multiple Sclerosis Treatment Market, by Distribution Channel, 2017-2030 (US$ Bn)
9.1. Global Multiple Sclerosis Treatment Market Overview, by Distribution Channel
9.1.1. Global Multiple Sclerosis Treatment Market, By Distribution Channel, 2022 vs 2030 (in%)
9.2. Hospital Pharmacy
9.2.1. Global Multiple Sclerosis Treatment Market, By Region, 2017-2030 (US$ Bn)
9.3. Retail Pharmacy
9.3.1. Global Multiple Sclerosis Treatment Market, By Region, 2017-2030 (US$ Bn)
9.4. Online Stores
9.4.1. Global Multiple Sclerosis Treatment Market, By Region, 2017-2030 (US$ Bn)

10. Global Multiple Sclerosis Treatment Market, By Region
10.1. Global Multiple Sclerosis Treatment Market Overview, by Region
10.1.1. Global Multiple Sclerosis Treatment Market, By Region, 2022 vs 2030 (in%)
10.2. Drug Class
10.2.1. Global Multiple Sclerosis Treatment Market, By Drug Class, 2017-2030 (US$ Bn)
10.3. Route of Administration
10.3.1. Global Multiple Sclerosis Treatment Market, By Route of Administration, 2017-2030 (US$ Bn)
10.4. Distribution Channel
10.4.1. Global Multiple Sclerosis Treatment Market, By Distribution Channel, 2017-2030 (US$ Bn)

11. North America Multiple Sclerosis Treatment Market Analysis
11.1. North America Multiple Sclerosis Treatment Market, by Drug Class, 2017-2030(US$ Bn)
11.1.1. Overview
11.1.2. SRC Analysis
11.2. North America Multiple Sclerosis Treatment Market, by Route of Administration, 2017-2030(US$ Bn)
11.2.1. Overview
11.2.2. SRC Analysis
11.3. North America Multiple Sclerosis Treatment Market, by Distribution Channel, 2017-2030(US$ Bn)
11.3.1. Overview
11.3.2. SRC Analysis
11.4. North America Multiple Sclerosis Treatment Market, by Country, 2017-2030 (US$ Bn)
11.4.1. North America Multiple Sclerosis Treatment Market, by Country, 2022 Vs 2030 (in%)
11.4.2. U.S.
11.4.2.1. U.S. Multiple Sclerosis Treatment Market Estimates and Forecast, 2017-2030 (US$ Bn)
11.4.2.2. U.S. Multiple Sclerosis Treatment, By Drug Class, 2017-2030 (US$ Bn)
11.4.2.3. U.S. Multiple Sclerosis Treatment, By Route of Administration, 2017-2030 (US$ Bn)
11.4.2.4. U.S. Multiple Sclerosis Treatment, By Distribution Channel, 2017-2030 (US$ Bn)
11.4.3. Canada
11.4.3.1. Canada Multiple Sclerosis Treatment Market Estimates and Forecast, 2017-2030 (US$ Bn)
11.4.3.2. Canada Multiple Sclerosis Treatment, By Drug Class, 2017-2030 (US$ Bn)
11.4.3.3. Canada Multiple Sclerosis Treatment, By Route of Administration, 2017-2030 (US$ Bn)
11.4.3.4. Canada Multiple Sclerosis Treatment, By Distribution Channel, 2017-2030 (US$ Bn)
11.4.4. Mexico
11.4.4.1. Mexico Multiple Sclerosis Treatment Market Estimates and Forecast, 2017-2030 (US$ Bn)
11.4.4.2. Mexico Multiple Sclerosis Treatment, By Drug Class, 2017-2030 (US$ Bn)
11.4.4.3. Mexico Multiple Sclerosis Treatment, By Route of Administration, 2017-2030 (US$ Bn)
11.4.4.4. Mexico Multiple Sclerosis Treatment, By Distribution Channel, 2017-2030 (US$ Bn)

12. Europe Multiple Sclerosis Treatment Market Analysis
12.1. Europe Multiple Sclerosis Treatment Market, by Drug Class, 2017-2030(US$ Bn)
12.1.1. Overview
12.1.2. SRC Analysis
12.2. Europe Multiple Sclerosis Treatment Market, by Route of Administration, 2017-2030(US$ Bn)
12.2.1. Overview
12.2.2. SRC Analysis
12.3. Europe Multiple Sclerosis Treatment Market, by Distribution Channel, 2017-2030(US$ Bn)
12.3.1. Overview
12.3.2. SRC Analysis
12.4. Europe Multiple Sclerosis Treatment Market, by Country, 2017-2030 (US$ Bn)
12.4.1. Europe Multiple Sclerosis Treatment Market, by Country, 2022 Vs 2030 (in%)
12.4.2. Germany
12.4.2.1. Germany Multiple Sclerosis Treatment Market Estimates and Forecast, 2017-2030 (US$ Bn)
12.4.2.2. Germany Multiple Sclerosis Treatment, By Drug Class, 2017-2030 (US$ Bn)
12.4.2.3. Germany Multiple Sclerosis Treatment, By Route of Administration, 2017-2030 (US$ Bn)
12.4.2.4. Germany Multiple Sclerosis Treatment, By Distribution Channel, 2017-2030 (US$ Bn)
12.4.3. France
12.4.3.1. France Multiple Sclerosis Treatment Market Estimates and Forecast, 2017-2030 (US$ Bn)
12.4.3.2. France Multiple Sclerosis Treatment, By Drug Class, 2017-2030 (US$ Bn)
12.4.3.3. France Multiple Sclerosis Treatment, By Route of Administration, 2017-2030 (US$ Bn)
12.4.3.4. France Multiple Sclerosis Treatment, By Distribution Channel, 2017-2030 (US$ Bn)
12.4.4. UK
12.4.4.1. UK Multiple Sclerosis Treatment Market Estimates and Forecast, 2017-2030 (US$ Bn)
12.4.4.2. UK Multiple Sclerosis Treatment, By Drug Class, 2017-2030 (US$ Bn)
12.4.4.3. UK Multiple Sclerosis Treatment, By Route of Administration, 2017-2030 (US$ Bn)
12.4.4.4. UK Multiple Sclerosis Treatment, By Distribution Channel, 2017-2030 (US$ Bn)
12.4.5. Italy
12.4.5.1. Italy Multiple Sclerosis Treatment Market Estimates and Forecast, 2017-2030 (US$ Bn)
12.4.5.2. Italy Multiple Sclerosis Treatment, By Drug Class, 2017-2030 (US$ Bn)
12.4.5.3. Italy Multiple Sclerosis Treatment, By Route of Administration, 2017-2030 (US$ Bn)
12.4.5.4. Italy Multiple Sclerosis Treatment, By Distribution Channel, 2017-2030 (US$ Bn)
12.4.6. Spain
12.4.6.1. Spain Multiple Sclerosis Treatment Market Estimates and Forecast, 2017-2030 (US$ Bn)
12.4.6.2. Spain Multiple Sclerosis Treatment, By Drug Class, 2017-2030 (US$ Bn)
12.4.6.3. Spain Multiple Sclerosis Treatment, By Route of Administration, 2017-2030 (US$ Bn)
12.4.6.4. Spain Multiple Sclerosis Treatment, By Distribution Channel, 2017-2030 (US$ Bn)
12.4.7. Rest of Europe
12.4.7.1. Rest of Europe Multiple Sclerosis Treatment Market Estimates and Forecast, 2017-2030 (US$ Bn)
12.4.7.2. Rest of Europe Multiple Sclerosis Treatment, By Drug Class, 2017-2030 (US$ Bn)
12.4.7.3. Rest of Europe Multiple Sclerosis Treatment, By Route of Administration, 2017-2030 (US$ Bn)
12.4.7.4. Rest of Europe Multiple Sclerosis Treatment, By Distribution Channel, 2017-2030 (US$ Bn)

13. Asia Pacific Multiple Sclerosis Treatment Market Analysis
13.1. Asia Pacific Multiple Sclerosis Treatment Market, by Drug Class, 2017-2030(US$ Bn)
13.1.1. Overview
13.1.2. SRC Analysis
13.2. Asia Pacific Multiple Sclerosis Treatment Market, by Route of Administration, 2017-2030(US$ Bn)
13.2.1. Overview
13.2.2. SRC Analysis
13.3. Asia Pacific Multiple Sclerosis Treatment Market, by Distribution Channel, 2017-2030(US$ Bn)
13.3.1. Overview
13.3.2. SRC Analysis
13.4. Asia Pacific Multiple Sclerosis Treatment Market, by Country, 2017-2030 (US$ Bn)
13.4.1. Asia Pacific Multiple Sclerosis Treatment Market, by Country, 2022 Vs 2030 (in%)
13.4.2. China
13.4.2.1. China Multiple Sclerosis Treatment Market Estimates and Forecast, 2017-2030 (US$ Bn)
13.4.2.2. China Multiple Sclerosis Treatment, By Drug Class, 2017-2030 (US$ Bn)
13.4.2.3. China Multiple Sclerosis Treatment, By Route of Administration, 2017-2030 (US$ Bn)
13.4.2.4. China Multiple Sclerosis Treatment, By Distribution Channel, 2017-2030 (US$ Bn)
13.4.3. Japan
13.4.3.1. Japan Multiple Sclerosis Treatment Market Estimates and Forecast, 2017-2030 (US$ Bn)
13.4.3.2. Japan Multiple Sclerosis Treatment, By Drug Class, 2017-2030 (US$ Bn)
13.4.3.3. Japan Multiple Sclerosis Treatment, By Route of Administration, 2017-2030 (US$ Bn)
13.4.3.4. Japan Multiple Sclerosis Treatment, By Distribution Channel, 2017-2030 (US$ Bn)
13.4.4. India
13.4.4.1. India Multiple Sclerosis Treatment Market Estimates and Forecast, 2017-2030 (US$ Bn)
13.4.4.2. India Multiple Sclerosis Treatment, By Drug Class, 2017-2030 (US$ Bn)
13.4.4.3. India Multiple Sclerosis Treatment, By Route of Administration, 2017-2030 (US$ Bn)
13.4.4.4. India Multiple Sclerosis Treatment, By Distribution Channel, 2017-2030 (US$ Bn)
13.4.5. South Korea
13.4.5.1. South Korea Multiple Sclerosis Treatment Market Estimates and Forecast, 2017-2030 (US$ Bn)
13.4.5.2. South Korea Multiple Sclerosis Treatment, By Drug Class, 2017-2030 (US$ Bn)
13.4.5.3. South Korea Multiple Sclerosis Treatment, By Route of Administration, 2017-2030 (US$ Bn)
13.4.5.4. South Korea Multiple Sclerosis Treatment, By Distribution Channel, 2017-2030 (US$ Bn)
13.4.6. South-East Asia
13.4.6.1. South-East Asia Multiple Sclerosis Treatment Market Estimates and Forecast, 2017-2030 (US$ Bn)
13.4.6.2. South-East Asia Multiple Sclerosis Treatment, By Drug Class, 2017-2030 (US$ Bn)
13.4.6.3. South-East Asia Multiple Sclerosis Treatment, By Route of Administration, 2017-2030 (US$ Bn)
13.4.6.4. South-East Asia Multiple Sclerosis Treatment, By Distribution Channel, 2017-2030 (US$ Bn)
13.4.7. Rest of Asia Pacific
13.4.7.1. Rest of Asia Pacific Multiple Sclerosis Treatment Market Estimates and Forecast, 2017-2030 (US$ Bn)
13.4.7.2. Rest of Asia Pacific Multiple Sclerosis Treatment, By Drug Class, 2017-2030 (US$ Bn)
13.4.7.3. Rest of Asia Pacific Multiple Sclerosis Treatment, By Route of Administration, 2017-2030 (US$ Bn)
13.4.7.4. Rest of Asia Pacific Multiple Sclerosis Treatment, By Distribution Channel, 2017-2030 (US$ Bn)

14. Latin America Multiple Sclerosis Treatment Market Analysis
14.1. Latin America Multiple Sclerosis Treatment Market, by Drug Class, 2017-2030(US$ Bn)
14.1.1. Overview
14.1.2. SRC Analysis
14.2. Latin America Multiple Sclerosis Treatment Market, by Route of Administration, 2017-2030(US$ Bn)
14.2.1. Overview
14.2.2. SRC Analysis
14.3. Latin America Multiple Sclerosis Treatment Market, by Distribution Channel, 2017-2030(US$ Bn)
14.3.1. Overview
14.3.2. SRC Analysis
14.4. Latin America Multiple Sclerosis Treatment Market, by Country, 2017-2030 (US$ Bn)
14.4.1. Latin America Multiple Sclerosis Treatment Market, by Country, 2022 Vs 2030 (in%)
14.4.2. Brazil
14.4.2.1. Brazil Multiple Sclerosis Treatment Market Estimates and Forecast, 2017-2030 (US$ Bn)
14.4.2.2. Brazil Multiple Sclerosis Treatment, By Drug Class, 2017-2030 (US$ Bn)
14.4.2.3. Brazil Multiple Sclerosis Treatment, By Route of Administration, 2017-2030 (US$ Bn)
14.4.2.4. Brazil Multiple Sclerosis Treatment, By Distribution Channel, 2017-2030 (US$ Bn)
14.4.3. Argentina
14.4.3.1. Argentina Multiple Sclerosis Treatment Market Estimates and Forecast, 2017-2030 (US$ Bn)
14.4.3.2. Argentina Multiple Sclerosis Treatment, By Drug Class, 2017-2030 (US$ Bn)
14.4.3.3. Argentina Multiple Sclerosis Treatment, By Route of Administration, 2017-2030 (US$ Bn)
14.4.3.4. Argentina Multiple Sclerosis Treatment, By Distribution Channel, 2017-2030 (US$ Bn)
14.4.4. Rest of Latin America
14.4.4.1. Rest of Latin America Multiple Sclerosis Treatment Market Estimates and Forecast, 2017-2030 (US$ Bn)
14.4.4.2. Rest of Latin America Multiple Sclerosis Treatment, By Drug Class, 2017-2030 (US$ Bn)
14.4.4.3. Rest of Latin America Multiple Sclerosis Treatment, By Route of Administration, 2017-2030 (US$ Bn)
14.4.4.4. Rest of Latin America Multiple Sclerosis Treatment, By Distribution Channel, 2017-2030 (US$ Bn)

15. Middle East and Africa Multiple Sclerosis Treatment Market Analysis
15.1. Middle East and Africa Multiple Sclerosis Treatment Market, by Drug Class, 2017-2030(US$ Bn)
15.1.1. Overview
15.1.2. SRC Analysis
15.2. Middle East and Africa Multiple Sclerosis Treatment Market, by Route of Administration, 2017-2030(US$ Bn)
15.2.1. Overview
15.2.2. SRC Analysis
15.3. Middle East and Africa Multiple Sclerosis Treatment Market, by Distribution Channel, 2017-2030(US$ Bn)
15.3.1. Overview
15.3.2. SRC Analysis
15.4. Middle East and Africa Multiple Sclerosis Treatment Market, by Country, 2017-2030 (US$ Bn)
15.4.1. Middle East and Africa Multiple Sclerosis Treatment Market, by Country, 2022 Vs 2030 (in%)
15.4.2. GCC Countries
15.4.2.1. GCC Countries Multiple Sclerosis Treatment Market Estimates and Forecast, 2017-2030 (US$ Bn)
15.4.2.2. GCC Countries Multiple Sclerosis Treatment, By Drug Class, 2017-2030 (US$ Bn)
15.4.2.3. GCC Countries Multiple Sclerosis Treatment, By Route of Administration, 2017-2030 (US$ Bn)
15.4.2.4. GCC Countries Multiple Sclerosis Treatment, By Distribution Channel, 2017-2030 (US$ Bn)
15.4.3. South Africa
15.4.3.1. South Africa Multiple Sclerosis Treatment Market Estimates and Forecast, 2017-2030 (US$ Bn)
15.4.3.2. South Africa Multiple Sclerosis Treatment, By Drug Class, 2017-2030 (US$ Bn)
15.4.3.3. South Africa Multiple Sclerosis Treatment, By Route of Administration, 2017-2030 (US$ Bn)
15.4.3.4. South Africa Multiple Sclerosis Treatment, By Distribution Channel, 2017-2030 (US$ Bn)
15.4.4. Rest of Middle East and Africa
15.4.4.1. Rest of Middle East and Africa Multiple Sclerosis Treatment Market Estimates and Forecast, 2017-2030 (US$ Bn)
15.4.4.2. Rest of Middle East and Africa Multiple Sclerosis Treatment, By Drug Class, 2017-2030 (US$ Bn)
15.4.4.3. Rest of Middle East and Africa Multiple Sclerosis Treatment, By Route of Administration, 2017-2030 (US$ Bn)
15.4.4.4. Rest of Middle East and Africa Multiple Sclerosis Treatment, By Distribution Channel, 2017-2030 (US$ Bn)

16. Company Profiles
16.1. Pfizer
16.1.1. Company Overview
16.1.2. Products/Services Portfolio
16.1.3. Geographical Presence
16.1.4. Financial Summary
16.1.4.1. Market Revenue and Net Profit (2019-2022)
16.1.4.2. Business Segment Revenue Analysis
16.1.4.3. Geographical Revenue Analysis
16.2. Bayer AG
16.3. Teva Pharmaceutical Industries Ltd
16.4. Novartis AG
16.5. Sanofi
16.6. F. Hoffmann-La Roche Ltd
16.7. Celgene Corporation
16.8. Acorda Therapeutics, Inc
16.9. Biogen, Inc
16.10. Johnson & Johnson
16.11. EMD Serono
16.12. Eisai Co., Ltd.
16.13. Apitope
16.14. AbbVie, Inc.


List of Figures
FIG. 1 Global Multiple Sclerosis Treatment Market: Research Methodology
FIG. 2 Market Size Estimation – Top Down & Bottom up Approach
FIG. 3 Global Multiple Sclerosis Treatment Market Segmentation
FIG. 4 Global Multiple Sclerosis Treatment Market, by Drug Class, 2022 (US$ Bn)
FIG. 5 Global Multiple Sclerosis Treatment Market, by Route of Administration, 2022 (US$ Bn)
FIG. 6 Global Multiple Sclerosis Treatment Market, by Distribution Channel, 2022 (US$ Bn)
FIG. 7 Global Multiple Sclerosis Treatment Market, by Geography, 2022 (US$ Bn)
FIG. 8 Attractive Investment Proposition, by Drug Class, 2022
FIG. 9 Attractive Investment Proposition, by Route of Administration, 2022
FIG. 10 Attractive Investment Proposition, by Distribution Channel, 2022
FIG. 11 Attractive Investment Proposition, by Geography, 2022
FIG. 12 Global Market Share Analysis of Key Multiple Sclerosis Treatment Market Manufacturers, 2022
FIG. 13 Global Market Positioning of Key Multiple Sclerosis Treatment Market Manufacturers, 2022
FIG. 14 Global Multiple Sclerosis Treatment Market Value Contribution, By Drug Class, 2022 & 2030 (Value %)
FIG. 15 Global Multiple Sclerosis Treatment Market, by Immunomodulators, Value, 2017-2030 (US$ Bn)
FIG. 16 Global Multiple Sclerosis Treatment Market, by Immunosuppressants, Value, 2017-2030 (US$ Bn)
FIG. 17 Global Multiple Sclerosis Treatment Market, by Interferons, Value, 2017-2030 (US$ Bn)
FIG. 18 Global Multiple Sclerosis Treatment Market, by Others, Value, 2017-2030 (US$ Bn)
FIG. 19 Global Multiple Sclerosis Treatment Market Value Contribution, By Route of Administration, 2022 & 2030 (Value %)
FIG. 20 Global Multiple Sclerosis Treatment Market, by Oral, Value, 2017-2030 (US$ Bn)
FIG. 21 Global Multiple Sclerosis Treatment Market, by Injectables, 2017-2030 (US$ Bn)
FIG. 22 Global Multiple Sclerosis Treatment Market, by Infusions, 2017-2030 (US$ Bn)
FIG. 23 Global Multiple Sclerosis Treatment Market Value Contribution, By Distribution Channel, 2022 & 2030 (Value %)
FIG. 24 Global Multiple Sclerosis Treatment Market, by Hospital Pharmacy, Value, 2017-2030 (US$ Bn)
FIG. 25 Global Multiple Sclerosis Treatment Market, by Retail Pharmacy, 2017-2030 (US$ Bn)
FIG. 26 Global Multiple Sclerosis Treatment Market, by Online Stores, 2017-2030 (US$ Bn)
FIG. 27 North America Multiple Sclerosis Treatment Market, 2017-2030 (US$ Bn)
FIG. 28 U.S. Multiple Sclerosis Treatment Market, 2017-2030 (US$ Bn)
FIG. 29 Canada Multiple Sclerosis Treatment Market, 2017-2030 (US$ Bn)
FIG. 30 Europe Multiple Sclerosis Treatment Market, 2017-2030 (US$ Bn)
FIG. 31 Germany Multiple Sclerosis Treatment Market, 2017-2030 (US$ Bn)
FIG. 32 France Multiple Sclerosis Treatment Market, 2017-2030 (US$ Bn)
FIG. 33 U.K. Multiple Sclerosis Treatment Market, 2017-2030 (US$ Bn)
FIG. 34 Italy Multiple Sclerosis Treatment Market, 2017-2030 (US$ Bn)
FIG. 35 Spain Multiple Sclerosis Treatment Market, 2017-2030 (US$ Bn)
FIG. 36 Rest of Europe Multiple Sclerosis Treatment Market, 2017-2030 (US$ Bn)
FIG. 37 Asia Pacific Multiple Sclerosis Treatment Market, 2017-2030 (US$ Bn)
FIG. 38 China Multiple Sclerosis Treatment Market, 2017-2030 (US$ Bn)
FIG. 39 Japan Multiple Sclerosis Treatment Market, 2017-2030 (US$ Bn)
FIG. 40 India Multiple Sclerosis Treatment Market, 2017-2030 (US$ Bn)
FIG. 41 South Korea Multiple Sclerosis Treatment Market, 2017-2030 (US$ Bn)
FIG. 42 South-East Asia Multiple Sclerosis Treatment Market, 2017-2030 (US$ Bn)
FIG. 43 Rest of Asia Pacific Multiple Sclerosis Treatment Market, 2017-2030 (US$ Bn)
FIG. 44 Latin America Multiple Sclerosis Treatment Market, 2017-2030 (US$ Bn)
FIG. 45 Brazil Multiple Sclerosis Treatment Market, 2017-2030 (US$ Bn)
FIG. 46 Mexico Multiple Sclerosis Treatment Market, 2017-2030 (US$ Bn)
FIG. 47 Rest of Latin America Multiple Sclerosis Treatment Market, 2017-2030 (US$ Bn)
FIG. 48 Middle East & Africa Multiple Sclerosis Treatment Market, 2017-2030 (US$ Bn)
FIG. 49 GCC Countries Multiple Sclerosis Treatment Market, 2017-2030 (US$ Bn)
FIG. 50 South Africa Multiple Sclerosis Treatment Market, 2017-2030 (US$ Bn)
FIG. 51 Rest of Middle East and Africa Multiple Sclerosis Treatment Market, 2017-2030 (US$ Bn)

List of Tables
TABLE 1 Market Snapshot: Global Multiple Sclerosis Treatment Market
TABLE 2 Global Multiple Sclerosis Treatment Market: Market Drivers Impact Analysis
TABLE 3 Global Multiple Sclerosis Treatment Market: Market Restraints Impact Analysis
TABLE 4 Global Multiple Sclerosis Treatment Market, by Competitive Benchmarking, 2022
TABLE 5 Global Multiple Sclerosis Treatment Market, by Geographical Presence Analysis, 2022
TABLE 6 Global Multiple Sclerosis Treatment Market, by Key Strategies Analysis, 2022
TABLE 7 Global Multiple Sclerosis Treatment Market, by Drug Class, By Region, 2017-2022 (US$ Bn)
TABLE 8 Global Multiple Sclerosis Treatment Market, by Drug Class, By Region, 2023-2030 (US$ Bn)
TABLE 9 Global Multiple Sclerosis Treatment Market, by Immunomodulators, By Region, 2017-2022 (US$ Bn)
TABLE 10 Global Multiple Sclerosis Treatment Market, by Immunomodulators, By Region, 2023-2030 (US$ Bn)
TABLE 11 Global Multiple Sclerosis Treatment Market, by Immunosuppressants, By Region, 2017-2022 (US$ Bn)
TABLE 12 Global Multiple Sclerosis Treatment Market, by Immunosuppressants, By Region, 2023-2030 (US$ Bn)
TABLE 13 Global Multiple Sclerosis Treatment Market, by Interferons, By Region, 2017-2022 (US$ Bn)
TABLE 14 Global Multiple Sclerosis Treatment Market, by Interferons, By Region, 2023-2030 (US$ Bn)
TABLE 15 Global Multiple Sclerosis Treatment Market, by Others, By Region, 2017-2022 (US$ Bn)
TABLE 16 Global Multiple Sclerosis Treatment Market, by Others, By Region, 2023-2030 (US$ Bn)
TABLE 17 Global Multiple Sclerosis Treatment Market, by Route of Administration, By Region, 2017-2022 (US$ Bn)
TABLE 18 Global Multiple Sclerosis Treatment Market, by Route of Administration, By Region, 2017-2022 (US$ Bn)
TABLE 19 Global Multiple Sclerosis Treatment Market, by Oral, By Region, 2017-2022 (US$ Bn)
TABLE 20 Global Multiple Sclerosis Treatment Market, by Oral, By Region, 2023-2030 (US$ Bn)
TABLE 21 Global Multiple Sclerosis Treatment Market, by Injectables, By Region, 2017-2022 (US$ Bn)
TABLE 22 Global Multiple Sclerosis Treatment Market, by Injectables, By Region, 2023-2030 (US$ Bn)
TABLE 23 Global Multiple Sclerosis Treatment Market, by Infusions, By Region, 2017-2022 (US$ Bn)
TABLE 24 Global Multiple Sclerosis Treatment Market, by Infusions, By Region, 2023-2030 (US$ Bn)
TABLE 25 Global Multiple Sclerosis Treatment Market, by Hospital Pharmacy, By Region, 2017-2022 (US$ Bn)
TABLE 26 Global Multiple Sclerosis Treatment Market, by Hospital Pharmacy, By Region, 2023-2030 (US$ Bn)
TABLE 27 Global Multiple Sclerosis Treatment Market, by Retail Pharmacy, By Region, 2017-2022 (US$ Bn)
TABLE 28 Global Multiple Sclerosis Treatment Market, by Retail Pharmacy, By Region, 2023-2030 (US$ Bn)
TABLE 29 Global Multiple Sclerosis Treatment Market, by Online Stores, By Region, 2017-2022 (US$ Bn)
TABLE 30 Global Multiple Sclerosis Treatment Market, by Online Stores, By Region, 2023-2030 (US$ Bn)
TABLE 31 Global Multiple Sclerosis Treatment Market, by Region, 2017-2022 (US$ Bn)
TABLE 32 Global Multiple Sclerosis Treatment Market, by Region, 2023-2030 (US$ Bn)
TABLE 33 North America Multiple Sclerosis Treatment Market, by Drug Class, 2017-2022 (US$ Bn)
TABLE 34 North America Multiple Sclerosis Treatment Market, by Drug Class, 2023-2030 (US$ Bn)
TABLE 35 North America Multiple Sclerosis Treatment Market, by Route of Administration, 2017-2022 (US$ Bn)
TABLE 36 North America Multiple Sclerosis Treatment Market, by Route of Administration, 2023-2030 (US$ Bn)
TABLE 37 North America Multiple Sclerosis Treatment Market, by Distribution Channel, 2017-2022 (US$ Bn)
TABLE 38 North America Multiple Sclerosis Treatment Market, by Distribution Channel, 2023-2030 (US$ Bn)
TABLE 39 North America Multiple Sclerosis Treatment Market, by Country, 2017-2022 (US$ Bn)
TABLE 40 North America Multiple Sclerosis Treatment Market, by Country, 2023-2030 (US$ Bn)
TABLE 41 United States Multiple Sclerosis Treatment Market, by Drug Class, 2017-2022 (US$ Bn)
TABLE 42 United States Multiple Sclerosis Treatment Market, by Drug Class, 2023-2030 (US$ Bn)
TABLE 43 United States Multiple Sclerosis Treatment Market, by Route of Administration, 2017-2022 (US$ Bn)
TABLE 44 United States Multiple Sclerosis Treatment Market, by Route of Administration, 2023-2030 (US$ Bn)
TABLE 45 United States Multiple Sclerosis Treatment Market, by Distribution Channel, 2017-2022 (US$ Bn)
TABLE 46 United States Multiple Sclerosis Treatment Market, by Distribution Channel, 2023-2030 (US$ Bn)
TABLE 47 Canada Multiple Sclerosis Treatment Market, by Drug Class, 2017-2022 (US$ Bn)
TABLE 48 Canada Multiple Sclerosis Treatment Market, by Drug Class, 2023-2030 (US$ Bn)
TABLE 49 Canada Multiple Sclerosis Treatment Market, by Route of Administration, 2017-2022 (US$ Bn)
TABLE 50 Canada Multiple Sclerosis Treatment Market, by Route of Administration, 2023-2030 (US$ Bn)
TABLE 51 Canada Multiple Sclerosis Treatment Market, by Distribution Channel, 2017-2022 (US$ Bn)
TABLE 52 Canada Multiple Sclerosis Treatment Market, by Distribution Channel, 2023-2030 (US$ Bn)
TABLE 53 Mexico Multiple Sclerosis Treatment Market, by Drug Class, 2017-2022 (US$ Bn)
TABLE 54 Mexico Multiple Sclerosis Treatment Market, by Drug Class, 2023-2030 (US$ Bn)
TABLE 55 Mexico Multiple Sclerosis Treatment Market, by Route of Administration, 2017-2022 (US$ Bn)
TABLE 56 Mexico Multiple Sclerosis Treatment Market, by Route of Administration, 2023-2030 (US$ Bn)
TABLE 57 Mexico Multiple Sclerosis Treatment Market, by Distribution Channel, 2017-2022 (US$ Bn)
TABLE 58 Mexico Multiple Sclerosis Treatment Market, by Distribution Channel, 2023-2030 (US$ Bn)
TABLE 59 Europe Multiple Sclerosis Treatment Market, by Drug Class, 2017-2022 (US$ Bn)
TABLE 60 Europe Multiple Sclerosis Treatment Market, by Drug Class, 2023-2030 (US$ Bn)
TABLE 61 Europe Multiple Sclerosis Treatment Market, by Route of Administration, 2017-2022 (US$ Bn)
TABLE 62 Europe Multiple Sclerosis Treatment Market, by Route of Administration, 2023-2030 (US$ Bn)
TABLE 63 Europe Multiple Sclerosis Treatment Market, by Distribution Channel, 2017-2022 (US$ Bn)
TABLE 64 Europe Multiple Sclerosis Treatment Market, by Distribution Channel, 2023-2030 (US$ Bn)
TABLE 65 Europe Multiple Sclerosis Treatment Market, by Country, 2017-2022 (US$ Bn)
TABLE 66 Europe Multiple Sclerosis Treatment Market, by Country, 2023-2030 (US$ Bn)
TABLE 67 Germany Multiple Sclerosis Treatment Market, by Drug Class, 2017-2022 (US$ Bn)
TABLE 68 Germany Multiple Sclerosis Treatment Market, by Drug Class, 2023-2030 (US$ Bn)
TABLE 69 Germany Multiple Sclerosis Treatment Market, by Route of Administration, 2017-2022 (US$ Bn)
TABLE 70 Germany Multiple Sclerosis Treatment Market, by Route of Administration, 2023-2030 (US$ Bn)
TABLE 71 Germany Multiple Sclerosis Treatment Market, by Distribution Channel, 2017-2022 (US$ Bn)
TABLE 72 Germany Multiple Sclerosis Treatment Market, by Distribution Channel, 2023-2030 (US$ Bn)
TABLE 73 France Multiple Sclerosis Treatment Market, by Drug Class, 2017-2022 (US$ Bn)
TABLE 74 France Multiple Sclerosis Treatment Market, by Drug Class, 2023-2030 (US$ Bn)
TABLE 75 France Multiple Sclerosis Treatment Market, by Route of Administration, 2017-2022 (US$ Bn)
TABLE 76 France Multiple Sclerosis Treatment Market, by Route of Administration, 2023-2030 (US$ Bn)
TABLE 77 France Multiple Sclerosis Treatment Market, by Distribution Channel, 2017-2022 (US$ Bn)
TABLE 78 France Multiple Sclerosis Treatment Market, by Distribution Channel, 2023-2030 (US$ Bn)
TABLE 79 United Kingdom Multiple Sclerosis Treatment Market, by Drug Class, 2017-2022 (US$ Bn)
TABLE 80 United Kingdom Multiple Sclerosis Treatment Market, by Drug Class, 2023-2030 (US$ Bn)
TABLE 81 United Kingdom Multiple Sclerosis Treatment Market, by Route of Administration, 2017-2022 (US$ Bn)
TABLE 82 United Kingdom Multiple Sclerosis Treatment Market, by Route of Administration, 2023-2030 (US$ Bn)
TABLE 83 United Kingdom Multiple Sclerosis Treatment Market, by Distribution Channel, 2017-2022 (US$ Bn)
TABLE 84 United Kingdom Multiple Sclerosis Treatment Market, by Distribution Channel, 2023-2030 (US$ Bn)
TABLE 85 Italy Multiple Sclerosis Treatment Market, by Drug Class, 2017-2022 (US$ Bn)
TABLE 86 Italy Multiple Sclerosis Treatment Market, by Drug Class, 2023-2030 (US$ Bn)
TABLE 87 Italy Multiple Sclerosis Treatment Market, by Route of Administration, 2017-2022 (US$ Bn)
TABLE 88 Italy Multiple Sclerosis Treatment Market, by Route of Administration, 2023-2030 (US$ Bn)
TABLE 89 Italy Multiple Sclerosis Treatment Market, by Distribution Channel, 2017-2022 (US$ Bn)
TABLE 90 Italy Multiple Sclerosis Treatment Market, by Distribution Channel, 2023-2030 (US$ Bn)
TABLE 91 Spain Multiple Sclerosis Treatment Market, by Drug Class, 2017-2022 (US$ Bn)
TABLE 92 Spain Multiple Sclerosis Treatment Market, by Drug Class, 2023-2030 (US$ Bn)
TABLE 93 Spain Multiple Sclerosis Treatment Market, by Route of Administration, 2017-2022 (US$ Bn)
TABLE 94 Spain Multiple Sclerosis Treatment Market, by Route of Administration, 2023-2030 (US$ Bn)
TABLE 95 Spain Multiple Sclerosis Treatment Market, by Distribution Channel, 2017-2022 (US$ Bn)
TABLE 96 Spain Multiple Sclerosis Treatment Market, by Distribution Channel, 2023-2030 (US$ Bn)
TABLE 97 Rest of Europe Multiple Sclerosis Treatment Market, by Drug Class, 2017-2022 (US$ Bn)
TABLE 98 Rest of Europe Multiple Sclerosis Treatment Market, by Drug Class, 2023-2030 (US$ Bn)
TABLE 99 Rest of Europe Multiple Sclerosis Treatment Market, by Route of Administration, 2017-2022 (US$ Bn)
TABLE 100 Rest of Europe Multiple Sclerosis Treatment Market, by Route of Administration, 2023-2030 (US$ Bn)
TABLE 101 Rest of Europe Multiple Sclerosis Treatment Market, by Distribution Channel, 2017-2022 (US$ Bn)
TABLE 102 Rest of Europe Multiple Sclerosis Treatment Market, by Distribution Channel, 2023-2030 (US$ Bn)
TABLE 103 Asia Pacific Multiple Sclerosis Treatment Market, by Drug Class, 2017-2022 (US$ Bn)
TABLE 104 Asia Pacific Multiple Sclerosis Treatment Market, by Drug Class, 2023-2030 (US$ Bn)
TABLE 105 Asia Pacific Multiple Sclerosis Treatment Market, by Route of Administration, 2017-2022 (US$ Bn)
TABLE 106 Asia Pacific Multiple Sclerosis Treatment Market, by Route of Administration, 2023-2030 (US$ Bn)
TABLE 107 Asia Pacific Multiple Sclerosis Treatment Market, by Distribution Channel, 2017-2022 (US$ Bn)
TABLE 108 Asia Pacific Multiple Sclerosis Treatment Market, by Distribution Channel, 2023-2030 (US$ Bn)
TABLE 109 China Multiple Sclerosis Treatment Market, by Drug Class, 2017-2022 (US$ Bn)
TABLE 110 China Multiple Sclerosis Treatment Market, by Drug Class, 2023-2030 (US$ Bn)
TABLE 111 China Multiple Sclerosis Treatment Market, by Route of Administration, 2017-2022 (US$ Bn)
TABLE 112 China Multiple Sclerosis Treatment Market, by Route of Administration, 2023-2030 (US$ Bn)
TABLE 113 China Multiple Sclerosis Treatment Market, by Distribution Channel, 2017-2022 (US$ Bn)
TABLE 114 China Multiple Sclerosis Treatment Market, by Distribution Channel, 2023-2030 (US$ Bn)
TABLE 115 Japan Multiple Sclerosis Treatment Market, by Drug Class, 2017-2022 (US$ Bn)
TABLE 116 Japan Multiple Sclerosis Treatment Market, by Drug Class, 2023-2030 (US$ Bn)
TABLE 117 Japan Multiple Sclerosis Treatment Market, by Route of Administration, 2017-2022 (US$ Bn)
TABLE 118 Japan Multiple Sclerosis Treatment Market, by Route of Administration, 2023-2030 (US$ Bn)
TABLE 119 Japan Multiple Sclerosis Treatment Market, by Distribution Channel, 2017-2022 (US$ Bn)
TABLE 120 Japan Multiple Sclerosis Treatment Market, by Distribution Channel, 2023-2030 (US$ Bn)
TABLE 121 India Multiple Sclerosis Treatment Market, by Drug Class, 2017-2022 (US$ Bn)
TABLE 122 India Multiple Sclerosis Treatment Market, by Drug Class, 2023-2030 (US$ Bn)
TABLE 123 India Multiple Sclerosis Treatment Market, by Route of Administration, 2017-2022 (US$ Bn)
TABLE 124 India Multiple Sclerosis Treatment Market, by Route of Administration, 2023-2030 (US$ Bn)
TABLE 125 India Multiple Sclerosis Treatment Market, by Distribution Channel, 2017-2022 (US$ Bn)
TABLE 126 India Multiple Sclerosis Treatment Market, by Distribution Channel, 2023-2030 (US$ Bn)
TABLE 127 South Korea Multiple Sclerosis Treatment Market, by Drug Class, 2017-2022 (US$ Bn)
TABLE 128 South Korea Multiple Sclerosis Treatment Market, by Drug Class, 2023-2030 (US$ Bn)
TABLE 129 South Korea Multiple Sclerosis Treatment Market, by Route of Administration, 2017-2022 (US$ Bn)
TABLE 130 South Korea Multiple Sclerosis Treatment Market, by Route of Administration, 2023-2030 (US$ Bn)
TABLE 131 South Korea Multiple Sclerosis Treatment Market, by Distribution Channel, 2017-2022 (US$ Bn)
TABLE 132 South Korea Multiple Sclerosis Treatment Market, by Distribution Channel, 2023-2030 (US$ Bn)
TABLE 133 South-East Asia Multiple Sclerosis Treatment Market, by Drug Class, 2017-2022 (US$ Bn)
TABLE 134 South-East Asia Multiple Sclerosis Treatment Market, by Drug Class, 2023-2030 (US$ Bn)
TABLE 135 South-East Asia Multiple Sclerosis Treatment Market, by Route of Administration, 2017-2022 (US$ Bn)
TABLE 136 South-East Asia Multiple Sclerosis Treatment Market, by Route of Administration, 2023-2030 (US$ Bn)
TABLE 137 South-East Asia Multiple Sclerosis Treatment Market, by Distribution Channel, 2017-2022 (US$ Bn)
TABLE 138 South-East Asia Multiple Sclerosis Treatment Market, by Distribution Channel, 2023-2030 (US$ Bn)
TABLE 139 Rest of Asia Pacific Multiple Sclerosis Treatment Market, by Drug Class, 2017-2022 (US$ Bn)
TABLE 140 Rest of Asia Pacific Multiple Sclerosis Treatment Market, by Drug Class, 2023-2030 (US$ Bn)
TABLE 141 Rest of Asia Pacific Multiple Sclerosis Treatment Market, by Route of Administration, 2017-2022 (US$ Bn)
TABLE 142 Rest of Asia Pacific Multiple Sclerosis Treatment Market, by Route of Administration, 2023-2030 (US$ Bn)
TABLE 143 Rest of Asia Pacific Multiple Sclerosis Treatment Market, by Distribution Channel, 2017-2022 (US$ Bn)
TABLE 144 Rest of Asia Pacific Multiple Sclerosis Treatment Market, by Distribution Channel, 2023-2030 (US$ Bn)
TABLE 145 Latin America Multiple Sclerosis Treatment Market, by Drug Class, 2017-2022 (US$ Bn)
TABLE 146 Latin America Multiple Sclerosis Treatment Market, by Drug Class, 2023-2030 (US$ Bn)
TABLE 147 Latin America Multiple Sclerosis Treatment Market, by Route of Administration, 2017-2022 (US$ Bn)
TABLE 148 Latin America Multiple Sclerosis Treatment Market, by Route of Administration, 2023-2030 (US$ Bn)
TABLE 149 Latin America Multiple Sclerosis Treatment Market, by Distribution Channel, 2017-2022 (US$ Bn)
TABLE 150 Latin America Multiple Sclerosis Treatment Market, by Distribution Channel, 2023-2030 (US$ Bn)
TABLE 151 Brazil Multiple Sclerosis Treatment Market, by Drug Class, 2017-2022 (US$ Bn)
TABLE 152 Brazil Multiple Sclerosis Treatment Market, by Drug Class, 2023-2030 (US$ Bn)
TABLE 153 Brazil Multiple Sclerosis Treatment Market, by Route of Administration, 2017-2022 (US$ Bn)
TABLE 154 Brazil Multiple Sclerosis Treatment Market, by Route of Administration, 2023-2030 (US$ Bn)
TABLE 155 Brazil Multiple Sclerosis Treatment Market, by Distribution Channel, 2017-2022 (US$ Bn)
TABLE 156 Brazil Multiple Sclerosis Treatment Market, by Distribution Channel, 2023-2030 (US$ Bn)
TABLE 157 Argentina Multiple Sclerosis Treatment Market, by Drug Class, 2017-2022 (US$ Bn)
TABLE 158 Argentina Multiple Sclerosis Treatment Market, by Drug Class, 2023-2030 (US$ Bn)
TABLE 159 Argentina Multiple Sclerosis Treatment Market, by Route of Administration, 2017-2022 (US$ Bn)
TABLE 160 Argentina Multiple Sclerosis Treatment Market, by Route of Administration, 2023-2030 (US$ Bn)
TABLE 161 Argentina Multiple Sclerosis Treatment Market, by Distribution Channel, 2017-2022 (US$ Bn)
TABLE 162 Argentina Multiple Sclerosis Treatment Market, by Distribution Channel, 2023-2030 (US$ Bn)
TABLE 163 Rest of Latin America Multiple Sclerosis Treatment Market, by Drug Class, 2017-2022 (US$ Bn)
TABLE 164 Rest of Latin America Multiple Sclerosis Treatment Market, by Drug Class, 2023-2030 (US$ Bn)
TABLE 165 Rest of Latin America Multiple Sclerosis Treatment Market, by Route of Administration, 2017-2022 (US$ Bn)
TABLE 166 Rest of Latin America Multiple Sclerosis Treatment Market, by Route of Administration, 2023-2030 (US$ Bn)
TABLE 167 Rest of Latin America Multiple Sclerosis Treatment Market, by Distribution Channel, 2017-2022 (US$ Bn)
TABLE 168 Rest of Latin America Multiple Sclerosis Treatment Market, by Distribution Channel, 2023-2030 (US$ Bn)
TABLE 169 Middle East and Africa Multiple Sclerosis Treatment Market, by Drug Class, 2017-2022 (US$ Bn)
TABLE 170 Middle East and Africa Multiple Sclerosis Treatment Market, by Drug Class, 2023-2030 (US$ Bn)
TABLE 171 Middle East and Africa Multiple Sclerosis Treatment Market, by Route of Administration, 2017-2022 (US$ Bn)
TABLE 172 Middle East and Africa Multiple Sclerosis Treatment Market, by Route of Administration, 2023-2030 (US$ Bn)
TABLE 173 Middle East and Africa Multiple Sclerosis Treatment Market, by Distribution Channel, 2017-2022 (US$ Bn)
TABLE 174 Middle East and Africa Multiple Sclerosis Treatment Market, by Distribution Channel, 2023-2030 (US$ Bn)
TABLE 175 GCC Countries Multiple Sclerosis Treatment Market, by Drug Class, 2017-2022 (US$ Bn)
TABLE 176 GCC Countries Multiple Sclerosis Treatment Market, by Drug Class, 2023-2030 (US$ Bn)
TABLE 177 GCC Countries Multiple Sclerosis Treatment Market, by Route of Administration, 2017-2022 (US$ Bn)
TABLE 178 GCC Countries Multiple Sclerosis Treatment Market, by Route of Administration, 2023-2030 (US$ Bn)
TABLE 179 GCC Countries Multiple Sclerosis Treatment Market, by Distribution Channel, 2017-2022 (US$ Bn)
TABLE 180 GCC Countries Multiple Sclerosis Treatment Market, by Distribution Channel, 2023-2030 (US$ Bn)
TABLE 181 South Africa Multiple Sclerosis Treatment Market, by Drug Class, 2017-2022 (US$ Bn)
TABLE 182 South Africa Multiple Sclerosis Treatment Market, by Drug Class, 2023-2030 (US$ Bn)
TABLE 183 South Africa Multiple Sclerosis Treatment Market, by Route of Administration, 2017-2022 (US$ Bn)
TABLE 184 South Africa Multiple Sclerosis Treatment Market, by Route of Administration, 2023-2030 (US$ Bn)
TABLE 185 South Africa Multiple Sclerosis Treatment Market, by Distribution Channel, 2017-2022 (US$ Bn)
TABLE 186 South Africa Multiple Sclerosis Treatment Market, by Distribution Channel, 2023-2030 (US$ Bn)
TABLE 187 Rest of Middle East and Africa Multiple Sclerosis Treatment Market, by Drug Class, 2017-2022 (US$ Bn)
TABLE 188 Rest of Middle East and Africa Multiple Sclerosis Treatment Market, by Drug Class, 2023-2030 (US$ Bn)
TABLE 189 Rest of Middle East and Africa Multiple Sclerosis Treatment Market, by Route of Administration, 2017-2022 (US$ Bn)
TABLE 190 Rest of Middle East and Africa Multiple Sclerosis Treatment Market, by Route of Administration, 2023-2030 (US$ Bn)
TABLE 191 Rest of Middle East and Africa Multiple Sclerosis Treatment Market, by Distribution Channel, 2017-2022 (US$ Bn)
TABLE 192 Rest of Middle East and Africa Multiple Sclerosis Treatment Market, by Distribution Channel, 2023-2030 (US$ Bn)

Frequently asked questions

What is the current size of the global multiple sclerosis treatment market?

The global multiple sclerosis treatment market was valued at USD 24.9 Billion in 2022.

What is the expected growth rate of the multiple sclerosis treatment market between 2023 and 2030?

The multiple sclerosis treatment market is expected to grow at a CAGR of 4.1% between 2023 and 2030, reaching USD 32.9 Billion in 2030.

Which segment is leading the market share in terms of Route of administration?

Interferons is the leading segment by Route of administration, holding over 30% share in value in 2022.

Which drug class Route of administration segment governs the demand for multiple sclerosis treatment worldwide?

The Injectables segment governs the global demand for multiple sclerosis treatment, holding a massive share of over 35% in 2022.

Which segment is expected to post the highest CAGR during the forecast period

The hospital pharmacy equipment segment is expected to post the highest CAGR during the forecast period.

Which region is fueling the growth of the multiple sclerosis treatment industry?

North America is fueling the growth of the multiple sclerosis treatment industry, with an over one-third share in 2022.

Who are the major players in the global multiple sclerosis treatment market?

The top players include Pfizer, Bayer AG, Teva Pharmaceutical Industries Ltd, Novartis AG, Sanofi, and F. Hoffmann-La Roche Ltd.

What are the major market drivers of the multiple sclerosis treatment industry?

The major market drivers are the increasing prevalence of multiple sclerosis, advancements in therapeutic options, and a growing focus on personalized medicine and precision therapies.

What are the major market restraints of multiple sclerosis treatment industry?

The major market restraints are the high cost of multiple sclerosis treatments and adverse side effects associated with some therapies.

What are the major market opportunities of the multiple sclerosis treatment industry?

Development of novel therapies, personalized and precision therapies, expansion into emerging markets, and technological advancements in diagnostics and monitoring tools.

Vietnam Pneumococcal Vaccine Market

Published:
Report ID: 37015

Maternity and Nursing Bras Market

Published:
Report ID: 36899

Gene Therapy Market

Published:
Report ID: 36825

Antioxidant Market

Published:
Report ID: 6987

Drug Screening Market

Published:
Report ID: 36731

Angiogenesis Inhibitors and Stimulators Market

Published:
Report ID: 36682

Rotator Cuff Injury Treatment Market

Published:
Report ID: 36567

Aspergillosis Treatment Market

Published:
Report ID: 2106

Middle East And Africa Female Hygiene Products Market

Published:
Report ID: 8484

Therapeutic Monoclonal Antibodies Market

Published:
Report ID: 11175

Prostate Cancer Market

Published:
Report ID: 36273

Antineoplastic Agents Market

Published:
Report ID: 36065

Purchase Options

$2999
Delivery Format: Excel.
$4999
Designed for the individual purchaser.
$6999
Users located at a single corporate site or regional office.
$7999
Allowed for unlimited sharing globally within one company.
Smallform of Sample request

Have a question?

User Profile

Don’t settle for less – trust Mitul to help you find the best solution.

Report delivery within 24 to 48 hours

– Other Info –

What people say?-

User Review

I am very impressed with the information in this report. The author clearly did their research when they came up with this product and it has already given me a lot of ideas.

Jana Schmidt
CEDAR CX Technologies

– Connect with us –

Phone

+91 6232 49 3207


support

24/7 Research Support


sales@credenceresearch.com

– Research Methodology –

Going beyond the basics: advanced techniques in research methodology

– Trusted By –

Pepshi, LG, Nestle
Motorola, Honeywell, Johnson and johnson
LG Chem, SIEMENS, Pfizer
Unilever, Samsonite, QIAGEN