
Market Overview
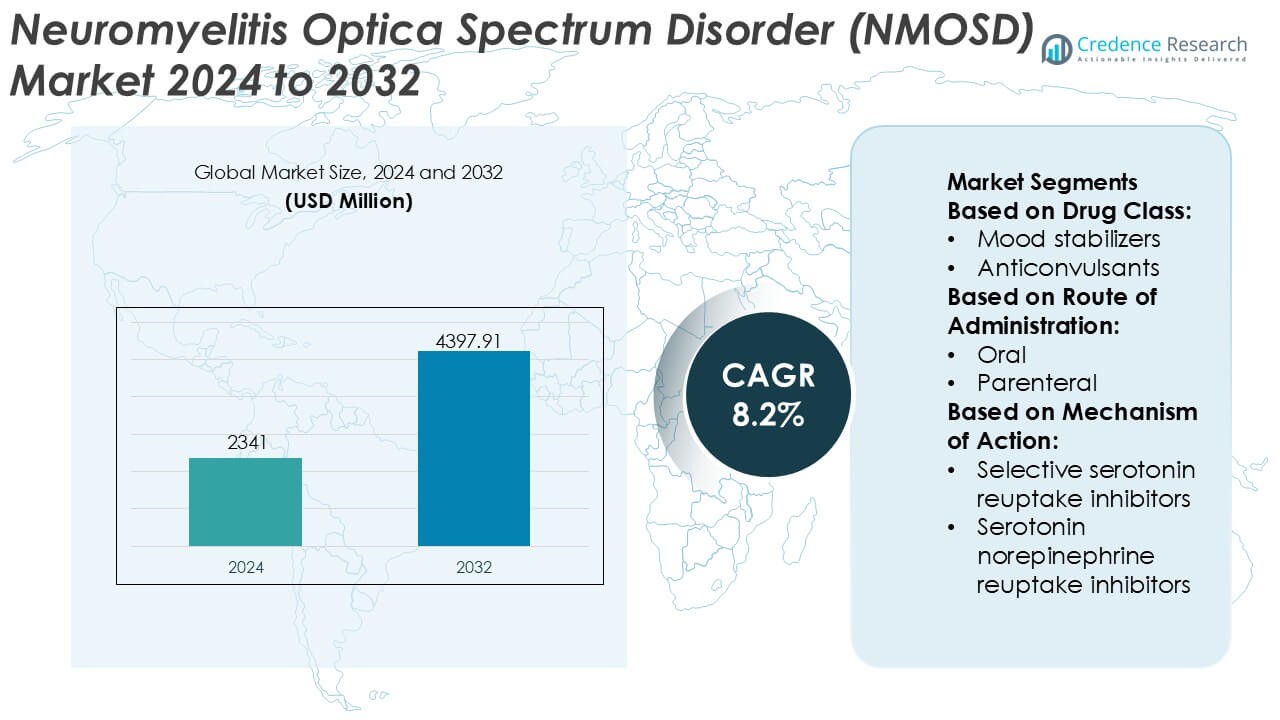
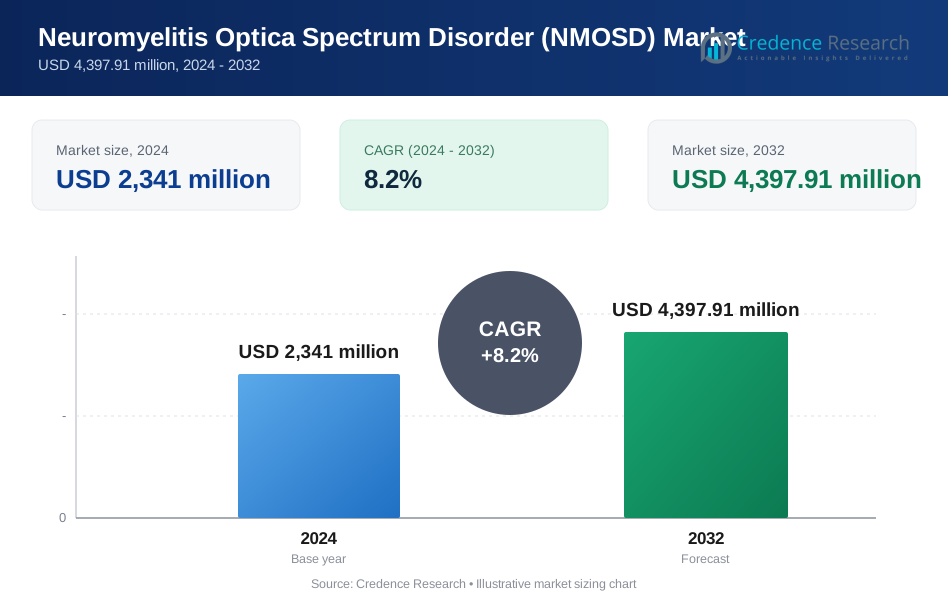
Neuromyelitis Optica Spectrum Disorder (NMOSD) Market size was valued USD 2341 million in 2024 and is anticipated to reach USD 4397.91 million by 2032, at a CAGR of 8.2% during the forecast period.
| REPORT ATTRIBUTE | DETAILS |
|---|---|
| Historical Period | 2020-2023 |
| Base Year | 2024 |
| Forecast Period | 2025-2032 |
| Neuromyelitis Optica Spectrum Disorder (NMOSD) Market Size 2024 | USD 2341 Million |
| Neuromyelitis Optica Spectrum Disorder (NMOSD) Market, CAGR | 8.2% |
| Neuromyelitis Optica Spectrum Disorder (NMOSD) Market Size 2032 | USD 4397.91 Million |
The Neuromyelitis Optica Spectrum Disorder (NMOSD) market features a concentrated competitive landscape shaped by established pharmaceutical companies and emerging biopharma players focused on rare autoimmune neurology. Market participants compete through differentiated monoclonal antibodies, expanded indications for complement and B-cell–targeted therapies, and strong late-stage clinical pipelines designed to reduce relapse risk and long-term disability. Strategic priorities emphasize regulatory approvals in orphan indications, lifecycle management, and post-marketing evidence generation to support broader clinical adoption. Regionally, North America leads the NMOSD market with an exact 41% share, supported by early diagnosis rates, favorable reimbursement frameworks, strong patient advocacy networks, and rapid uptake of newly approved targeted therapies across specialized neurology centers.
Market Insights
- The NMOSD market was valued at USD 2,341 million in 2024 and is projected to reach USD 4,397.91 million by 2032, expanding at a CAGR of 8.2%, driven by rising diagnosis rates and increasing adoption of targeted biologic therapies.
- Market growth is supported by strong demand for relapse-prevention therapies, wider use of aquaporin-4 antibody testing, and improved access to orphan drugs across advanced healthcare systems.
- Monoclonal antibody–based therapies represent the dominant treatment segment, accounting for over two-thirds of total demand, reflecting their superior efficacy in reducing relapse frequency and long-term neurological damage.
- The competitive landscape remains concentrated, with leading players focusing on complement inhibition, B-cell targeting mechanisms, and post-approval evidence generation to strengthen long-term therapy adoption.
- Regionally, North America leads with an exact 41% market share, supported by early diagnosis, favorable reimbursement, strong patient advocacy, while high treatment costs and limited awareness restrain faster uptake in emerging regions.
Market Segmentation Analysis:
By Drug Class
By drug class, anticonvulsants emerge as the dominant sub-segment in the NMOSD market, accounting for an estimated 34% market share. Their dominance reflects widespread use in managing neuropathic pain, spasticity, and seizure-like manifestations that frequently accompany NMOSD. Clinicians favor anticonvulsants due to their established efficacy, predictable dosing profiles, and compatibility with long-term neurological care. Antidepressant and anti-anxiety drugs follow, driven by the high prevalence of mood disorders and chronic fatigue in NMOSD patients. Ongoing optimization of combination regimens further sustains demand across this segment.
- For instance, Chugai Pharmaceutical (a member of the Roche Group) discovered and developed satralizumab. It is marketed globally by Roche and Genentech. The regimen consists of a 120 mg subcutaneous dose at weeks 0, 2, and 4 (loading phase), followed by 120 mg every four weeks (maintenance).
By Route of Administration
By route of administration, oral formulations dominate the NMOSD market with an estimated 56% market share, supported by ease of administration and suitability for chronic symptom management. Oral therapies enable long-term outpatient treatment, improve patient adherence, and reduce reliance on hospital-based care. Parenteral routes maintain relevance in acute disease flares and severe symptom control, particularly in hospital settings. However, growing emphasis on home-based care and patient convenience continues to strengthen the position of oral drugs. Advances in extended-release formulations also contribute to sustained uptake within this segment.
- For instance, Pfizer Inc. has advanced oral drug development through small-molecule therapies like etrasimod, engineered for once-daily administration at a 2 mg dose. Validated in controlled clinical programs like ELEVATE UC 52, the therapy demonstrated consistent systemic exposure over 52 weeks and long-term tolerability in patients with chronic autoimmune inflammatory conditions, supported by a pharmacokinetic half-life of approximately 33 hours.
By Mechanism of Action
By mechanism of action, selective serotonin reuptake inhibitors (SSRIs) hold the leading position, capturing approximately 31% market share. Their dominance stems from effectiveness in addressing depression, anxiety, and fatigue commonly associated with NMOSD, while offering favorable safety and tolerability profiles. Clinicians prefer SSRIs for long-term use due to lower cardiovascular and anticholinergic risks compared to tricyclic antidepressants. Serotonin norepinephrine reuptake inhibitors gain traction for patients with concomitant pain symptoms, while other mechanisms remain adjunct options. Expanding recognition of neuropsychiatric burden continues to drive this segment’s growth.
Key Growth Drivers
Rising Awareness and Improved Diagnostic Accuracy
Growing clinical awareness of NMOSD among neurologists and expanded access to advanced diagnostic tools strongly drive market growth. Wider adoption of cell-based assays for aquaporin-4 (AQP4-IgG) and myelin oligodendrocyte glycoprotein (MOG) antibodies enables earlier and more accurate differentiation from multiple sclerosis. Earlier diagnosis supports timely initiation of targeted therapies, reduces relapse severity, and improves long-term outcomes. Education initiatives by specialty societies and patient advocacy groups further accelerate diagnosis rates, expanding the treated patient pool and sustaining demand for disease-specific therapeutics.
- For instance, Roche and Amgen, have supported centralized trial infrastructures utilizing live cell-based AQP4-IgG assays. These programs have screened more than 1,000 patients globally to ensure diagnostic consistency in NMOSD research, often employing longitudinal testing at baseline and subsequent 24-week intervals to monitor serostatus and treatment response.
Expansion of Targeted and Approved Therapies
The introduction and broader adoption of targeted biologics significantly propel the NMOSD market. Therapies that inhibit complement activation, B-cell depletion, or interleukin-6 signaling address core disease mechanisms and demonstrate superior relapse prevention compared with off-label immunosuppressants. Regulatory approvals across major regions increase physician confidence and standardize treatment pathways. As treatment guidelines increasingly recommend targeted agents for maintenance therapy, prescription volumes rise, treatment persistence improves, and manufacturers benefit from sustained, long-term therapy utilization.
- For instance, AbbVie Inc. has expanded its immunology biologics portfolio through monoclonal antibody programs like risankizumab, manufactured using high-concentration subcutaneous formulations delivered in fixed 1-milliliter volumes.
Increasing Focus on Relapse Prevention and Long-Term Management
Clinical emphasis has shifted from acute attack management to proactive relapse prevention and chronic disease control. Evidence linking relapse frequency with irreversible disability encourages clinicians to adopt continuous maintenance therapy. Improved understanding of NMOSD disease burden, including visual impairment and mobility loss, strengthens payer support for preventive treatments. Long-term management strategies, supported by real-world evidence and post-marketing studies, reinforce therapy adoption and expand the market beyond episodic treatment toward sustained care models.
Key Trends & Opportunities
Pipeline Innovation and Next-Generation Therapeutics
Robust research pipelines create meaningful opportunities in the NMOSD market. Developers advance next-generation monoclonal antibodies, long-acting formulations, and subcutaneous delivery options to improve convenience and adherence. Investigational agents targeting novel immune pathways aim to enhance efficacy while reducing infection risk. Combination strategies and personalized treatment approaches based on antibody status further differentiate emerging therapies, offering manufacturers opportunities to address unmet needs and strengthen competitive positioning.
- For instance, AstraZeneca (through Alexion) has advanced next-generation monoclonal antibody platforms like ravulizumab, utilizing Fc-engineering technologies that extend antibody half-life to enable subcutaneous or intravenous dosing intervals of 8 weeks.
Geographic Expansion and Improved Access in Emerging Markets
Improving diagnostic infrastructure and specialist access in emerging economies open new growth avenues. Governments and healthcare systems increasingly recognize rare autoimmune neurological disorders, leading to better referral networks and reimbursement pathways. Partnerships with regional distributors, physician training programs, and patient support initiatives facilitate market entry. As awareness rises and biologic access improves, treatment penetration expands beyond traditionally established markets.
- For instance, Nipocalimab is in late-stage Phase 3 evaluation for NMOSD and Sjögren’s disease, and has already received regulatory submissions for Generalized Myasthenia Gravis (gMG) following successful pivotal trials.
Growing Role of Real-World Evidence and Patient-Centered Care
Stakeholders increasingly rely on real-world evidence to guide treatment decisions and reimbursement. Patient registries, long-term outcome studies, and digital monitoring tools support evidence generation on relapse reduction, safety, and quality-of-life benefits. Patient-centered care models emphasizing adherence support and shared decision-making strengthen therapy persistence. These trends enhance brand credibility, support payer negotiations, and create differentiation in a specialized therapeutic landscape.
Key Challenges
High Treatment Costs and Reimbursement Constraints
The high cost of targeted biologics presents a major challenge for NMOSD market expansion. Budget impact concerns limit reimbursement in cost-sensitive healthcare systems and delay access in emerging regions. Complex prior authorization requirements and step-therapy policies can restrict timely treatment initiation. Manufacturers face pressure to demonstrate long-term value through outcomes data and patient support programs, increasing commercialization complexity while potentially constraining uptake.
Disease Rarity and Limited Patient Identification
NMOSD’s low prevalence complicates patient identification, clinical trial recruitment, and commercial scaling. Misdiagnosis and under-recognition persist in non-specialist settings, limiting timely referral to appropriate care. Small patient populations increase per-patient development and marketing costs, while fragmented care pathways challenge consistent treatment adoption. Overcoming these barriers requires sustained education efforts, specialized networks, and collaboration with advocacy groups to improve diagnosis and long-term engagement.
Regional Analysis
North America
North America dominates the Neuromyelitis Optica Spectrum Disorder (NMOSD) market with an estimated 41% market share, driven by advanced diagnostic capabilities, high disease awareness, and early adoption of targeted biologic therapies. The region benefits from widespread availability of AQP4-IgG testing, strong neurologist density, and well-established referral pathways. Favorable reimbursement frameworks and rapid regulatory approvals support uptake of approved complement inhibitors and B-cell–targeted therapies. Ongoing clinical research activity and strong patient advocacy further enhance early diagnosis and long-term treatment adherence, sustaining North America’s leading position.
Europe
Europe accounts for an estimated 29% share of the global NMOSD market, supported by robust healthcare systems and growing adoption of guideline-driven treatment protocols. Countries such as Germany, France, the UK, and Italy lead regional demand due to specialized neurology centers and improved access to antibody testing. Regulatory harmonization and inclusion of NMOSD therapies in national reimbursement lists strengthen market penetration. However, cost-containment policies and varied reimbursement timelines across countries moderate growth. Increasing real-world evidence generation and cross-border clinical collaboration continue to support steady expansion across the region.
Asia-Pacific
Asia-Pacific holds approximately 18% of the NMOSD market and represents the fastest-expanding regional landscape. Rising disease recognition, expanding neurologist training programs, and improving access to diagnostic assays drive market development. Japan, China, and South Korea contribute significantly due to higher reported prevalence and growing biologic adoption. Government efforts to strengthen rare disease frameworks and expand insurance coverage improve treatment access. While affordability constraints persist in some markets, increasing urban healthcare investment and partnerships with global pharmaceutical companies support accelerating uptake of disease-specific therapies.
Latin America
Latin America represents an estimated 7% market share in the NMOSD market, characterized by gradual improvement in diagnosis and treatment access. Brazil and Mexico lead regional demand due to expanding neurology infrastructure and growing awareness of autoimmune neurological disorders. Access to advanced biologics remains uneven, with reliance on public healthcare systems influencing therapy availability. Delayed diagnosis and reimbursement variability continue to challenge growth. Nevertheless, increasing inclusion of rare diseases in national health agendas and expanding private healthcare participation support moderate but consistent market development.
Middle East & Africa
The Middle East & Africa region accounts for approximately 5% of the global NMOSD market, reflecting limited diagnosis rates and constrained access to specialized care. Gulf Cooperation Council countries lead regional adoption due to better healthcare funding, availability of biologics, and specialist centers. In contrast, parts of Africa face significant gaps in awareness, diagnostic testing, and reimbursement. Ongoing investments in tertiary care hospitals, physician education initiatives, and gradual expansion of rare disease policies are expected to improve diagnosis and treatment uptake over the forecast period.
Market Segmentations:
By Drug Class:
- Mood stabilizers
- Anticonvulsants
By Route of Administration:
- Oral
- Parenteral
By Mechanism of Action:
- Selective serotonin reuptake inhibitors
- Serotonin norepinephrine reuptake inhibitors
By Geography
- North America
- U.S.
- Canada
- Mexico
- Europe
- Germany
- France
- U.K.
- Italy
- Spain
- Rest of Europe
- Asia Pacific
- China
- Japan
- India
- South Korea
- South-east Asia
- Rest of Asia Pacific
- Latin America
- Brazil
- Argentina
- Rest of Latin America
- Middle East & Africa
- GCC Countries
- South Africa
- Rest of the Middle East and Africa
Competitive Landscape
The competitive landscape of the Neuromyelitis Optica Spectrum Disorder (NMOSD) market features including Bristol-Myers Squibb Company, Otsuka Holdings Co., Ltd., Pfizer Inc., Sumitomo Pharma America, Inc., AbbVie Inc., GSK plc, Teva Pharmaceutical Industries Ltd., Johnson & Johnson Services, Inc., Eli Lilly and Company, and AstraZeneca. The Neuromyelitis Optica Spectrum Disorder (NMOSD) market exhibits a competitive environment shaped by innovation intensity, targeted therapy development, and strong regulatory focus on rare neurological diseases. Market participants prioritize biologic therapies that address core immune mechanisms to reduce relapse risk and long-term disability. Competition centers on clinical efficacy, safety differentiation, dosing convenience, and long-term treatment sustainability. Companies actively strengthen their positions through expanded clinical programs, real-world evidence generation, and lifecycle management strategies. Strategic collaborations, licensing agreements, and geographic expansion support broader market access. Reimbursement alignment and physician education remain critical competitive levers, particularly in cost-sensitive regions. Overall, sustained investment in research, regulatory engagement, and patient-centric support programs continues to define competitive success in this specialized and rapidly evolving therapeutic landscape.
Key Player Analysis
- Bristol-Myers Squibb Company
- Otsuka Holdings Co., Ltd.
- Pfizer Inc.
- Sumitomo Pharma America, Inc.
- AbbVie Inc.
- GSK plc
- Teva Pharmaceutical Industries Ltd.
- Johnson & Johnson Services, Inc.
- Eli Lilly and Company
- AstraZeneca
Recent Developments
- In January 2025, Johnson & Johnson acquired Intra-Cellular Therapies, adding CAPLYTA (lumateperone) to its portfolio. This acquisition strengthens the company's position in the market, expanding treatment options for bipolar I and II depression.
- In October 2024, AbbVie and Gedeon Richter announced a new collaboration to discover and develop new targets for neuropsychiatric conditions. This partnership strengthens AbbVie's position in the market, focusing on developing new therapies for mood disorders.
- In January 2024, Thorlabs licensed Sensirion's patented Quantum Cascade Laser (QCL)-based dual-frequency-comb spectroscopy (DFCS) technology to develop new mid-infrared (Mid-IR) sensing platforms for environmental and industrial uses, combining high-speed, high-resolution capabilities for applications like gas sensing and chemical analysis.
Report Coverage
The research report offers an in-depth analysis based on Drug Class, Route of Administration, Mechanism of Action and Geography. It details leading market players, providing an overview of their business, product offerings, investments, revenue streams, and key applications. Additionally, the report includes insights into the competitive environment, SWOT analysis, current market trends, as well as the primary drivers and constraints. Furthermore, it discusses various factors that have driven market expansion in recent years. The report also explores market dynamics, regulatory scenarios, and technological advancements that are shaping the industry. It assesses the impact of external factors and global economic changes on market growth. Lastly, it provides strategic recommendations for new entrants and established companies to navigate the complexities of the market.
Future Outlook
- Targeted biologic therapies will continue to gain prominence as standard-of-care options for long-term relapse prevention.
- Expanded use of advanced antibody testing will enable earlier diagnosis and more precise patient stratification.
- Treatment strategies will increasingly emphasize sustained disease control to limit cumulative neurological disability.
- Ongoing pipeline innovation will introduce therapies with improved safety profiles and more convenient dosing schedules.
- Real-world evidence will play a larger role in guiding clinical decisions and supporting reimbursement discussions.
- Patient-centric care models will strengthen adherence through education, monitoring, and support programs.
- Geographic expansion will improve access to NMOSD therapies in emerging and underserved markets.
- Regulatory frameworks for rare diseases will continue to encourage accelerated development and approval pathways.
- Digital health tools will support long-term disease monitoring and outcome assessment.
- Competitive differentiation will increasingly depend on clinical value, access strategies, and long-term patient outcomes.
Request a Free Sample
Fill in your details and we'll send you a free sample report.
- Sample data tables & charts
- Research methodology
Need a Custom Version of This Report?
Tailor the scope, geography, or segments to your exact requirements.
- Custom geography or segment scope
- Direct access to our analyst team
Frequently Asked Questions
What is the current market size for the Neuromyelitis Optica Spectrum Disorder (NMOSD) Market, and what is its projected size in 2032?
At what Compound Annual Growth Rate is the Neuromyelitis Optica Spectrum Disorder (NMOSD) Market projected to grow between 2024 and 2032?
Which Neuromyelitis Optica Spectrum Disorder (NMOSD) Market segment held the largest share in 2024?
What are the primary factors fueling the growth of the Neuromyelitis Optica Spectrum Disorder (NMOSD) Market?
Who are the leading companies in the Neuromyelitis Optica Spectrum Disorder (NMOSD) Market?
Which region commanded the largest share of the Neuromyelitis Optica Spectrum Disorder (NMOSD) Market in 2024?
Table of Content
Chapter 1. Report Introduction
- 1.1 Report Description & Purpose
- 1.1.1 Report Title & Market Definition
- 1.1.2 Unique Selling Propositions (USP) & Key Differentiators
- 1.1.3 Value Proposition for Stakeholders
- 1.2 Research Objectives
- 1.2.1 Market Sizing Objectives (Volume & Revenue)
- 1.2.2 Segmentation Objectives
- 1.2.3 Competitive Intelligence Objectives
- 1.2.4 Forecast & Scenario Objectives
- 1.3 Report Scope
- 1.3.1 Neuromyelitis Optica Spectrum Disorder (NMOSD) Scope – Types & Subtypes Covered
- 1.3.2 Geographic Scope – Regions & Countries Covered
- 1.3.3 Historical Period, Base Year & Forecast Period (2024; forecast to 2032)
- 1.3.4 Inclusions & Exclusions
- 1.4 HS Code & Classification Framework
- 1.5 Currency, Units & Pricing Basis
- 1.6 Target Stakeholders
- 1.7 Limitations & Assumptions
Chapter 2. Executive Summary
- 2.1 Global Neuromyelitis Optica Spectrum Disorder (NMOSD) Market Snapshot
- 2.1.1 Market Size – Historical (2024) & Forecast (2024-2032) (2024: USD 2,341 million → 2032: USD 4,397.91 million)
- 2.1.2 Volume & Revenue – Global Totals
- 2.1.3 Key Market Highlights – Top Five Facts
- 2.2 Neuromyelitis Optica Spectrum Disorder (NMOSD) Market Segmentation Snapshot
- 2.2.1 Market Split by Region – 2024 vs. 2032
- 2.3 Competitive Snapshot
- 2.3.1 Top 10 Players by Revenue Share – 2024
- 2.3.2 Top 10 Players by Volume Share – 2024
- 2.3.3 Recent Strategic Developments (18-Month Summary)
- 2.4 Key Investment Highlights & Strategic Conclusions
Chapter 3. Neuromyelitis Optica Spectrum Disorder (NMOSD) Market Dynamics & Industry Analysis
- 3.1 Market Overview & Context
- 3.1.1 Neuromyelitis Optica Spectrum Disorder (NMOSD) Market Position in the Broader Automotive Value Chain
- 3.1.2 OEM vs. Replacement Market Dynamics
- 3.1.3 Market Maturity & Development Stage by Region
- 3.2 Neuromyelitis Optica Spectrum Disorder (NMOSD) Market Drivers
- 3.3 Neuromyelitis Optica Spectrum Disorder (NMOSD) Market Restraints & Challenges
- 3.4 Neuromyelitis Optica Spectrum Disorder (NMOSD) Market Opportunities
- 3.5 Porter's Five Forces Analysis
- 3.5.1 Threat of New Entrants
- 3.5.2 Bargaining Power of Suppliers
- 3.5.3 Bargaining Power of Buyers
- 3.5.4 Threat of Substitutes
- 3.5.5 Competitive Rivalry – Intensity Assessment
- 3.6 Neuromyelitis Optica Spectrum Disorder (NMOSD) Value Chain Analysis
- 3.6.1 Upstream – Raw Material/Input Suppliers
- 3.6.1.1 Raw Material/Input 1
- 3.6.1.2 Raw Material/Input 2
- 3.6.1.3 Raw Material/Input 3
- 3.6.2 Midstream – Production/Manufacturing/Service Delivery
- 3.6.2.1 Production/Process Overview
- 3.6.2.2 Key Facility Locations & Capacity by Manufacturer
- 3.6.3 Downstream – Distribution & End Consumer
- 3.6.3.1 Primary Channel – B2B/OEM
- 3.6.3.2 Secondary Channels – Dealer, Retail, Online, Direct
- 3.6.4 Value Chain Profitability Analysis
- 3.6.1 Upstream – Raw Material/Input Suppliers
- 3.7 PESTEL Analysis
- 3.7.1 Political Factors
- 3.7.2 Economic Factors
- 3.7.3 Social Factors
- 3.7.4 Technological Factors
- 3.7.5 Environmental Factors
- 3.7.6 Legal Factors
- 3.8 Neuromyelitis Optica Spectrum Disorder (NMOSD) Supply Chain Analysis
- 3.8.1 Raw Material/Input Supply Risk Assessment
- 3.8.2 Manufacturing Concentration Risk (Geographic Exposure)
- 3.8.3 Trade Disruption Impact Analysis
- 3.9 Regulatory & Policy Landscape
Note: The regulatory and policy landscape section covers regulations based on their applicability to the market, Neuromyelitis Optica Spectrum Disorder (NMOSD) category, geography, and scope of the study. Only regulatory frameworks with a material impact on operations, compliance, trade, sustainability, or market access are analyzed in detail.
Chapter 4. Key Investment Pockets & Opportunity Analysis
- 4.1 Neuromyelitis Optica Spectrum Disorder (NMOSD) Market Attractiveness Analysis
- 4.1.1 By Region – Investment Attractiveness Matrix (Volume × CAGR)
- 4.2 Absolute Revenue Growth Opportunity
- 4.2.1 By Region – Absolute USD Growth Through 2032
- 4.3 Incremental Volume Opportunity
- 4.3.1 By Region – Incremental Volume Through 2032
- 4.3.2 Segment – Incremental Volume
- 4.4 Emerging Submarket Opportunity Deep Dive (Subject to Applicability)
- 4.5 Emerging Market Opportunity Scorecards
- 4.5.1 United States
- 4.5.2 Europe
- 4.5.3 Asia
- 4.5.4 Middle East & Africa
Note: Emerging Market Opportunity Scorecards will be included based on relevance and strategic importance. Regions listed are indicative and may vary depending on data availability and market dynamics.
Chapter 5. Neuromyelitis Optica Spectrum Disorder (NMOSD) Import-Export Analysis & Trade Flows
- 5.1 Global Trade Overview
- 5.1.1 Global Export Value by Country (2024)
- 5.1.2 Global Export Volume by Country (2024)
- 5.1.3 Global Import Value by Country (2024)
- 5.1.4 Global Import Volume by Country (2024)
- 5.1.5 Net Trade Balance by Country (2024)
- 5.2 Export Analysis – Segment
- 5.2.1 Type 1 (HS Code)
- 5.2.2 Type 2 (HS Code)
- 5.2.3 Type 3 (HS Code)
- 5.2.4 Type 4 (HS Code)
- 5.2.5 Type 5 (HS Code)
- 5.3 Import Analysis – Segment
- 5.3.1 Type 1 (HS Code)
- 5.3.2 Type 2 (HS Code)
- 5.3.3 Type 3 (HS Code)
- 5.3.4 Type 4 (HS Code)
- 5.3.5 Type 5 (HS Code)
- 5.4 Average Unit Trade Prices
- 5.4.1 Average Export Price – Segment & Country
- 5.4.2 Average Import Price – Segment & Source Country
- 5.4.3 Price Trends (2024)
- 5.5 Key Trade Route Analysis
- 5.5.1 Trade Route 1
- 5.5.2 Trade Route 2
- 5.5.3 Trade Route 3
- 5.5.4 Trade Route 4
- 5.5.5 Trade Route 5
- 5.6 Trade Policy Impact Assessment
- 5.6.1 US Anti-Dumping & Section 301 Tariffs
- 5.6.2 EU Customs Union Impact
- 5.6.3 Major Free Trade Agreements
- 5.6.4 USMCA Rules of Origin
Note: Trade policy analysis will be included only where relevant to the Neuromyelitis Optica Spectrum Disorder (NMOSD) market.
Chapter 6. Competitive Landscape & Company Benchmarking
- 6.1 Neuromyelitis Optica Spectrum Disorder (NMOSD) Market Concentration & Structure
- 6.1.1 Herfindahl-Hirschman Index (HHI) – vs. 2024
- 6.1.2 Tier 1, Tier 2 & Tier 3 Market Structure
- 6.1.3 Global, Regional & Local Player Dynamics
- 6.2 Neuromyelitis Optica Spectrum Disorder (NMOSD) Market Share Analysis – 2024
- 6.2.1 Global Revenue Share by Company
- 6.2.2 Global Volume Share by Company
- 6.2.3 Regional Revenue Share
- 6.2.4 Market Share Evolution ( vs. 2024)
- 6.2.5 OEM Segment Share by Company
- 6.2.6 Replacement Segment Share by Company
- 6.3 Production/Delivery Capacity & Facility Analysis
- 6.3.1 Global Installed Capacity
- 6.3.2 Capacity Utilization Rates
- 6.3.3 Production/Output Volume
- 6.3.4 Facility Locations & Capacity Map
- 6.3.5 Planned Capacity Additions
- 6.4 Neuromyelitis Optica Spectrum Disorder (NMOSD) Competitive Benchmarking Matrix
- 6.4.1 Revenue, Volume, CAGR & Profitability Comparison
- 6.4.2 Channel Revenue Mix
- 6.4.3 Geographic Revenue Exposure
- 6.4.4 R&D Intensity
- 6.4.5 Sustainability Maturity
- 6.5 Strategic Developments in Neuromyelitis Optica Spectrum Disorder (NMOSD) (Last 24 Months)
- 6.5.1 Mergers, Acquisitions & Divestments
- 6.5.2 New Neuromyelitis Optica Spectrum Disorder (NMOSD) Launches
- 6.5.3 Facility Expansions
- 6.5.4 Strategic Alliances, Joint Ventures & Partnerships
- 6.5.5 Distribution Expansion & Market Entry
- 6.5.6 Sustainability & ESG Initiatives
- 6.6 Competitive Strategy Mapping
- 6.6.1 Leader, Challenger, Follower & Niche Classification
- 6.6.2 Pricing Strategy Comparison
- 6.6.3 Channel Strategy Matrix
Note: Strategic developments are included based on their materiality and the availability of reliable information.
Chapter 7. Global Neuromyelitis Optica Spectrum Disorder (NMOSD) Market – By Distribution Channel
- 7.1 Segment Overview
- 7.1.1 Volume & Revenue Split by Channel (2024 & 2032)
- 7.1.2 Channel Mix Evolution (2024-2032)
Chapter 8. Regional Market Analysis – Global Overview
- 8.1 Global Regional Overview
- 8.1.1 Regional Volume Share
- 8.1.2 Regional Revenue Share
- 8.1.3 Regional Volume by Region
- 8.1.4 Regional Revenue by Region
- 8.1.5 Regional Forecast Through 2032
- 8.2 Cross-Regional Segment Analysis
- 8.2.1 By Distribution Channel
- 8.2.2 By Brand/Price Tier
Chapter 9. North America Neuromyelitis Optica Spectrum Disorder (NMOSD) Market
- 9.1 United States
- 9.2 Canada
- 9.3 Mexico
Chapter 10. Europe Neuromyelitis Optica Spectrum Disorder (NMOSD) Market
- 10.1 Germany
- 10.2 France
- 10.3 Italy
- 10.4 United Kingdom
- 10.5 Spain
- 10.6 Poland
- 10.7 Russia
- 10.8 Netherlands
- 10.9 Belgium
- 10.10 Sweden
- 10.11 Denmark
- 10.12 Norway
- 10.13 Rest of Europe
Chapter 11. Asia Pacific Neuromyelitis Optica Spectrum Disorder (NMOSD) Market
- 11.1 China
- 11.2 India
- 11.3 Japan
- 11.4 South Korea
- 11.5 Thailand
- 11.6 Indonesia
- 11.7 Vietnam
- 11.8 Malaysia
- 11.9 Australia
- 11.10 Rest of Asia Pacific
Chapter 12. Latin America Neuromyelitis Optica Spectrum Disorder (NMOSD) Market
- 12.1 Brazil
- 12.2 Argentina
- 12.3 Colombia
- 12.4 Chile
- 12.5 Rest of Latin America
Chapter 13. Middle East Neuromyelitis Optica Spectrum Disorder (NMOSD) Market
- 13.1 Saudi Arabia
- 13.2 United Arab Emirates
- 13.3 Turkey
- 13.4 Israel
- 13.5 Iran
- 13.6 Rest of the Middle East
Chapter 14. Africa Neuromyelitis Optica Spectrum Disorder (NMOSD) Market
- 14.1 South Africa
- 14.2 Egypt
- 14.3 Nigeria
- 14.4 Morocco
- 14.5 Rest of Africa
Chapter 15. Neuromyelitis Optica Spectrum Disorder (NMOSD) Company Profiles
- 15.1 [Company 01]
- 15.1.1 Company Overview
- 15.1.2 Key Management Personnel
- 15.1.3 Products & Services Portfolio
- 15.1.4 Financial Performance
- 15.1.5 Key Market Focus & Geographic Presence
- 15.1.6 Recent Developments & Strategic Initiatives
Note: The company profile list is preliminary and may change based on research findings, market developments, data availability, and client requirements.
Chapter 16. Appendices
- Appendix A – List of Abbreviations & Acronyms
- Appendix B – Industry Classification Code Reference – Full Series
- Appendix C – Production & Capacity Data Tables
- Appendix D – End-Use & Demand Base Tables
- Appendix E – Consumption & Replacement Rate Assumptions
- Appendix F – ASP Reference Tables
- Appendix G – Manufacturing & Facility Database
- Appendix H – Import-Export Data Tables
- Appendix I – Regulatory Summary Tables
- Appendix J – Primary Research Participant List (Anonymized)
- Appendix K – Primary Research Questionnaire Framework
- Appendix L – Data Sources & Bibliography
- Appendix M – Market Size Divergence & Source Comparison
Chapter 17. Research Methodology
- 17.1 Research Framework & Philosophy
- 17.2 Secondary Research – Sources, Hierarchy & Data Extraction
- 17.3 Data Modeling – Bottom-Up & Top-Down Market Sizing
- 17.4 Primary Research – Stakeholder Framework, LOI & Sample Sizes
- 17.5 Forecast Methodology – Regression, Scenario & Sensitivity Analysis
- 17.6 Quality Control – Four-Layer Validation Framework
- 17.7 Limitations & Standard Assumptions
- 17.8 Disclaimer
