
Market Overview
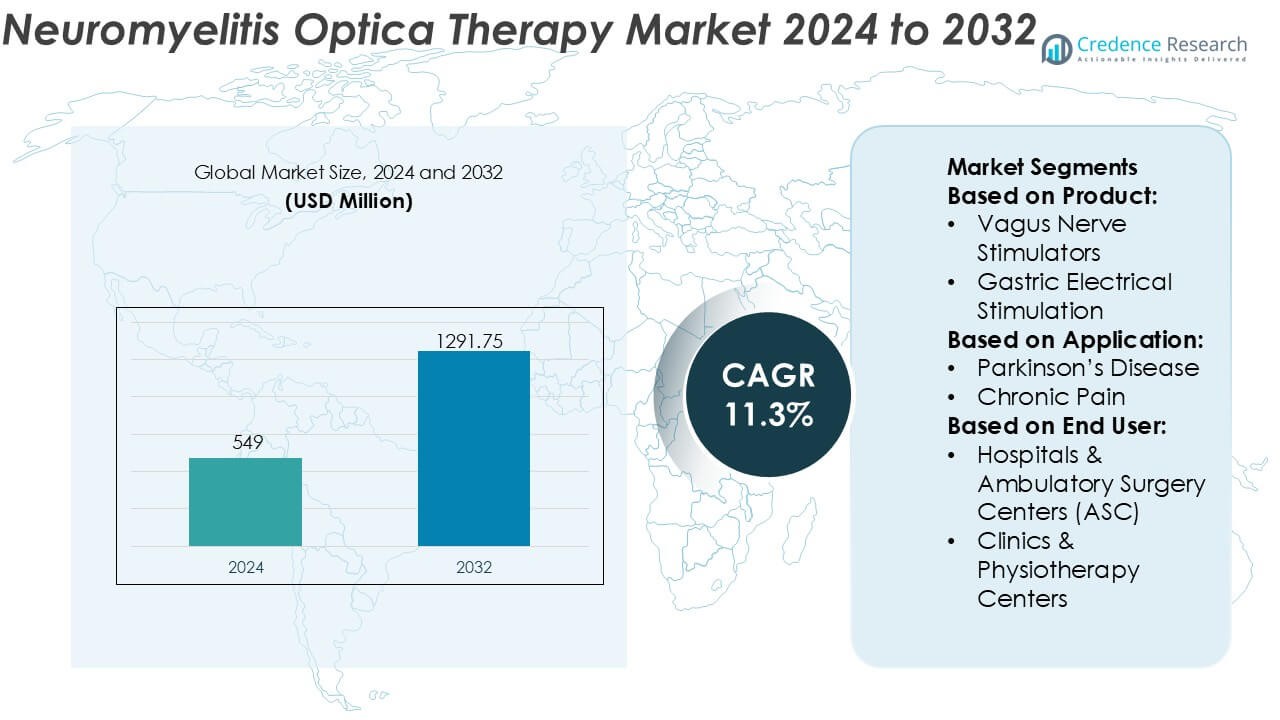
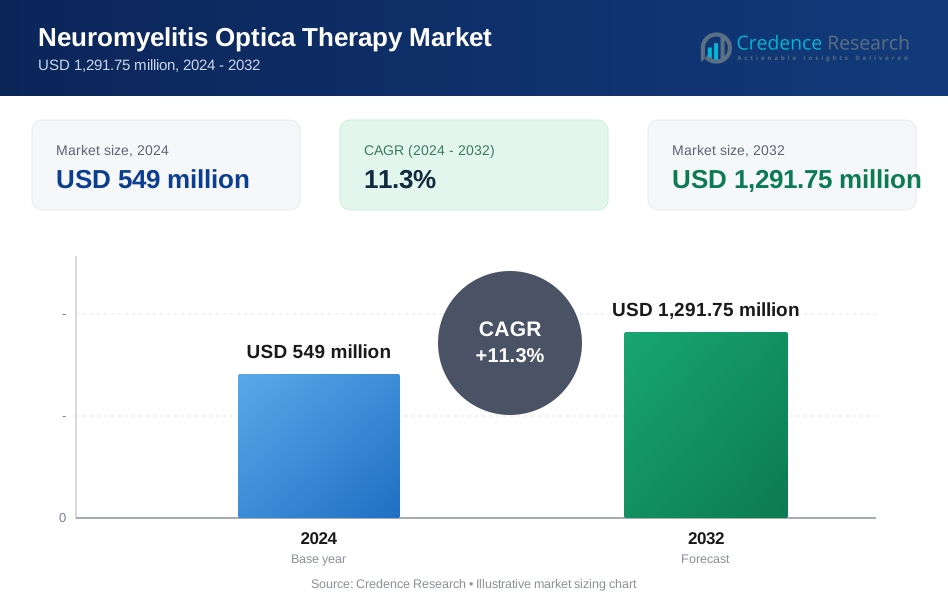
Neuromyelitis Optica Therapy Market size was valued USD 549 million in 2024 and is anticipated to reach USD 1291.75 million by 2032, at a CAGR of 11.3% during the forecast period.
| REPORT ATTRIBUTE | DETAILS |
|---|---|
| Historical Period | 2020-2023 |
| Base Year | 2024 |
| Forecast Period | 2025-2032 |
| Neuromyelitis Optica Therapy Market Size 2024 | USD 549 Million |
| Neuromyelitis Optica Therapy Market, CAGR | 11.3% |
| Neuromyelitis Optica Therapy Market Size 2032 | USD 1291.75 Million |
The Neuromyelitis Optica Therapy Market is led by a concentrated group of established pharmaceutical players with strong expertise in rare autoimmune and neurological disorders. These companies compete through differentiated monoclonal antibodies, robust late-stage pipelines, and continued investment in real-world evidence to support long-term relapse prevention and disability reduction. Strategic priorities focus on expanding approved indications, optimizing dosing regimens, and strengthening market access through rare-disease reimbursement frameworks. Regionally, North America dominates the market with an exact 41% share, supported by advanced diagnostic capabilities, early adoption of targeted biologics, and favorable reimbursement structures. Strong specialist awareness and early regulatory approvals further reinforce the region’s leadership position.
Market Insights
- The Neuromyelitis Optica Therapy Market was valued at USD 549 million in 2024 and is projected to reach USD 1291.75 million by 2032, expanding at a CAGR of 11.3%, driven by rising adoption of disease-specific biologic therapies.
- Strong market growth is supported by increasing diagnosis rates, wider availability of aquaporin-4 antibody testing, and clinical preference for targeted monoclonal antibodies, which account for an estimated 68% share due to superior relapse prevention outcomes.
- Ongoing market trends include early-line biologic use, longer dosing intervals, and greater reliance on real-world evidence to support reimbursement and long-term therapy continuation.
- The competitive landscape remains concentrated, with leading players focusing on pipeline expansion, lifecycle management, and global regulatory approvals to strengthen positioning in rare-disease treatment frameworks.
- Regionally, North America leads with an exact 41% share, supported by advanced neurology infrastructure and reimbursement access, while Asia-Pacific shows accelerating growth through improving awareness and healthcare investment.
Market Segmentation Analysis:
By Product
The product segment reflects strong adoption of implantable neuromodulation systems, with Spinal Cord Stimulators emerging as the dominant sub-segment, accounting for approximately 34% market share. Their leadership stems from proven efficacy in managing refractory neuropathic pain, spinal inflammation–related symptoms, and autonomic dysfunction associated with neuromyelitis optica. Continuous advances in multi-contact leads, rechargeable implantable pulse generators, and MRI-conditional designs enhance clinical flexibility and patient safety. Vagus Nerve Stimulators and Deep Brain Stimulators follow, driven by expanding neurological indications, while sacral and gastric electrical stimulation remain niche options addressing specific autonomic complications.
- For instance, Nevro Corporation’s HFX™ spinal cord stimulation platform delivers therapy at a fixed frequency of 10,000 Hz and is supported by the SENZA randomized controlled trial that enrolled 198 patients with chronic back and leg pain, with sustained outcomes reported over 24 months using a fully implantable, rechargeable pulse generator rated for 10-year battery longevity.
By Application
By application, Chronic Pain represents the dominant sub-segment with an estimated 29% share, supported by the high prevalence of severe, treatment-resistant pain in neuromyelitis optica patients. Neuromodulation offers sustained symptom control where pharmacological therapies show limited effectiveness or tolerability. Tremor and Epilepsy applications contribute steadily due to overlapping neuroinflammatory pathways and comorbidities. Interest in Depression and Migraine management is rising as clinicians adopt holistic approaches to improve quality of life. Broader recognition of neuromodulation’s role in managing secondary neurological symptoms continues to expand application scope.
- For instance, Abbott’s Proclaim™ XR spinal cord stimulation system delivers BurstDR™ stimulation with a pulse width of 1,000 microseconds and operates on a recharge-free implantable pulse generator designed for a functional life of up to 10 years, reducing patient maintenance burden.
By End-user
Among end users, Hospitals & Ambulatory Surgery Centers (ASC) dominate with around 41% market share, driven by their advanced surgical infrastructure, access to multidisciplinary neurology teams, and ability to manage complex implant procedures. High procedure volumes, post-implant monitoring capabilities, and reimbursement alignment further strengthen hospital adoption. Clinics & Physiotherapy Centers show growing participation, particularly for device programming, follow-up care, and non-invasive neuromodulation support. The “others” category, including specialty neurology institutes, contributes modestly but benefits from increasing referrals for advanced neuromodulation-based therapy pathways.
Key Growth Drivers
Rising Adoption of Targeted Biologic Therapies
The Neuromyelitis Optica Therapy Market benefits from increasing adoption of targeted biologic therapies that address disease-specific immune pathways. Monoclonal antibodies targeting complement proteins, B-cells, and interleukin signaling demonstrate superior relapse prevention compared with conventional immunosuppressants. Clinicians increasingly favor these therapies due to strong clinical efficacy, predictable safety profiles, and reduced long-term disability risk. Regulatory approvals of disease-specific agents reinforce physician confidence and expand treatment eligibility. Growing clinical evidence supporting early biologic intervention further accelerates uptake across both newly diagnosed and refractory patient populations.
- For instance, electroCore, Inc. supports adjunctive, non-pharmacologic disease management through its gammaCore™ non-invasive vagus nerve stimulation platform, which delivers a 5 kHz electrical carrier wave modulated at 25 Hz over a 120-second treatment cycle, enabling targeted neuromodulation without systemic immunosuppression.
Improved Diagnostic Accuracy and Disease Awareness
Advancements in diagnostic technologies significantly support market growth. High-sensitivity aquaporin-4 antibody testing and improved MRI protocols enable earlier and more accurate differentiation of neuromyelitis optica from multiple sclerosis. Enhanced diagnostic clarity drives timely initiation of appropriate therapies, improving outcomes and reducing relapse severity. Awareness initiatives led by neurological societies and patient advocacy groups increase referral rates to specialists. Better recognition of NMOSD among general neurologists expands the treated patient pool and supports sustained demand for approved therapies.
- For instance, LivaNova PLC’s SenTiva™ Vagus Nerve Stimulation system incorporates a 30-second automated stimulation cycle with a programmable output current range from 0.25 mA to 3.5 mA, supporting precise neuromodulation titration for neurological symptom management following confirmed diagnosis.
Expanding Reimbursement and Market Access Frameworks
Favorable reimbursement policies in developed healthcare systems strengthen therapy adoption. Payers increasingly recognize NMOSD as a severe, disabling rare disease that requires long-term treatment coverage. Inclusion of biologics in national formularies and rare-disease reimbursement programs reduces patient out-of-pocket burden. Expanded access pathways, including hospital-based infusion coverage and specialty pharmacy distribution, improve treatment continuity. These factors collectively enhance therapy penetration and stabilize long-term revenue streams for market participants.
Key Trends & Opportunities
Shift Toward Early and Preventive Treatment Strategies
A key trend involves the transition from reactive relapse management to proactive, long-term relapse prevention. Clinical guidelines increasingly emphasize early initiation of targeted therapies following diagnosis. This approach reduces cumulative neurological damage and hospitalizations. Early-stage treatment adoption extends therapy duration per patient, increasing lifetime treatment value. The trend creates opportunities for manufacturers to position therapies as first-line options and invest in long-term outcome data supporting early intervention benefits.
- For instance, The Aquarius™ XT supports a total of 16 data channels, which typically include 10 dedicated pressure transducers. The remaining channels are utilized for electromyography (EMG), uroflowmetry, and infusion volume to provide a comprehensive assessment.
Pipeline Expansion and Next-Generation Immunotherapies
Robust pipeline activity presents strong growth opportunities. Developers advance next-generation biologics, including subcutaneous formulations, extended-dosing regimens, and therapies targeting novel immune mechanisms. These innovations aim to improve patient convenience, adherence, and safety. Ongoing clinical trials exploring combination and personalized therapy strategies further broaden future treatment possibilities. Pipeline diversification reduces reliance on single mechanisms of action and supports sustained innovation within the NMOSD therapeutic landscape.
- For instance, NeuroPace Inc. continues to expand its responsive neuromodulation pipeline through the RNS® System, a closed-loop platform capable of recording and responding to abnormal brain activity across 2 implantable leads with 4 contacts per lead, delivering stimulation within milliseconds of detected events.
Growing Focus on Emerging and Underserved Markets
Emerging economies offer significant untapped potential due to historically low diagnosis and treatment rates. Investments in neurology infrastructure, specialist training, and diagnostic access improve disease identification. Partnerships with regional distributors and government health programs facilitate biologic access. As awareness increases and reimbursement pathways evolve, these regions contribute incremental patient volumes and long-term market expansion opportunities.
Key Challenges
High Treatment Costs and Access Inequality
The high cost of biologic therapies remains a major challenge. Despite favorable reimbursement in select regions, many patients face restricted access due to budget constraints and coverage limitations. Cost pressures affect payer decision-making and may delay therapy initiation. In low- and middle-income regions, limited insurance coverage restricts biologic uptake. These disparities create uneven market penetration and require manufacturers to balance pricing strategies with access initiatives.
Long-Term Safety Monitoring and Treatment Adherence
NMOSD therapies often require chronic administration, raising concerns around long-term safety and adherence. Continuous immunosuppression increases infection risk, necessitating ongoing monitoring and patient education. Infusion-based treatments may burden healthcare systems and patients, affecting compliance. Managing safety expectations while maintaining adherence represents a persistent challenge. Addressing these issues requires improved delivery methods, real-world evidence generation, and comprehensive patient support programs.
Regional Analysis
North America
North America leads the Neuromyelitis Optica Therapy Market with an exact 41% share, supported by advanced diagnostic infrastructure and early adoption of targeted biologic therapies. High awareness among neurologists, widespread availability of aquaporin-4 antibody testing, and strong clinical guideline adherence drive timely treatment initiation. Favorable reimbursement frameworks and inclusion of NMOSD therapies in rare-disease coverage programs improve patient access. Robust clinical research activity and early regulatory approvals further strengthen market maturity, positioning North America as the primary revenue-generating region.
Europe
Europe accounts for an estimated 29% share of the Neuromyelitis Optica Therapy Market, driven by structured rare-disease policies and expanding access to biologics. Countries with well-established public healthcare systems support diagnosis through specialized neurology centers and centralized testing facilities. Increasing recognition of NMOSD as a distinct condition from multiple sclerosis improves treatment accuracy. Regional health technology assessments influence therapy adoption, emphasizing clinical value and long-term outcomes. Ongoing investments in neurology research and cross-border patient registries support steady market expansion.
Asia-Pacific
Asia-Pacific holds approximately 22% of the market and represents the fastest-growing regional opportunity. Rising disease awareness, improving access to advanced diagnostics, and expanding specialist networks drive patient identification. Japan, China, and South Korea lead regional adoption due to strong neurology expertise and gradual reimbursement expansion for rare diseases. Increasing healthcare expenditure and government support for biologics improve treatment availability. As diagnostic rates rise and access barriers decline, Asia-Pacific continues to contribute significant incremental patient volumes.
Latin America
Latin America represents around 5% of the Neuromyelitis Optica Therapy Market, characterized by uneven access across countries. Diagnosis rates improve in urban centers with specialized neurology services, while rural regions remain underserved. Limited reimbursement and high biologic costs constrain therapy uptake. However, public healthcare reforms, increased physician education, and partnerships with global pharmaceutical companies enhance access. Brazil and Mexico lead regional demand due to expanding specialty care infrastructure and growing rare-disease recognition.
Middle East & Africa
The Middle East & Africa region accounts for an estimated 3% share, reflecting early-stage market development. Limited awareness, diagnostic gaps, and restricted access to advanced therapies challenge growth. However, select Gulf countries demonstrate improving adoption supported by well-funded healthcare systems and access to specialty biologics. Investments in tertiary care hospitals and neurology training improve diagnosis rates. Over time, gradual expansion of insurance coverage and regional awareness initiatives are expected to support modest but steady market growth.
Market Segmentations:
By Product:
- Vagus Nerve Stimulators
- Gastric Electrical Stimulation
By Application:
- Parkinson’s Disease
- Chronic Pain
By End User:
- Hospitals & Ambulatory Surgery Centers (ASC)
- Clinics & Physiotherapy Centers
By Geography
- North America
- U.S.
- Canada
- Mexico
- Europe
- Germany
- France
- U.K.
- Italy
- Spain
- Rest of Europe
- Asia Pacific
- China
- Japan
- India
- South Korea
- South-east Asia
- Rest of Asia Pacific
- Latin America
- Brazil
- Argentina
- Rest of Latin America
- Middle East & Africa
- GCC Countries
- South Africa
- Rest of the Middle East and Africa
Competitive Landscape
The competitive landscape of the Neuromyelitis Optica Therapy Market players such as Nevro Corporation, Abbott, electroCore, Inc., LivaNova PLC, Axonics, Inc., Boston Scientific Corporation, Laborie, Neuropace Inc., Medtronic, Nexstim. The Neuromyelitis Optica Therapy Market features a concentrated yet evolving competitive landscape shaped by innovation in targeted immunotherapies and supportive neurological care solutions. Market participants compete through differentiated mechanisms of action, strong clinical efficacy in relapse prevention, and expanding real-world evidence supporting long-term disease control. Strategic focus areas include pipeline diversification, lifecycle management through new formulations, and optimization of treatment delivery to improve adherence. Companies also prioritize regulatory expansion into additional geographies and indications while strengthening reimbursement positioning in rare-disease frameworks. Increasing emphasis on early diagnosis, personalized treatment approaches, and multidisciplinary care models intensifies competition and drives continuous innovation across the NMOSD therapeutic ecosystem.
Key Player Analysis
- Nevro Corporation
- Abbott
- electroCore, Inc.
- LivaNova PLC
- Axonics, Inc.
- Boston Scientific Corporation
- Laborie
- Neuropace Inc.
- Medtronic
- Nexstim
Recent Developments
- In November 2025, Bharat Biotech launched Nucelion Therapeutics Pvt Ltd as a wholly-owned Contract Research, Development, and Manufacturing Organization (CRDMO) to focus on advanced cell and gene therapies, expanding beyond vaccines into next-generation biologics for complex diseases like cancers and genetic disorders, operating with independent leadership from Hyderabad.
- In November 2025, StemCyte International, a global cord blood bank, launched a novel "Public Bank Matching Protection Service" in Taiwan, working with Taishin Life to bridge life insurance with public cord blood banks, offering families greater access to life-saving transplants, especially important given the high cost and scarcity of matching units. This initiative leverages StemCyte's hybrid public/private model and Taishin's insurance reach to create a unique safety net for stem cell therapies.
- In July 2024, Mainstay Medical Holdings plc has received regulatory approvals in the European Union, the UK, and Australia for full-body MRI conditional labeling of the ReActiv8 Restorative Neurostimulation system.
- In February 2024, Boston Scientific Corporation announced that the U.S. FDA has approved an expanded indication for the WaveWriter SCS System, allowing it to be used for treating chronic low back and leg pain in individuals without a history of back surgery, commonly known as Non-Surgical Back Pain (NSBP).
Report Coverage
The research report offers an in-depth analysis based on Product, Application, End-User and Geography. It details leading market players, providing an overview of their business, product offerings, investments, revenue streams, and key applications. Additionally, the report includes insights into the competitive environment, SWOT analysis, current market trends, as well as the primary drivers and constraints. Furthermore, it discusses various factors that have driven market expansion in recent years. The report also explores market dynamics, regulatory scenarios, and technological advancements that are shaping the industry. It assesses the impact of external factors and global economic changes on market growth. Lastly, it provides strategic recommendations for new entrants and established companies to navigate the complexities of the market.
Future Outlook
- Targeted biologic therapies will increasingly become first-line treatment options for newly diagnosed patients.
- Early intervention strategies will gain wider clinical acceptance to reduce long-term neurological disability.
- Next-generation therapies with extended dosing intervals will improve patient adherence and convenience.
- Diagnostic advancements will continue to expand the identifiable and treated patient population.
- Personalized treatment approaches based on antibody status will strengthen clinical outcomes.
- Expanded reimbursement support will improve access across additional healthcare systems.
- Emerging markets will contribute incremental growth through improved awareness and infrastructure.
- Real-world evidence will play a larger role in therapy selection and guideline updates.
- Combination and sequential treatment strategies will receive greater clinical exploration.
- Multidisciplinary care models will shape holistic management of neuromyelitis optica.
Request a Free Sample
Fill in your details and we'll send you a free sample report.
- Sample data tables & charts
- Research methodology
Need a Custom Version of This Report?
Tailor the scope, geography, or segments to your exact requirements.
- Custom geography or segment scope
- Direct access to our analyst team
Frequently Asked Questions
What is the current market size for the Neuromyelitis Optica Therapy Market, and what is its projected size in 2032?
At what Compound Annual Growth Rate is the Neuromyelitis Optica Therapy Market projected to grow between 2024 and 2032?
Which Neuromyelitis Optica Therapy Market segment held the largest share in 2024?
What are the primary factors fueling the growth of the Neuromyelitis Optica Therapy Market?
Who are the leading companies in the Neuromyelitis Optica Therapy Market?
Which region commanded the largest share of the Neuromyelitis Optica Therapy Market in 2024?
Table of Content
Chapter 1. Report Introduction
- 1.1 Report Description & Purpose
- 1.1.1 Report Title & Market Definition
- 1.1.2 Unique Selling Propositions (USP) & Key Differentiators
- 1.1.3 Value Proposition for Stakeholders
- 1.2 Research Objectives
- 1.2.1 Market Sizing Objectives (Volume & Revenue)
- 1.2.2 Segmentation Objectives
- 1.2.3 Competitive Intelligence Objectives
- 1.2.4 Forecast & Scenario Objectives
- 1.3 Report Scope
- 1.3.1 Neuromyelitis Optica Therapy Scope – Types & Subtypes Covered
- 1.3.2 Geographic Scope – Regions & Countries Covered
- 1.3.3 Historical Period, Base Year & Forecast Period (2024; forecast to 2032)
- 1.3.4 Inclusions & Exclusions
- 1.4 HS Code & Classification Framework
- 1.5 Currency, Units & Pricing Basis
- 1.6 Target Stakeholders
- 1.7 Limitations & Assumptions
Chapter 2. Executive Summary
- 2.1 Global Neuromyelitis Optica Therapy Market Snapshot
- 2.1.1 Market Size – Historical (2024) & Forecast (2024-2032) (2024: USD 549 million → 2032: USD 1,291.75 million)
- 2.1.2 Volume & Revenue – Global Totals
- 2.1.3 Key Market Highlights – Top Five Facts
- 2.2 Neuromyelitis Optica Therapy Market Segmentation Snapshot
- 2.2.1 Market Split by Region – 2024 vs. 2032
- 2.3 Competitive Snapshot
- 2.3.1 Top 10 Players by Revenue Share – 2024
- 2.3.2 Top 10 Players by Volume Share – 2024
- 2.3.3 Recent Strategic Developments (18-Month Summary)
- 2.4 Key Investment Highlights & Strategic Conclusions
Chapter 3. Neuromyelitis Optica Therapy Market Dynamics & Industry Analysis
- 3.1 Market Overview & Context
- 3.1.1 Neuromyelitis Optica Therapy Market Position in the Broader Automotive Value Chain
- 3.1.2 OEM vs. Replacement Market Dynamics
- 3.1.3 Market Maturity & Development Stage by Region
- 3.2 Neuromyelitis Optica Therapy Market Drivers
- 3.3 Neuromyelitis Optica Therapy Market Restraints & Challenges
- 3.4 Neuromyelitis Optica Therapy Market Opportunities
- 3.5 Porter's Five Forces Analysis
- 3.5.1 Threat of New Entrants
- 3.5.2 Bargaining Power of Suppliers
- 3.5.3 Bargaining Power of Buyers
- 3.5.4 Threat of Substitutes
- 3.5.5 Competitive Rivalry – Intensity Assessment
- 3.6 Neuromyelitis Optica Therapy Value Chain Analysis
- 3.6.1 Upstream – Raw Material/Input Suppliers
- 3.6.1.1 Raw Material/Input 1
- 3.6.1.2 Raw Material/Input 2
- 3.6.1.3 Raw Material/Input 3
- 3.6.2 Midstream – Production/Manufacturing/Service Delivery
- 3.6.2.1 Production/Process Overview
- 3.6.2.2 Key Facility Locations & Capacity by Manufacturer
- 3.6.3 Downstream – Distribution & End Consumer
- 3.6.3.1 Primary Channel – B2B/OEM
- 3.6.3.2 Secondary Channels – Dealer, Retail, Online, Direct
- 3.6.4 Value Chain Profitability Analysis
- 3.6.1 Upstream – Raw Material/Input Suppliers
- 3.7 PESTEL Analysis
- 3.7.1 Political Factors
- 3.7.2 Economic Factors
- 3.7.3 Social Factors
- 3.7.4 Technological Factors
- 3.7.5 Environmental Factors
- 3.7.6 Legal Factors
- 3.8 Neuromyelitis Optica Therapy Supply Chain Analysis
- 3.8.1 Raw Material/Input Supply Risk Assessment
- 3.8.2 Manufacturing Concentration Risk (Geographic Exposure)
- 3.8.3 Trade Disruption Impact Analysis
- 3.9 Regulatory & Policy Landscape
Note: The regulatory and policy landscape section covers regulations based on their applicability to the market, Neuromyelitis Optica Therapy category, geography, and scope of the study. Only regulatory frameworks with a material impact on operations, compliance, trade, sustainability, or market access are analyzed in detail.
Chapter 4. Key Investment Pockets & Opportunity Analysis
- 4.1 Neuromyelitis Optica Therapy Market Attractiveness Analysis
- 4.1.1 By Region – Investment Attractiveness Matrix (Volume × CAGR)
- 4.2 Absolute Revenue Growth Opportunity
- 4.2.1 By Region – Absolute USD Growth Through 2032
- 4.3 Incremental Volume Opportunity
- 4.3.1 By Region – Incremental Volume Through 2032
- 4.3.2 Segment – Incremental Volume
- 4.4 Emerging Submarket Opportunity Deep Dive (Subject to Applicability)
- 4.5 Emerging Market Opportunity Scorecards
- 4.5.1 United States
- 4.5.2 Europe
- 4.5.3 Asia
- 4.5.4 Middle East & Africa
Note: Emerging Market Opportunity Scorecards will be included based on relevance and strategic importance. Regions listed are indicative and may vary depending on data availability and market dynamics.
Chapter 5. Neuromyelitis Optica Therapy Import-Export Analysis & Trade Flows
- 5.1 Global Trade Overview
- 5.1.1 Global Export Value by Country (2024)
- 5.1.2 Global Export Volume by Country (2024)
- 5.1.3 Global Import Value by Country (2024)
- 5.1.4 Global Import Volume by Country (2024)
- 5.1.5 Net Trade Balance by Country (2024)
- 5.2 Export Analysis – Segment
- 5.2.1 Type 1 (HS Code)
- 5.2.2 Type 2 (HS Code)
- 5.2.3 Type 3 (HS Code)
- 5.2.4 Type 4 (HS Code)
- 5.2.5 Type 5 (HS Code)
- 5.3 Import Analysis – Segment
- 5.3.1 Type 1 (HS Code)
- 5.3.2 Type 2 (HS Code)
- 5.3.3 Type 3 (HS Code)
- 5.3.4 Type 4 (HS Code)
- 5.3.5 Type 5 (HS Code)
- 5.4 Average Unit Trade Prices
- 5.4.1 Average Export Price – Segment & Country
- 5.4.2 Average Import Price – Segment & Source Country
- 5.4.3 Price Trends (2024)
- 5.5 Key Trade Route Analysis
- 5.5.1 Trade Route 1
- 5.5.2 Trade Route 2
- 5.5.3 Trade Route 3
- 5.5.4 Trade Route 4
- 5.5.5 Trade Route 5
- 5.6 Trade Policy Impact Assessment
- 5.6.1 US Anti-Dumping & Section 301 Tariffs
- 5.6.2 EU Customs Union Impact
- 5.6.3 Major Free Trade Agreements
- 5.6.4 USMCA Rules of Origin
Note: Trade policy analysis will be included only where relevant to the Neuromyelitis Optica Therapy market.
Chapter 6. Competitive Landscape & Company Benchmarking
- 6.1 Neuromyelitis Optica Therapy Market Concentration & Structure
- 6.1.1 Herfindahl-Hirschman Index (HHI) – vs. 2024
- 6.1.2 Tier 1, Tier 2 & Tier 3 Market Structure
- 6.1.3 Global, Regional & Local Player Dynamics
- 6.2 Neuromyelitis Optica Therapy Market Share Analysis – 2024
- 6.2.1 Global Revenue Share by Company
- 6.2.2 Global Volume Share by Company
- 6.2.3 Regional Revenue Share
- 6.2.4 Market Share Evolution ( vs. 2024)
- 6.2.5 OEM Segment Share by Company
- 6.2.6 Replacement Segment Share by Company
- 6.3 Production/Delivery Capacity & Facility Analysis
- 6.3.1 Global Installed Capacity
- 6.3.2 Capacity Utilization Rates
- 6.3.3 Production/Output Volume
- 6.3.4 Facility Locations & Capacity Map
- 6.3.5 Planned Capacity Additions
- 6.4 Neuromyelitis Optica Therapy Competitive Benchmarking Matrix
- 6.4.1 Revenue, Volume, CAGR & Profitability Comparison
- 6.4.2 Channel Revenue Mix
- 6.4.3 Geographic Revenue Exposure
- 6.4.4 R&D Intensity
- 6.4.5 Sustainability Maturity
- 6.5 Strategic Developments in Neuromyelitis Optica Therapy (Last 24 Months)
- 6.5.1 Mergers, Acquisitions & Divestments
- 6.5.2 New Neuromyelitis Optica Therapy Launches
- 6.5.3 Facility Expansions
- 6.5.4 Strategic Alliances, Joint Ventures & Partnerships
- 6.5.5 Distribution Expansion & Market Entry
- 6.5.6 Sustainability & ESG Initiatives
- 6.6 Competitive Strategy Mapping
- 6.6.1 Leader, Challenger, Follower & Niche Classification
- 6.6.2 Pricing Strategy Comparison
- 6.6.3 Channel Strategy Matrix
Note: Strategic developments are included based on their materiality and the availability of reliable information.
Chapter 7. Global Neuromyelitis Optica Therapy Market – By Distribution Channel
- 7.1 Segment Overview
- 7.1.1 Volume & Revenue Split by Channel (2024 & 2032)
- 7.1.2 Channel Mix Evolution (2024-2032)
Chapter 8. Regional Market Analysis – Global Overview
- 8.1 Global Regional Overview
- 8.1.1 Regional Volume Share
- 8.1.2 Regional Revenue Share
- 8.1.3 Regional Volume by Region
- 8.1.4 Regional Revenue by Region
- 8.1.5 Regional Forecast Through 2032
- 8.2 Cross-Regional Segment Analysis
- 8.2.1 By Distribution Channel
- 8.2.2 By Brand/Price Tier
Chapter 9. North America Neuromyelitis Optica Therapy Market
- 9.1 United States
- 9.2 Canada
- 9.3 Mexico
Chapter 10. Europe Neuromyelitis Optica Therapy Market
- 10.1 Germany
- 10.2 France
- 10.3 Italy
- 10.4 United Kingdom
- 10.5 Spain
- 10.6 Poland
- 10.7 Russia
- 10.8 Netherlands
- 10.9 Belgium
- 10.10 Sweden
- 10.11 Denmark
- 10.12 Norway
- 10.13 Rest of Europe
Chapter 11. Asia Pacific Neuromyelitis Optica Therapy Market
- 11.1 China
- 11.2 India
- 11.3 Japan
- 11.4 South Korea
- 11.5 Thailand
- 11.6 Indonesia
- 11.7 Vietnam
- 11.8 Malaysia
- 11.9 Australia
- 11.10 Rest of Asia Pacific
Chapter 12. Latin America Neuromyelitis Optica Therapy Market
- 12.1 Brazil
- 12.2 Argentina
- 12.3 Colombia
- 12.4 Chile
- 12.5 Rest of Latin America
Chapter 13. Middle East Neuromyelitis Optica Therapy Market
- 13.1 Saudi Arabia
- 13.2 United Arab Emirates
- 13.3 Turkey
- 13.4 Israel
- 13.5 Iran
- 13.6 Rest of the Middle East
Chapter 14. Africa Neuromyelitis Optica Therapy Market
- 14.1 South Africa
- 14.2 Egypt
- 14.3 Nigeria
- 14.4 Morocco
- 14.5 Rest of Africa
Chapter 15. Neuromyelitis Optica Therapy Company Profiles
- 15.1 [Company 01]
- 15.1.1 Company Overview
- 15.1.2 Key Management Personnel
- 15.1.3 Products & Services Portfolio
- 15.1.4 Financial Performance
- 15.1.5 Key Market Focus & Geographic Presence
- 15.1.6 Recent Developments & Strategic Initiatives
Note: The company profile list is preliminary and may change based on research findings, market developments, data availability, and client requirements.
Chapter 16. Appendices
- Appendix A – List of Abbreviations & Acronyms
- Appendix B – Industry Classification Code Reference – Full Series
- Appendix C – Production & Capacity Data Tables
- Appendix D – End-Use & Demand Base Tables
- Appendix E – Consumption & Replacement Rate Assumptions
- Appendix F – ASP Reference Tables
- Appendix G – Manufacturing & Facility Database
- Appendix H – Import-Export Data Tables
- Appendix I – Regulatory Summary Tables
- Appendix J – Primary Research Participant List (Anonymized)
- Appendix K – Primary Research Questionnaire Framework
- Appendix L – Data Sources & Bibliography
- Appendix M – Market Size Divergence & Source Comparison
Chapter 17. Research Methodology
- 17.1 Research Framework & Philosophy
- 17.2 Secondary Research – Sources, Hierarchy & Data Extraction
- 17.3 Data Modeling – Bottom-Up & Top-Down Market Sizing
- 17.4 Primary Research – Stakeholder Framework, LOI & Sample Sizes
- 17.5 Forecast Methodology – Regression, Scenario & Sensitivity Analysis
- 17.6 Quality Control – Four-Layer Validation Framework
- 17.7 Limitations & Standard Assumptions
- 17.8 Disclaimer
