Market Overview
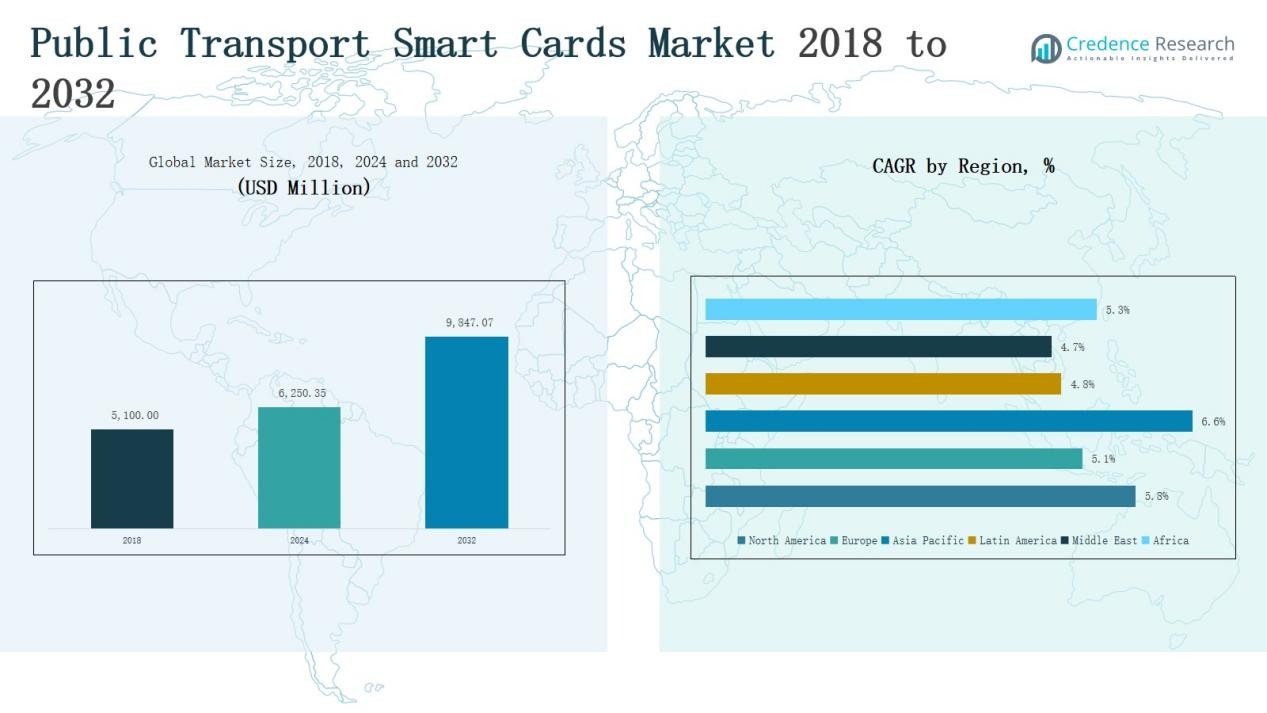
Public Transport Smart Cards Market size was valued at USD 5,100.00 million in 2018 to USD 6,250.35 million in 2024 and is anticipated to reach USD 9,847.07 million by 2032, at a CAGR of 5.89% during the forecast period.
| REPORT ATTRIBUTE |
DETAILS |
| Historical Period |
2020-2023 |
| Base Year |
2024 |
| Forecast Period |
2025-2032 |
| Public Transport Smart Cards Market Size 2024 |
USD 6,250.35 Million |
| Public Transport Smart Cards Market, CAGR |
5.89% |
| Public Transport Smart Cards Market Size 2032 |
USD 9,847.07 Million |
The Public Transport Smart Cards Market is shaped by prominent players such as American Express, Oberthur Technologies S.A., CPI Card Group Inc., Atos SE, Giesecke & Devrient GmbH, Infineon Technologies, and NXP Semiconductors N.V. These companies focus on delivering secure, scalable, and technologically advanced smart card solutions, leveraging strong global networks and partnerships with transit authorities to enhance adoption. Strategies emphasize innovation in microcontroller-based cards, integration with digital wallets, and expansion into emerging regions. Among regional markets, Asia Pacific emerged as the leader with a 44% market share in 2024, driven by large-scale deployments in China, India, and Japan, alongside significant government investments in metro and bus rapid transit systems.
Access crucial information at unmatched prices!
Request your sample report today & start making informed decisions powered by Credence Research Inc.!
Download Sample
Market Insights
- The Public Transport Smart Cards Market grew from USD 5,100.00 million in 2018 to USD 6,250.35 million in 2024 and is projected to reach USD 9,847.07 million by 2032.
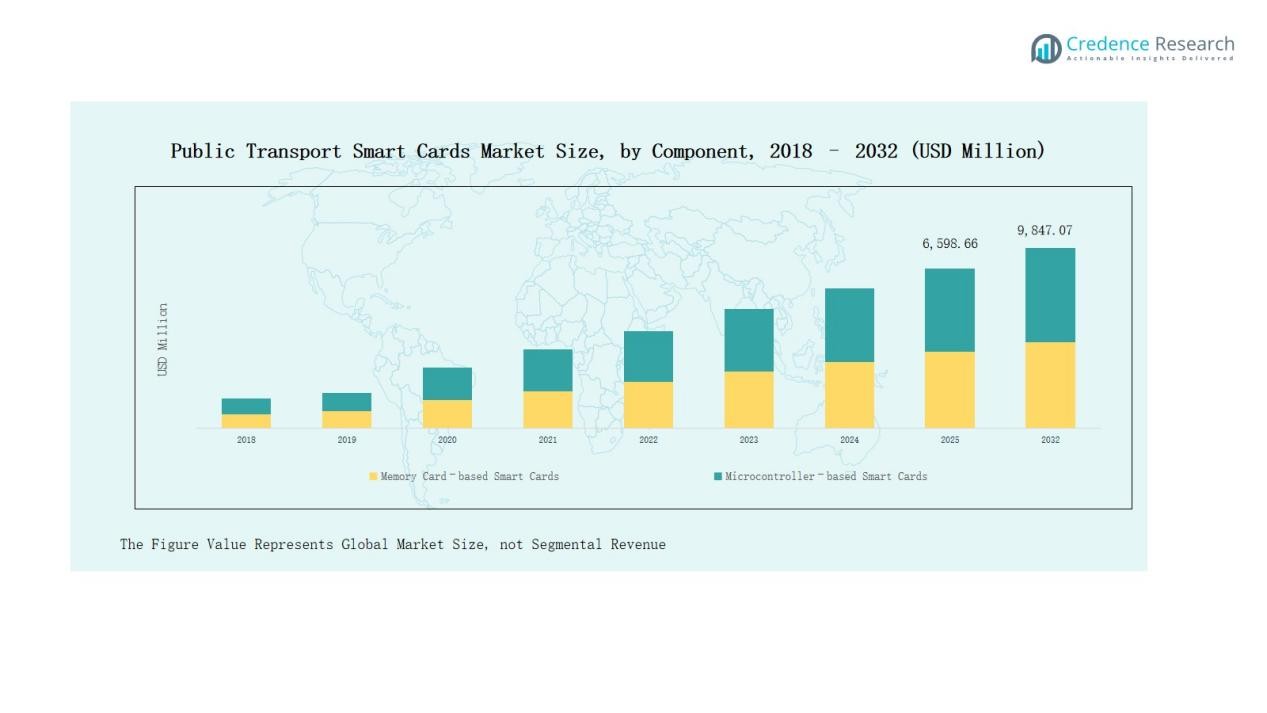
- Microcontroller-based smart cards held over 60% share in 2024, supported by advanced security, encryption, and multi-application capabilities, while memory-based cards maintained around 40% share.
- Contactless smart cards accounted for nearly 55–60% of revenue in 2024, driven by speed, convenience, and hygiene factors, with hybrid cards gaining traction for compatibility.
- The train segment dominated mode-of-transport revenue, followed by buses, with metro and other modes contributing smaller but growing shares, especially in urbanized regions.
- Asia Pacific led the global market with a 44% share in 2024, supported by large-scale transit deployments in China, India, and Japan, and rapid urbanization.
Market Segment Insights
By Component
The microcontroller-based smart cards dominate the component segment, accounting for over 60% of the market share. Memory card-based smart cards hold the remainder (roughly 40%) in 2023-2024. Microcontroller cards win because they deliver advanced security, support multi-application functions, and enable encryption, which matter in transit systems with high fraud risk. Memory-based cards remain viable where cost and simplicity matter, such as in feeder buses or low-traffic routes.
- For instance, Infineon Technologies released the SLC38 security cryptocontroller, which includes a symmetric cryptographic coprocessor for AES calculations.
By Interface
In the interface category, contactless smart cards are the dominant sub-segment, representing roughly 55-60% of market revenue share. Contact smart (chip/swipe) cards lag behind due to slower transactions and worse user experience, especially in busy transit hubs. Dual-interface / hybrid cards are growing, as agencies seek to maintain compatibility with older systems while introducing contactless convenience. Drivers for contactless include speed (“tap and go”), ease of maintenance, and elevated hygiene concerns.
- For instance, HID Global introduced its HID FARGO INK1000 printer designed to issue dual-interface smart cards, catering to organizations moving toward hybrid systems.
By Mode of Transport
The train segment (including heavy rail and commuter rail) holds the largest revenue share in mode-of-transport, followed closely by buses. Light Rail / Metro and “Others” (trams, ferries etc.) share smaller portions. Train systems dominate because fare volumes are high, stations involve many entry/exit points, and the cost of fare evasion is high. Buses lead in unit installations (more routes, more vehicles), particularly in emerging cities where bus networks scale faster. Light Rail / Metro show fast growth where capital investment supports modernization.
Key Growth Drivers
Rising Urbanization and Public Transit Adoption
Rapid urban population growth is driving greater reliance on public transportation systems worldwide. Cities are investing heavily in integrated ticketing platforms to improve convenience and reduce congestion. Smart cards simplify fare collection, enhance system efficiency, and promote seamless travel across multiple modes of transport. With millions of daily commuters in metropolitan hubs, the demand for secure, scalable, and interoperable fare systems continues to rise, establishing smart cards as a cornerstone of modern urban mobility infrastructure.
- For instance, Hong Kong’s MTR Corporation reported that its Octopus smart card handled over 15 million daily transactions across transport and retail, highlighting its role in easing urban mobility.
Increasing Demand for Contactless Payment Solutions
Commuter preferences are shifting toward fast, hygienic, and secure transactions, especially after the pandemic. Contactless smart cards meet these expectations by enabling quick “tap and go” experiences that cut waiting times. Transit authorities are accelerating adoption of NFC-enabled systems to meet this demand. The reduced need for physical interaction and cash handling not only boosts operational efficiency but also builds commuter confidence, making contactless cards a vital driver of growth in the public transport payment ecosystem.
- For instance, in Portland, TriMet’s HOP card enables quick tap-and-go fare payments across multiple regional transit services, reducing wait times and physical interactions since its rollout.
Government Investments and Smart Mobility Programs
Governments worldwide are actively funding smart mobility and digital payment ecosystems to modernize transportation infrastructure. Public-private partnerships are strengthening adoption of smart card systems in both developed and emerging economies. Initiatives such as national identity-linked fare cards and unified ticketing platforms further promote scalability. These programs are designed to reduce fare evasion, improve transparency, and promote sustainable urban transit. Such institutional support provides a strong foundation for long-term growth in the public transport smart cards market.
Key Trends & Opportunities
Integration with Mobile and Digital Wallets
A major trend is the integration of smart cards with mobile payment platforms and digital wallets. Commuters increasingly prefer using smartphones or wearable devices for travel payments. This creates opportunities for hybrid solutions, combining physical smart cards with digital tokens to offer flexibility. Operators benefit from reduced issuance costs, while passengers enjoy greater convenience. The convergence of cards and apps also enables value-added services like loyalty programs, real-time travel updates, and personalized travel plans.
- For instance, Octopus Holdings Ltd. in Hong Kong introduced the “Octopus Mobile SIM” and wearable devices integrated with Octopus card functions, enabling seamless payments through both NFC cards and mobile apps.
Expansion in Emerging Markets
Emerging economies in Asia-Pacific, Latin America, and Africa present significant growth opportunities. Urban transit networks in these regions are expanding rapidly due to population growth and rising vehicle congestion. Adoption of smart card systems is still at an early stage, leaving room for large-scale deployments. International technology providers are collaborating with local governments to deliver affordable, scalable solutions. This expansion into untapped markets ensures long-term growth potential and opens new revenue streams for leading industry players.
- For instance, in India, the government’s digitalization initiatives have accelerated the use of smart card ICs in transportation and e-governance, helping position India as a leading market for smart card solutions by 2025.
Key Challenges
High Initial Implementation Costs
The adoption of smart card systems requires substantial upfront investment in infrastructure, including card readers, validation devices, and secure backend systems. For developing regions with constrained budgets, these costs can be a major barrier to adoption. Operators must balance the need for modernization with financial feasibility, often relying on government subsidies or international funding. Without cost-effective solutions, widespread deployment in smaller cities and low-income regions may remain limited.
Cybersecurity and Data Privacy Concerns
Smart cards handle sensitive commuter and payment data, making cybersecurity a critical concern. Breaches or unauthorized access can erode public trust and disrupt transit services. Transit authorities must invest heavily in encryption, authentication protocols, and compliance with data privacy regulations. However, maintaining security across large networks increases operational complexity and costs. Ensuring reliable protection without compromising speed and convenience continues to challenge market stakeholders, particularly in regions with evolving data protection laws.
System Interoperability and Standardization Issues
One of the major challenges lies in achieving interoperability across different transport systems and regions. Many cities operate legacy ticketing systems that are not fully compatible with modern smart card solutions. Lack of standardization hampers seamless travel, particularly for intercity and cross-border commuters. Upgrading existing infrastructure and harmonizing standards requires significant coordination between multiple stakeholders. Without addressing these barriers, the full potential of integrated and scalable smart card ecosystems cannot be realized.
Regional Analysis
North America
North America accounted for 23% of the global public transport smart cards market in 2024, reaching USD 1,325.66 million. The region is projected to grow at a CAGR of 5.8%, expanding to USD 2,076.65 million by 2032. Growth is driven by extensive adoption of contactless ticketing in major transit systems across the U.S. and Canada, alongside integration with mobile wallets. Government focus on smart city projects and improved commuter convenience continues to fuel demand, while upgrades to legacy rail and metro ticketing systems remain a major revenue contributor.
Europe
Europe held a 26% market share in 2024, valued at USD 1,523.66 million, and is projected to reach USD 2,262.39 million by 2032, registering a CAGR of 5.1%. The region benefits from strong regulatory support for digital payments, widespread adoption of integrated mobility solutions, and growing demand for cross-border interoperability in the EU. Countries such as Germany, the UK, and France lead investments in metro and rail networks, while Eastern Europe shows potential for accelerated adoption. Europe’s mature but innovation-driven transport ecosystem positions the region as a steady revenue contributor.
Asia Pacific
Asia Pacific dominated the market with a 44% share in 2024, recording USD 2,602.93 million and projected to expand to USD 4,337.74 million by 2032 at a CAGR of 6.6%. The region leads due to large-scale deployments in China, India, and Japan, supported by government investments in metro, rail, and bus rapid transit systems. Rising urbanization, expanding middle-class populations, and increasing digital payment adoption accelerate growth. Asia Pacific remains the fastest-growing regional market, with continuous upgrades in smart mobility solutions and collaborations between local governments and global technology providers.
Latin America
Latin America represented 6% of the market in 2024, valued at USD 361.21 million, and is expected to grow to USD 524.55 million by 2032 at a CAGR of 4.8%. Brazil and Mexico are leading markets due to significant investments in metro and bus networks, while other countries are gradually adopting electronic ticketing. Growing urban density and government initiatives to modernize transit infrastructure support adoption. However, high implementation costs and uneven technology penetration across smaller cities limit the speed of market expansion.
Middle East
The Middle East held a 4% market share in 2024, generating USD 249.35 million and projected to reach USD 358.49 million by 2032, expanding at a CAGR of 4.7%. GCC countries drive demand through large-scale infrastructure projects, including metro expansions in Riyadh, Dubai, and Doha. Smart city initiatives and tourism-led investments further accelerate the use of contactless ticketing. However, adoption varies across the region, with higher penetration in wealthy Gulf states compared to emerging economies. Integration of multi-modal transport systems offers significant long-term opportunities.
Africa
Africa captured a 3% share of the market in 2024, valued at USD 187.54 million, and is forecasted to reach USD 287.25 million by 2032, growing at a CAGR of 5.3%. South Africa, Egypt, and Nigeria are leading adopters, driven by government-backed urban transit modernization programs. While penetration is still low, rising smartphone usage and mobile money ecosystems are creating opportunities for hybrid smart card and digital solutions. High infrastructure costs remain a challenge, yet Africa represents a promising frontier for future adoption in public transport smart cards.
Market Segmentations:
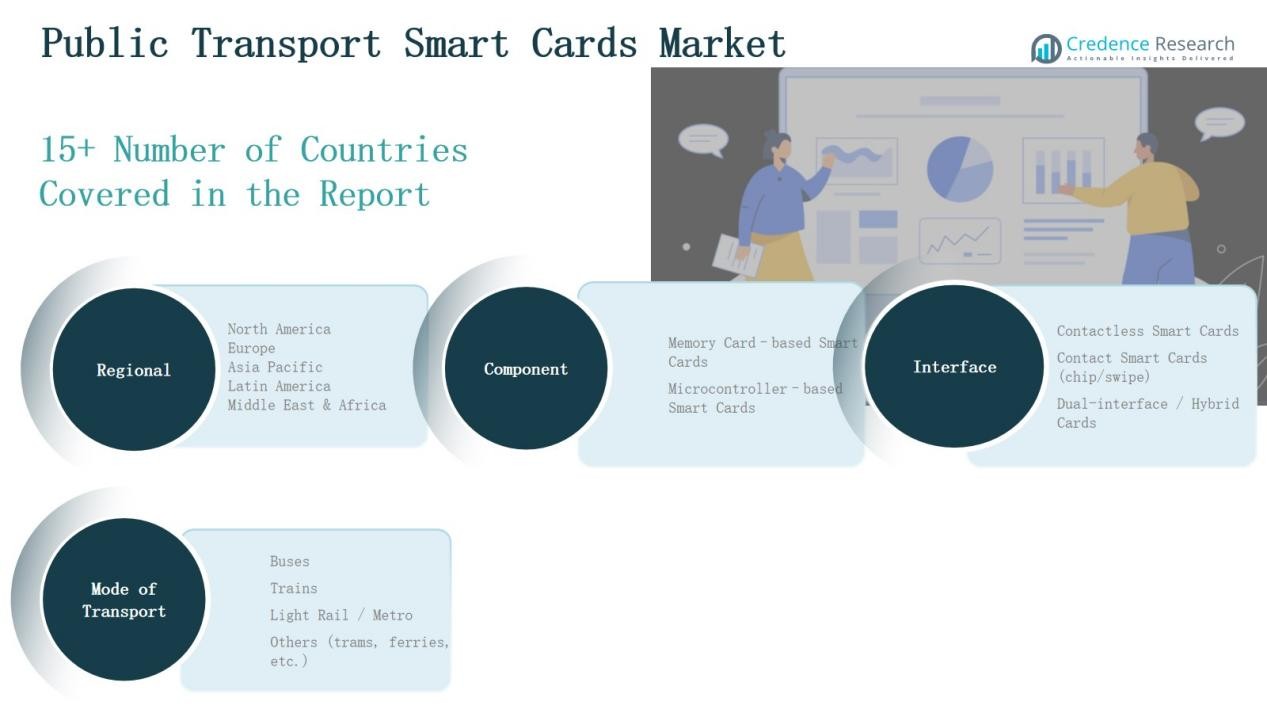
By Component
- Memory Card–based Smart Cards
- Microcontroller–based Smart Cards
By Interface
- Contactless Smart Cards
- Contact Smart Cards (chip/swipe)
- Dual-interface / Hybrid Cards
By Mode of Transport
- Buses
- Trains
- Light Rail / Metro
- Others (trams, ferries, etc.)
By Region
- North America (U.S., Canada, Mexico)
- Europe (UK, France, Germany, Italy, Spain, Russia, Rest of Europe)
- Asia Pacific (China, Japan, South Korea, India, Australia, Southeast Asia, Rest of Asia Pacific)
- Latin America (Brazil, Argentina, Rest of Latin America)
- Middle East (GCC Countries, Israel, Turkey, Rest of Middle East)
- Africa (South Africa, Egypt, Rest of Africa)
Competitive Landscape
The competitive landscape of the Public Transport Smart Cards Market is characterized by a mix of global payment giants, semiconductor firms, and specialized smart card manufacturers competing through innovation, partnerships, and regional expansion. Key players include American Express, Oberthur Technologies S.A., CPI Card Group Inc., Atos SE, Giesecke & Devrient GmbH, Infineon Technologies, and NXP Semiconductors N.V. These companies focus on delivering secure, scalable, and interoperable card solutions that meet the rising demand for contactless and integrated mobility systems. Strategies emphasize investments in advanced microcontroller-based cards, collaboration with transit authorities, and expansion into high-growth regions such as Asia Pacific and Latin America. Product differentiation centers on multi-application capabilities, enhanced encryption, and integration with mobile and digital wallets. Market competition is further intensified by new entrants offering cost-effective solutions in emerging markets. Overall, established players leverage technological expertise and global distribution networks to maintain dominance while targeting long-term growth opportunities.
Shape Your Report to Specific Countries or Regions & Enjoy 30% Off!
Key Players
Recent Developments
- In May 2025, American Express enabled its contactless cards for transit payment in Singapore, letting commuters tap Amex cards on buses and MRT.
- In May 2025, Giesecke+Devrient (G+D) and Daon formed a strategic partnership to enhance identity verification and biometric authentication in digital identities.
- In July 2024, NXP digitized the San Francisco Bay Area’s Clipper Card using its MIFARE 2GO platform, allowing commuters to use Google Pay on NFC-enabled Android phones for fare payment and top-ups.
- In July 2025, HID acquired Spanish smart card manufacturer Calmell Group to expand its transportation ticketing portfolio with smart paper and magnetic ticket solutions.
Report Coverage
The research report offers an in-depth analysis based on Component, Interface, Mode of Transportation and Region. It details leading market players, providing an overview of their business, product offerings, investments, revenue streams, and key applications. Additionally, the report includes insights into the competitive environment, SWOT analysis, current market trends, as well as the primary drivers and constraints. Furthermore, it discusses various factors that have driven market expansion in recent years. The report also explores market dynamics, regulatory scenarios, and technological advancements that are shaping the industry. It assesses the impact of external factors and global economic changes on market growth. Lastly, it provides strategic recommendations for new entrants and established companies to navigate the complexities of the market.
Future Outlook
- Adoption of microcontroller-based smart cards will continue to rise due to stronger security.
- Contactless cards will dominate as commuters demand faster and seamless transit experiences.
- Integration of smart cards with mobile wallets and digital apps will expand globally.
- Governments will invest more in unified ticketing systems for multi-modal transport networks.
- Emerging markets will see accelerated deployments as urban transit systems modernize.
- Hybrid and dual-interface cards will grow to support legacy and modern infrastructure.
- Partnerships between global providers and local authorities will drive regional expansion.
- Demand for eco-friendly smart card materials will increase with sustainability goals.
- Interoperability standards will gain traction to enable cross-border and intercity travel solutions.
- Data-driven services and analytics linked to smart cards will enhance commuter experience.


