Market Overview
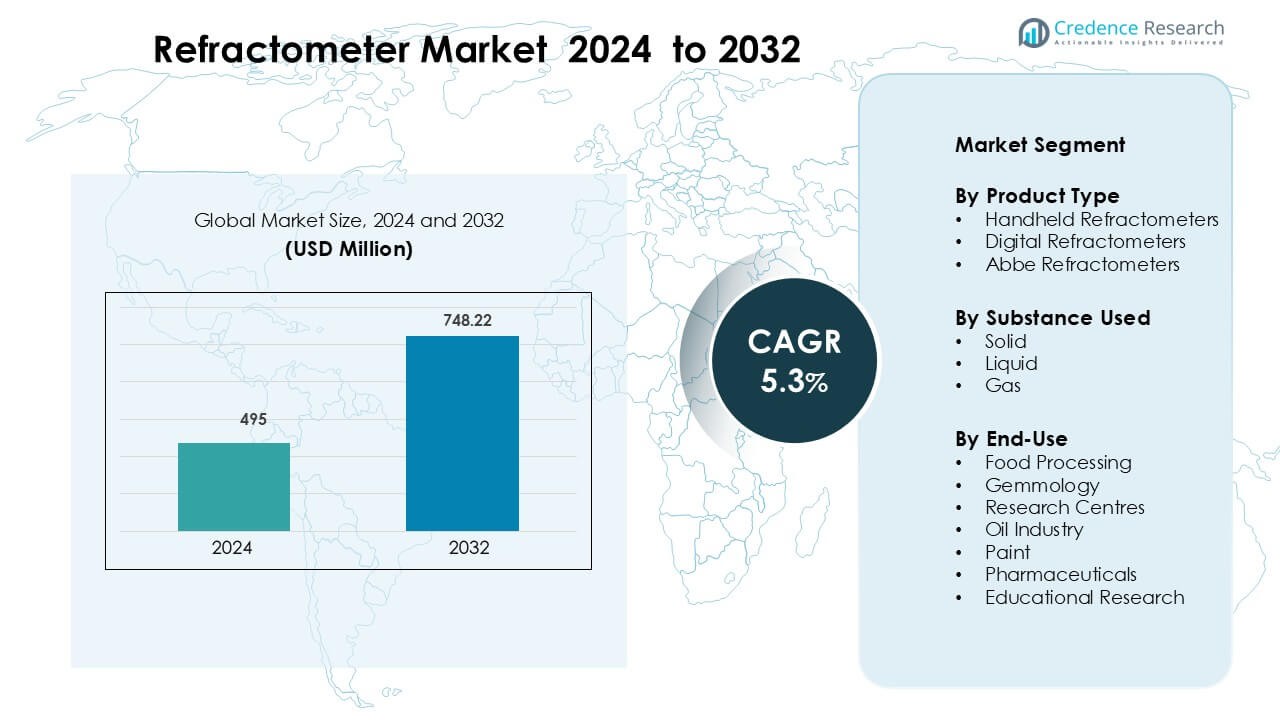
Refractometer Market was valued at USD 495 million in 2024 and is anticipated to reach USD 748.22 million by 2032, growing at a CAGR of 5.3 % during the forecast period.
| REPORT ATTRIBUTE |
DETAILS |
| Historical Period |
2020-2023 |
| Base Year |
2024 |
| Forecast Period |
2025-2032 |
| Refractometer Market Size 2024 |
USD 495 Million |
| Refractometer Market, CAGR |
5.3% |
| Refractometer Market Size 2032 |
USD 748.22 Million |
The Refractometer Market is shaped by major players such as Rudolph Research Analytical Corporation, AMETEK, Inc., KRÜSS Optronic GmbH, Xylem Analytics LLC, MISCO Refractometer, Cole-Parmer Instrument Company, LLC, Anton Paar GmbH, Shimadzu Corporation, Hanna Equipment’s India Pvt. Ltd., and Mettler-Toledo International Inc. These companies compete through advanced digital systems, high-precision optical designs, and automated inline solutions that support strict quality requirements in food, chemical, and pharmaceutical industries. North America leads the market with a 33% share in 2024, driven by strong industrial adoption, robust R&D spending, and widespread use of refractometry in regulated manufacturing environments.
Market Insights
- The Refractometer Market reached USD 495 million in 2024 and is projected to hit USD 748.22 million by 2032, growing at a CAGR of 5.3%.
- Growth is driven by rising quality control needs across food, chemical, and pharmaceutical industries, where refractive index testing supports purity, concentration, and formulation accuracy.
- Digital and automated refractometers trend upward as users adopt temperature-compensated, connected, and inline systems that improve speed, accuracy, and real-time monitoring.
- The landscape remains competitive with Rudolph Research Analytical Corporation, AMETEK, KRÜSS Optronic, Xylem Analytics, MISCO, Cole-Parmer, Anton Paar, Shimadzu, Hanna, and Mettler-Toledo focusing on precision, automation, and advanced optics.
- North America leads with a 33% share, followed by Asia-Pacific at 31% and Europe at 29%, while handheld refractometers hold the largest segment share due to ease of use and broad industrial adoption.
Access crucial information at unmatched prices!
Request your sample report today & start making informed decisions powered by Credence Research Inc.!
Download Sample
Market Segmentation Analysis:
By Product Type
Handheld refractometers lead this segment with about 47% share in 2024. Users choose handheld models because they offer fast readings, low cost, and strong field usability across food, beverage, and chemical sites. Growth increases as small-scale processors and on-site quality teams adopt compact tools for routine Brix, salinity, and purity checks. Digital refractometers grow due to higher accuracy and automated temperature correction features used in labs and controlled environments. Abbe refractometers remain essential in advanced research where precise refractive index measurement is needed for chemicals and optical materials.
- For instance, Mettler-Toledo’s MyBrix handheld refractometer delivers a full Brix measurement range from 0.0 to 95.0 °Brix, provides results in just 2 seconds, and supports up to 10,000 readings per battery set.
By Substance Used
Liquid measurement dominates this category with nearly 68% share in 2024. Industries rely on liquid refractometers because most purity, concentration, and composition tests involve solutions such as syrups, oils, coolants, solvents, and pharmaceutical formulations. Demand rises as beverage, dairy, petrochemical, and biopharma plants integrate refractometry into continuous quality monitoring. Solid-based testing expands in gemmology and material science for gemstone grading and polymer assessment. Gas refractometry grows slowly but gains attention in optical fiber calibration, atmospheric research, and precision laser alignment systems.
- For instance, the ATR-series solid refractometer from S4 Science requires a polished solid sample of at least 10 mm diameter and 5 mm thickness, providing reliable refractive index measurements when matched with a high-index coupling liquid.
By End-Use
Food processing holds the largest share with about 34% in 2024. Manufacturers use refractometers to monitor sugar concentration, moisture levels, and ingredient consistency in beverages, sauces, dairy products, and confectionery. Growth strengthens as companies automate quality control and adopt inline refractometry to maintain batch uniformity. Pharmaceuticals expand use for purity checks, solvent blending, and API formulation. Gemmology uses refractometers for gemstone identification, while research centres and educational labs adopt the tools for optical studies. The oil industry and paint manufacturers apply refractometry to assess viscosity modifiers, additives, and fluid stability.
Key Growth Drivers
Rising Demand for Quality Control Across Food, Chemical, and Pharma Industries
Quality assurance needs across food, chemical, and pharmaceutical sectors drive strong refractometer adoption. Producers monitor sugar levels, solvent purity, coolant concentration, and formulation consistency to meet strict safety and labeling rules. Demand rises as companies shift from manual testing to rapid, instrument-based checks that reduce human error and improve batch reliability. Inline refractometers support continuous production lines, enabling real-time adjustments that prevent wastage and maintain product standards. Expanding dairy, beverage, and processed food output also strengthens this demand. Regulatory bodies enforce tighter quality protocols, which encourages factories to integrate dependable refractive index measurement tools.
- For instance, Vaisala’s K-Patents PR-43 inline refractometer provides a full measurement range of 0–100 °Brix with an accuracy of ±0.05 °Brix and operates reliably up to 150 °C, making it widely used in dairy and beverage processing lines.
Expansion of Digital and Automated Refractometry Solutions
The market benefits from rapid adoption of digital, temperature-compensated, and automated refractometers. Users prefer digital systems because they provide high accuracy, faster readings, and minimal calibration needs. Industries with strict compliance standards—such as pharmaceuticals, chemicals, and bioprocessing—use automated refractometers to achieve consistent results regardless of operator skill. Manufacturers adopt touchscreen interfaces, multi-scale measurement modes, and data logging features that support traceability. The push toward Industry 4.0 encourages factories to link refractometers with SCADA systems for remote monitoring. This shift toward automation strengthens equipment demand across lab and production environments.
- For instance, Anton Paar’s Abbemat 550 refractometer delivers refractive index accuracy of ±0.00002 nD and provides fully automatic temperature control between 4 °C and 85 °C, enabling compliant digital measurement in pharma QC labs.
Increasing Applications in Research, Gemmology, and Material Science
Broader scientific applications contribute significant growth as refractometers become essential tools in research and material characterization. Gemmologists use refractometers to identify gemstones, detect synthetics, and evaluate clarity. Material science labs use refractive index measurements to study polymers, coatings, adhesives, and thin films. Universities integrate refractometry into optics and chemistry education, which increases base-level demand. Precision instruments support atmospheric research, optical fiber testing, and laser alignment. Growth in advanced research grants and laboratory investments further accelerates adoption. Expanding R&D activities in biotechnology, nanomaterials, and photonics strengthens the need for high-accuracy refractometers.
Key Trend and Opportunities
Transition Toward Smart, Connected, and Inline Measurement Systems
A major trend shaping the market is the move toward smart and connected refractometers. Inline and process refractometers gain traction because they deliver continuous, real-time data that improves process stability. Manufacturers add Ethernet, Bluetooth, and cloud-sync capabilities to support remote monitoring and predictive maintenance. Industries aim to reduce downtime by using sensors that alert operators before deviations affect product quality. Automation initiatives in food and beverage plants raise demand for integrated measurement platforms. Smart refractometers also support digital audit trails and compliance reporting, which improves traceability across supply chains.
- For instance, K-PATENTS’ semicon refractometer PR-33-S uses Power-over-Ethernet (PoE) to stream refractive index (range 𝑛 𝐷 = 1.3200 – 1.5300 n D=1.3200–1.5300) continuously, and alerts can be configured for low- or high-concentration conditions, reducing wafer scrap.
Growing Adoption in Emerging Markets and Small-Scale Industries
The market sees new opportunities as small-scale producers and emerging economies adopt refractometers for routine testing. Low-cost handheld devices allow small beverage shops, dairy units, and chemical mixers to maintain product consistency. Government programs supporting food safety, quality certification, and export standards encourage local manufacturers to use proper measurement tools. Rising awareness among small labs, training institutes, and independent QC teams expands entry-level demand. At the same time, distributors launch budget digital refractometers that offer strong value, improving accessibility across Asia-Pacific, Latin America, and Africa.
- For instance, ATAGO’s PAL-Alpha handheld pocket refractometer offers a wide Brix measurement range from 0.0 to 85.0%, can perform approximately 11,000 measurements on two AAA batteries, and is water-resistant to IP65, enabling its use in small food / beverage shops even in remote or humid regions.
Technological Innovation in Optical Sensors and Calibration Methods
The refractometer market benefits from ongoing advancements in optics, sensors, and calibration materials. New temperature-stable sensors reduce drift and improve accuracy under industrial conditions. Manufacturers explore sapphire prisms, advanced LED sources, and coated lenses to enhance measurement reliability. Portable devices integrate multi-scale readings for salinity, Brix, and refractive index on one platform. Automation allows calibration without manual inputs, reducing downtime. As industries focus on sustainability, there is strong opportunity for energy-efficient, low-maintenance designs. Innovations in compact digital systems create opportunities for wider use in remote or mobile environments.
Key Challenge
Accuracy Limitations in Harsh Industrial Environments
Refractometers face challenges in environments with extreme temperature changes, heavy vibration, or contaminated samples. These conditions can distort refractive readings and reduce accuracy. Food and chemical plants often deal with viscous or particulate-rich materials that require careful sample handling. Inline units struggle when buildup on optical surfaces affects light transmission. Operators must invest in regular cleaning, calibration, and prism maintenance to maintain accuracy. Inadequate operator training also worsens measurement errors, especially in small industries with limited technical expertise. These factors restrict optimal performance in demanding production settings.
High Cost of Advanced Digital and Laboratory Refractometers
The cost of advanced digital and laboratory-grade refractometers remains a barrier for many small and medium enterprises. High-precision models with automation, connectivity, and temperature control require significant investment. Laboratories and processors in developing regions often delay upgrades because of budget constraints. Replacement parts, calibration fluids, and maintenance add recurring expenses. This challenge limits adoption, especially in sectors that rely on basic, manual testing. Manufacturers must balance cost with reliability to appeal to broader user segments. Without accessible pricing, advanced refractometers may remain concentrated in high-budget industries.
Regional Analysis
North America
North America leads the Refractometer Market with about 33% share in 2024. The region benefits from strong adoption across food processing, pharmaceuticals, and chemical industries, where refractive index testing supports strict regulatory compliance. Growth strengthens as manufacturers integrate digital and inline refractometers to improve batch consistency and reduce manual testing errors. The United States drives most demand due to well-established quality control systems and extensive R&D activity in universities and biotech labs. Canada adds steady growth through expanding beverage, dairy, and oil sectors that rely on refractometry for purity and concentration monitoring.
Europe
Europe holds nearly 29% share in the Refractometer Market in 2024. The region’s mature food, beverage, and pharmaceutical industries use refractometers for precise measurement of sugar content, solvent purity, and formulation accuracy. Germany, the U.K., and France lead adoption due to stringent EU quality standards and strong investments in laboratory infrastructure. Demand rises in chemical and optical material testing, where high-precision Abbe and digital refractometers are widely used. Growth is also supported by gemmology labs and research institutes that rely on refractive index analysis for material characterization and optical studies.
Asia-Pacific
Asia-Pacific accounts for about 31% share in 2024, making it one of the fastest-growing regions. Strong expansion in food processing, dairy, beverages, pharmaceuticals, and petrochemicals drives high refractometer usage. China, Japan, and India lead adoption due to rising production volumes and growing investment in automated quality control systems. Small-scale industries increasingly choose handheld refractometers for cost-effective testing. Rapid industrialization and government-backed quality programs further support market growth. Universities and research centers across the region also contribute significant demand as refractometry becomes essential in chemistry, optics, and material science education.
Latin America
Latin America holds close to 5% market share in 2024. The region sees growing demand from food and beverage manufacturers, especially in Brazil and Mexico, where sugar processing, dairy, and beverage plants rely on refractometers for concentration monitoring. Adoption rises as more producers adopt standardized quality testing to meet export requirements. Handheld and entry-level digital refractometers gain traction due to affordability. Pharmaceutical and oil industries add moderate demand through purity and formulation testing. Research institutions improve uptake as funding for laboratory equipment gradually increases across major universities and technical centers.
Middle East & Africa
The Middle East & Africa region captures around 2% share in 2024. Growth remains steady due to rising adoption in oil refining, petrochemicals, and food processing industries. Gulf countries use refractometers to monitor coolant fluids, lubricants, and hydrocarbon blends, while expanding dairy and beverage sectors drive additional demand. South Africa contributes through growing pharmaceutical and research activity. However, limited laboratory infrastructure and high equipment costs slow wider adoption. Handheld refractometers remain the most common choice due to their affordability and ease of use, while advanced digital systems grow at a gradual pace.
Market Segmentations:
By Product Type
- Handheld Refractometers
- Digital Refractometers
- Abbe Refractometers
By Substance Used
By End-Use
- Food Processing
- Gemmology
- Research Centres
- Oil Industry
- Paint
- Pharmaceuticals
- Educational Research
By Geography
- North America
- Europe
- Germany
- France
- U.K.
- Italy
- Spain
- Rest of Europe
- Asia Pacific
- China
- Japan
- India
- South Korea
- South-east Asia
- Rest of Asia Pacific
- Latin America
- Brazil
- Argentina
- Rest of Latin America
- Middle East & Africa
- GCC Countries
- South Africa
- Rest of the Middle East and Africa
Competitive Landscape
The competitive landscape of the Refractometer Market features strong participation from leading manufacturers such as Rudolph Research Analytical Corporation, AMETEK, Inc., KRÜSS Optronic GmbH, Xylem Analytics LLC, MISCO Refractometer, Cole-Parmer Instrument Company, LLC, Anton Paar GmbH, Shimadzu Corporation, Hanna Equipment’s India Pvt. Ltd., and Mettler-Toledo International Inc. These companies compete through advanced optical designs, temperature-compensated systems, and digital interfaces that improve accuracy and usability. Global players invest in automation, inline measurement technologies, and smart connectivity to meet rising demand from food, chemical, and pharmaceutical industries. Partnerships with laboratories, distributors, and industrial facilities help expand market reach. Many manufacturers focus on compact, multi-scale handheld devices for small industries while offering high-precision benchtop and process refractometers for research and large-scale production. Continuous R&D investment supports innovation in sensor stability, calibration materials, and energy-efficient designs, strengthening competition across both premium and value-focused segments.
Key Player Analysis
Recent Developments
- In 2025, KRÜSS Optronic GmbH A. KRÜSS Optronic scheduled participation at LAB-SUPPLY Augsburg 2025, highlighting its handheld HR series and DR201-95 digital refractometers for food and pharmaceutical laboratories, reinforcing its position in benchtop and portable refractometry.
- In April 2024, Rudolph Research Analytical confirmed its presence at Analytica 2024 in Munich, using the show to promote its J-Series automatic refractometers alongside other lab instruments to European process and QC laboratories.
Shape Your Report to Specific Countries or Regions & Enjoy 30% Off!
Report Coverage
The research report offers an in-depth analysis based on Product Type, Substance Used, End-Use and Geography. It details leading market players, providing an overview of their business, product offerings, investments, revenue streams, and key applications. Additionally, the report includes insights into the competitive environment, SWOT analysis, current market trends, as well as the primary drivers and constraints. Furthermore, it discusses various factors that have driven market expansion in recent years. The report also explores market dynamics, regulatory scenarios, and technological advancements that are shaping the industry. It assesses the impact of external factors and global economic changes on market growth. Lastly, it provides strategic recommendations for new entrants and established companies to navigate the complexities of the market.
Future Outlook
- The market will expand as more industries adopt automated and digital refractometry for faster quality checks.
- Inline refractometer use will rise as factories shift toward continuous, real-time monitoring systems.
- Advances in optical sensors will improve accuracy and reduce calibration needs across industrial settings.
- Demand from food, beverage, and pharmaceutical sectors will strengthen due to stricter global quality standards.
- Affordable handheld models will see wider adoption among small manufacturers and emerging markets.
- Research labs and universities will increase usage as refractometry becomes standard in optical and material studies.
- Connected refractometers with cloud and wireless features will support smarter production environments.
- Growth in petrochemical, paint, and coolant monitoring applications will broaden industrial penetration.
- Manufacturers will focus on compact, energy-efficient designs to meet sustainability expectations.
- Competition will intensify as global players invest in innovation and expand distribution networks


