Market Overview
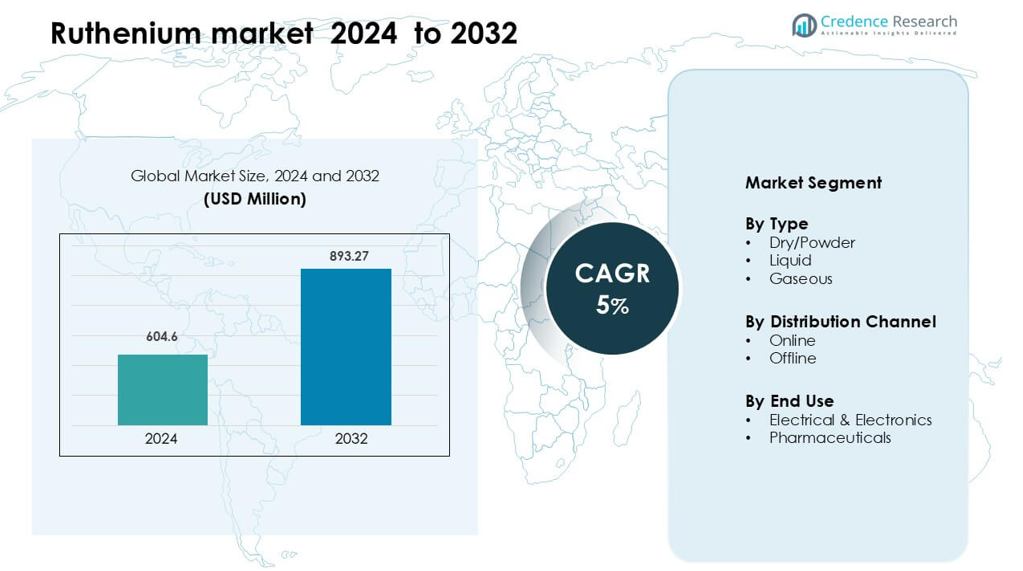
Ruthenium market was valued at USD 604.6 million in 2024 and is anticipated to reach USD 893.27 million by 2032, growing at a CAGR of 5 % during the forecast period.
| REPORT ATTRIBUTE |
DETAILS |
| Historical Period |
2020-2023 |
| Base Year |
2024 |
| Forecast Period |
2025-2032 |
| Ruthenium market Size 2024 |
USD 604.6 million |
| Ruthenium market, CAGR |
5% |
| Ruthenium market Size 2032 |
USD 893.27 million |
The Ruthenium market is shaped by major producers and refiners that ensure stable supply and high-purity output for electronics, chemical, and catalyst applications. Key participants include Prima Fluorspar Corp., Sinochem Latina Co. Ltd., Gupo Minersa, China Kings Resources Group Co. Ltd., Mongolrostsvetmet LLC, Seaforth Mineral & Ore Co., Jianyang Shanshui Chemicals Industry Corp. Ltd., British Fluorspar Ltd., Heraeus, and Anglo American UK. These companies strengthen their positions through processing upgrades, strong mining networks, and long-term contracts with industrial users. Asia Pacific leads the global market with about 42% share in 2024, supported by strong demand from semiconductor manufacturing, chemical processing, and growing investment in advanced materials.
Market Insights
- Ruthenium market was valued at USD 604.6 million in 2024 and is anticipated to reach USD 893.27 million by 2032, growing at a CAGR of 5 % during the forecast period.
- Demand rises due to strong use in electronics, where dry/powder ruthenium holds the largest share as manufacturers rely on high-purity material for chip resistors, HDD components, and advanced thin-film deposition.
- Trends include wider adoption in ALD/CVD processes, growth in catalyst engineering, and rising interest in ruthenium-based complexes for oncology and clean-energy applications.
- Competition is defined by major refiners and PGM suppliers focusing on purity enhancement, recycling expansion, and long-term sourcing for semiconductor and chemical companies; restraints include high cost and supply volatility.
- Asia-Pacific leads with about 42% share, driven by large semiconductor hubs, while North America and Europe maintain strong demand from electronics and catalyst applications; the electrical & electronics segment dominates end-use consumption.
Access crucial information at unmatched prices!
Request your sample report today & start making informed decisions powered by Credence Research Inc.!
Download Sample
Market Segmentation Analysis:
By Type
Dry/powder ruthenium leads this segment with about 61% share in 2024 due to its strong use in catalysts, thick-film chip resistors, and advanced material processing. Manufacturers rely on powder formats because the material supports high purity, stable thermal performance, and precise deposition in semiconductor and chemical applications. Liquid and gaseous forms show steady adoption in plating and ALD processes, but their demand remains lower as industries continue to prefer powder grades for large-volume electronics and catalyst production.
- For instance, Heraeus offers eight volatile ruthenium precursors for ALD and CVD semiconductor lines, supporting fine-pitch interconnect manufacturing.
By Distribution Channel
Offline channels dominate this segment with nearly 68% share in 2024, driven by bulk procurement from electronics manufacturers, chemical processors, and catalyst producers. Buyers prefer offline distribution because it ensures verified quality, controlled handling, and secure sourcing of high-value metals. Online platforms gain traction for small-volume specialty orders and lab-grade materials, but growth is slower since many industrial users still require direct supplier engagement, compliance checks, and certified logistics offered by offline vendors.
- For instance, several research-grade ruthenium compounds are listed on e-commerce portals such as those of Alfa Aesar (a Johnson Matthey company), but their catalog also stresses that bulk industrial-grade supply must go through direct distributor agreements.
By End Use
Electrical and electronics applications account for about 57% share in 2024, supported by rising production of chip resistors, thick-film pastes, and hard-disk drive components. Component makers favor ruthenium due to its corrosion resistance, conductive stability, and compatibility with high-temperature manufacturing. Pharmaceutical demand expands in oncology and therapeutic formulation research, yet remains a smaller share because usage is limited to niche ruthenium-based complexes tested in controlled drug-development environments.
Key Growth Drivers
Rising Demand from Electrical and Electronics Manufacturing
Demand for ruthenium continues to rise due to its essential role in thick-film chip resistors, hard-disk drive components, and advanced conductive pastes. Electronics manufacturers prefer ruthenium because the metal provides strong corrosion resistance, thermal stability, and stable conductivity under high stress. Growth in consumer electronics, data-center storage, and automotive electronics boosts consumption across major producing regions. Expansion in 5G infrastructure and increasing use of miniaturized components also strengthens long-term demand. The shift toward advanced packaging and high-reliability components encourages producers to secure consistent ruthenium supply for uninterrupted production. As semiconductor foundries scale up automation and precision-material needs, ruthenium remains a key metal supporting new designs.
- For instance, Johnson Matthey is a known supplier of ruthenium compounds, including ruthenium oxide (RuO2), which is used in thick-film resistor pastes. These pastes are formulated in precise proportions to achieve a wide range of resistive films, with common sheet resistivities in the range of 100 Ω/□ (ohms per square) to. This technology enables the mass production of stable resistors used extensively in consumer electronics.
Expanding Use in Chemical Catalysis and Advanced Materials
Ruthenium plays a key role in catalysts used for ammonia synthesis, hydrogenation processes, and specialty chemical formation. Chemical producers adopt ruthenium catalysts because they offer high activity, long operational life, and lower energy use in many reactions. Emerging demand from fuel-cell technologies, carbon-neutral chemical pathways, and advanced material development pushes adoption further. The rise in research on ruthenium-based complexes for synthetic chemistry and clean-energy applications also expands industrial interest. As industries shift toward efficient catalytic systems with reduced emissions, ruthenium’s strong catalytic properties make it a critical component in next-generation industrial processes. Its value in precision chemical engineering continues to strengthen global demand across both developed and emerging markets.
- For instance, a 5 wt% Ru/C (carbon-supported ruthenium) catalyst promoted with alkali metals showed ammonia synthesis rates up to 10 times higher than conventional promoted iron catalysts at 250 °C.
Increasing Adoption in Pharmaceuticals and Medical Research
Ruthenium compounds gain strong interest in oncology research and advanced therapeutics due to their promising cytotoxic activity and ability to target cancer cells more selectively than many traditional agents. Research teams explore ruthenium complexes for photodynamic therapy, targeted drug delivery, and broader biomedical innovation. The rising number of clinical evaluations and academic studies strengthens long-term potential in pharmaceutical development. As healthcare systems focus on next-generation therapies with improved biocompatibility and reduced systemic toxicity, ruthenium-based compounds attract continuous funding and research investment. Although adoption remains limited today, expanding preclinical and experimental studies contribute to steady demand growth in high-purity ruthenium materials for drug-development pipelines.
Key Trend & Opportunity
Expanding Role in Sustainable and Low-Carbon Technologies
The shift toward clean-energy systems opens strong opportunities for ruthenium across hydrogen production, electrolysis systems, and advanced fuel cells. Ruthenium catalysts support high-efficiency reactions and help reduce energy use in several low-carbon processes. Growing interest in carbon-neutral chemical pathways, renewable energy storage, and next-generation batteries strengthens long-term demand. Research groups explore ruthenium’s potential in emerging green technologies such as CO₂ conversion and sustainable ammonia production. As governments increase funding for decarbonization projects, demand for ruthenium-based materials grows in both pilot-scale and commercial applications. The trend supports new partnerships between catalyst developers, energy companies, and research institution.
- For instance, Nel Hydrogen (formerly Proton OnSite) evaluated ruthenium-stabilized Ir–Ru oxide electrocatalysts in PEM electrolyzers, recording oxygen-evolution overpotential below 300 mV at 2 A cm⁻², which can significantly reduce stack energy consumption in commercial hydrogen systems.
Growth of Advanced Deposition Technologies
Ruthenium gains strong traction in technologies such as atomic layer deposition, chemical vapor deposition, and next-generation thin-film methods used in semiconductor fabrication. These processes require highly pure, stable ruthenium precursors that support uniform coating in small and complex architectures. As chipmakers design smaller nodes, advanced memory devices, and high-performance logic circuits, the need for ruthenium-based films increases. Opportunities expand as manufacturers move toward more energy-efficient deposition workflows and new materials for interconnects. Emerging demand for ruthenium in extreme-ultraviolet lithography and high-density storage devices also strengthens future market potential. These developments support sustained investment in innovative ruthenium precursor formulations and film-engineering methods.
Key Challenge
High Cost and Supply Volatility
Ruthenium remains a scarce metal, primarily mined as a byproduct of platinum and nickel, which makes its supply highly unpredictable. Market fluctuations occur when upstream mining output changes, causing cost instability for manufacturers. Electronics and chemical producers often face difficulty planning long-term procurement due to irregular availability. The metal’s dependence on limited mining regions further increases risk during geopolitical disruptions or reduced ore production. These supply factors raise the cost of high-purity ruthenium needed for semiconductors, catalysts, and pharmaceuticals. Many industries explore substitution or recycling programs, but the complexity of reclaiming ruthenium from end-of-life products slows adoption.
Limited Large-Scale Adoption in Pharmaceuticals
Although ruthenium complexes show strong potential in cancer therapy, large-scale pharmaceutical adoption remains slow due to regulatory uncertainty, complex safety evaluation, and limited long-term clinical data. Many ruthenium-based compounds are still in experimental or early-stage study, which restricts widespread use across global therapeutic markets. High development costs and long testing periods delay commercialization timelines. Pharmaceutical companies require strong evidence on toxicity, dosing, and patient outcomes before moving toward advanced trials. This challenge slows the rate at which the pharmaceutical sector can drive large-volume demand for high-purity ruthenium materials. Further clinical progress and reliable safety data are essential to unlock future growth.
Regional Analysis
North America
North America holds about 34% share of the Ruthenium market in 2024, supported by strong consumption in chip resistors, hard-disk components, and advanced catalysts used in chemical manufacturing. Semiconductor producers in the United States drive steady demand through high-purity ruthenium used in thin-film and deposition processes. Research institutions also increase usage in pharmaceutical studies focused on ruthenium-based oncology compounds. Growth remains stable as electronics production and specialty chemical development expand. Rising interest in hydrogen technologies and catalytic innovation further strengthens long-term demand across this region.
Europe
Europe accounts for roughly 29% share in 2024, backed by strong industrial activity in Germany, the United Kingdom, and France. Electronics manufacturers adopt ruthenium for thick-film pastes, memory devices, and precision components. The region also benefits from advanced chemical catalyst research and strong sustainability programs exploring ruthenium’s role in green-energy solutions. Pharmaceutical studies on ruthenium complexes continue to grow, adding niche demand. The presence of established refining and material-science companies supports reliable sourcing, while ongoing R&D spending drives adoption across specialized applications.
Asia-Pacific
Asia-Pacific leads the global Ruthenium market with nearly 42% share in 2024 due to strong semiconductor manufacturing bases in China, Japan, South Korea, and Taiwan. Large-scale electronics production boosts demand for ruthenium-based pastes, interconnect materials, and thin-film structures. Expanding chemical catalyst use and rising R&D activity in next-generation materials support long-term growth. The region also benefits from rapid industrialization and high consumption across automotive and consumer electronics. Strong investment in advanced deposition technologies and memory chip expansion keeps Asia-Pacific as the dominant hub for ruthenium consumption.
Latin America
Latin America holds about 7% share in 2024, driven by demand from chemical processing, metallurgy, and emerging electronics assembly operations. Brazil and Mexico show expanding use of ruthenium catalysts in industrial chemical reactions and specialty material production. Growth remains modest but steady, supported by rising research interest in energy-efficient catalytic systems. Limited semiconductor capacity tempers large-scale adoption, yet growing investment in industrial modernization encourages gradual market expansion. Import dependence influences pricing and availability, making partnerships with global suppliers essential for stable sourcing.
Middle East & Africa
The Middle East & Africa region captures roughly 5% share in 2024, supported by growing demand from chemical industries, refinery operations, and academic research centers. Emerging interest in hydrogen production and catalytic reforming stimulates niche adoption. Countries such as South Africa and the UAE invest in advanced material research and industrial upgrading, which increases limited but consistent ruthenium usage. Market growth stays moderate due to lower semiconductor activity, yet expanding clean-energy programs and new catalyst development projects create long-term opportunities across the region.
Shape Your Report to Specific Countries or Regions & Enjoy 30% Off!
Market Segmentations:
By Type
- Dry/Powder
- Liquid
- Gaseous
By Distribution Channel
By End Use
- Electrical & Electronics
- Pharmaceuticals
By Geography
- North America
- Europe
- Germany
- France
- U.K.
- Italy
- Spain
- Rest of Europe
- Asia Pacific
- China
- Japan
- India
- South Korea
- South-east Asia
- Rest of Asia Pacific
- Latin America
- Brazil
- Argentina
- Rest of Latin America
- Middle East & Africa
- GCC Countries
- South Africa
- Rest of the Middle East and Africa
Competitive Landscape
The Ruthenium market features a competitive landscape shaped by established miners, metal refiners, and global material suppliers. Leading participants such as Prima Fluorspar Corp., Sinochem Latina Co. Ltd., Gupo Minersa, China Kings Resources Group Co. Ltd., Mongolrostsvetmet LLC, Seaforth Mineral & Ore Co., Jianyang Shanshui Chemicals Industry Corp. Ltd., British Fluorspar Ltd., Heraeus (Germany), and AngloAmerican UK strengthen their positions through steady supply capabilities, advanced refining technologies, and stable distribution networks. These companies focus on improving purity grades, expanding catalytic material portfolios, and securing long-term partnerships with electronics, chemical, and pharmaceutical clients. Market players also invest in recycling routes to support demand from chip manufacturing and specialized catalyst applications. Strategic moves include capacity upgrades, regional expansion, and enhanced logistics to ensure consistent delivery for high-value end users. Competition remains intense as firms work to maintain product reliability, meet strict quality standards, and respond quickly to shifting global consumption trends.
Key Player Analysis
- Prima Fluorspar Corp.
- Sinochem Latina Co. Ltd.
- Gupo Minersa
- China Kings Resources Group Co. Ltd.
- Mongolrostsvetmet LLC
- Seaforth Mineral & Ore Co.
- Jianyang Shanshui Chemicals Industry CORP. Ltd.
- British Fluorspar Ltd.
- Heraeus (Germany)
- Anglo American UK
Recent Developments
- In November 2023, Heraeus and Sibanye-Stillwater created a significant advancement in electrocatalyst for hydrogen production, a stable and novel ruthenium-based catalyst for Proton Exchange Membrane (PEM) water electrolysis. The advancement improves the sustainability of hydrogen production by greatly decreasing material costs and the dependence on iridium, a highly scarce and expensive resource.
- In 2023, Heraeus (Germany) Heraeus Precious Metals has advanced recyclable ruthenium-based catalyst technology for hydrogen and ammonia electrolysis applications and published work/announcements highlighting engineered Ru-interfaces to boost catalyst durability and reduce dependence on scarcer iridium. Heraeus also continues to emphasise its ruthenium recycling capabilities as part of its Precious Metals business (recovering PGMs from end-of-life materials). These moves position Heraeus to supply both refined Ru products and Ru-based catalytic solutions for clean-energy use cases.
Report Coverage
The research report offers an in-depth analysis based on Type, Distribution Channel, Application, End-Use and Geography. It details leading market players, providing an overview of their business, product offerings, investments, revenue streams, and key applications. Additionally, the report includes insights into the competitive environment, SWOT analysis, current market trends, as well as the primary drivers and constraints. Furthermore, it discusses various factors that have driven market expansion in recent years. The report also explores market dynamics, regulatory scenarios, and technological advancements that are shaping the industry. It assesses the impact of external factors and global economic changes on market growth. Lastly, it provides strategic recommendations for new entrants and established companies to navigate the complexities of the market.
Future Outlook
- Ruthenium demand will rise as semiconductor nodes shrink and require advanced deposition materials.
- Adoption in chip resistors and HDD components will stay strong due to stable electrical performance needs.
- Catalytic applications will expand as industries shift toward energy-efficient and low-carbon chemical processes.
- Research on ruthenium-based oncology compounds will increase, supporting long-term pharmaceutical interest.
- Recycling programs will grow to reduce supply risk and stabilize availability across major industries.
- Use in hydrogen production and fuel-cell technologies will create new opportunities in clean-energy markets.
- Advanced ALD and CVD precursor development will accelerate to support next-generation semiconductor architectures.
- Demand for high-purity ruthenium will rise as chemical and material-science innovations scale globally.
- Supply-chain partnerships between refiners and electronics manufacturers will strengthen to ensure consistent purity.
- Asia-Pacific will maintain dominance due to continued expansion in electronics and catalyst manufacturing.


